Why Is a Moving Average a Lagging Indicator?
A moving average is called a lagging indicator because every point on the line is built from prices that have already been printed. It confirms a trend once the trend is under way, and the size of that delay can be estimated in advance.

What Is a Lagging Indicator
A lagging indicator is calculated from past data and changes only after the thing it measures has changed, so it confirms a move rather than forecasting one. The debate over leading vs lagging indicators is a trade-off: leading tools such as RSI try to flag a turn early and are wrong more often, while lagging tools are slower but steadier. That is the core of the moving average is a lagging indicator definition: the line can only report on prices already in the past.
Why a Moving Average Lags
A simple moving average adds up the last N closing prices and divides the total by N. Each new bar adds the latest close and drops the oldest. When the price turns, the window is still full of prices from before the turn, and the average keeps pointing the old way until enough new bars replace them.
The result is a smoother line that sits behind the price in a trend. Bar-to-bar noise is averaged out, and the delay is the cost of removing it.
How Much Does a Moving Average Lag
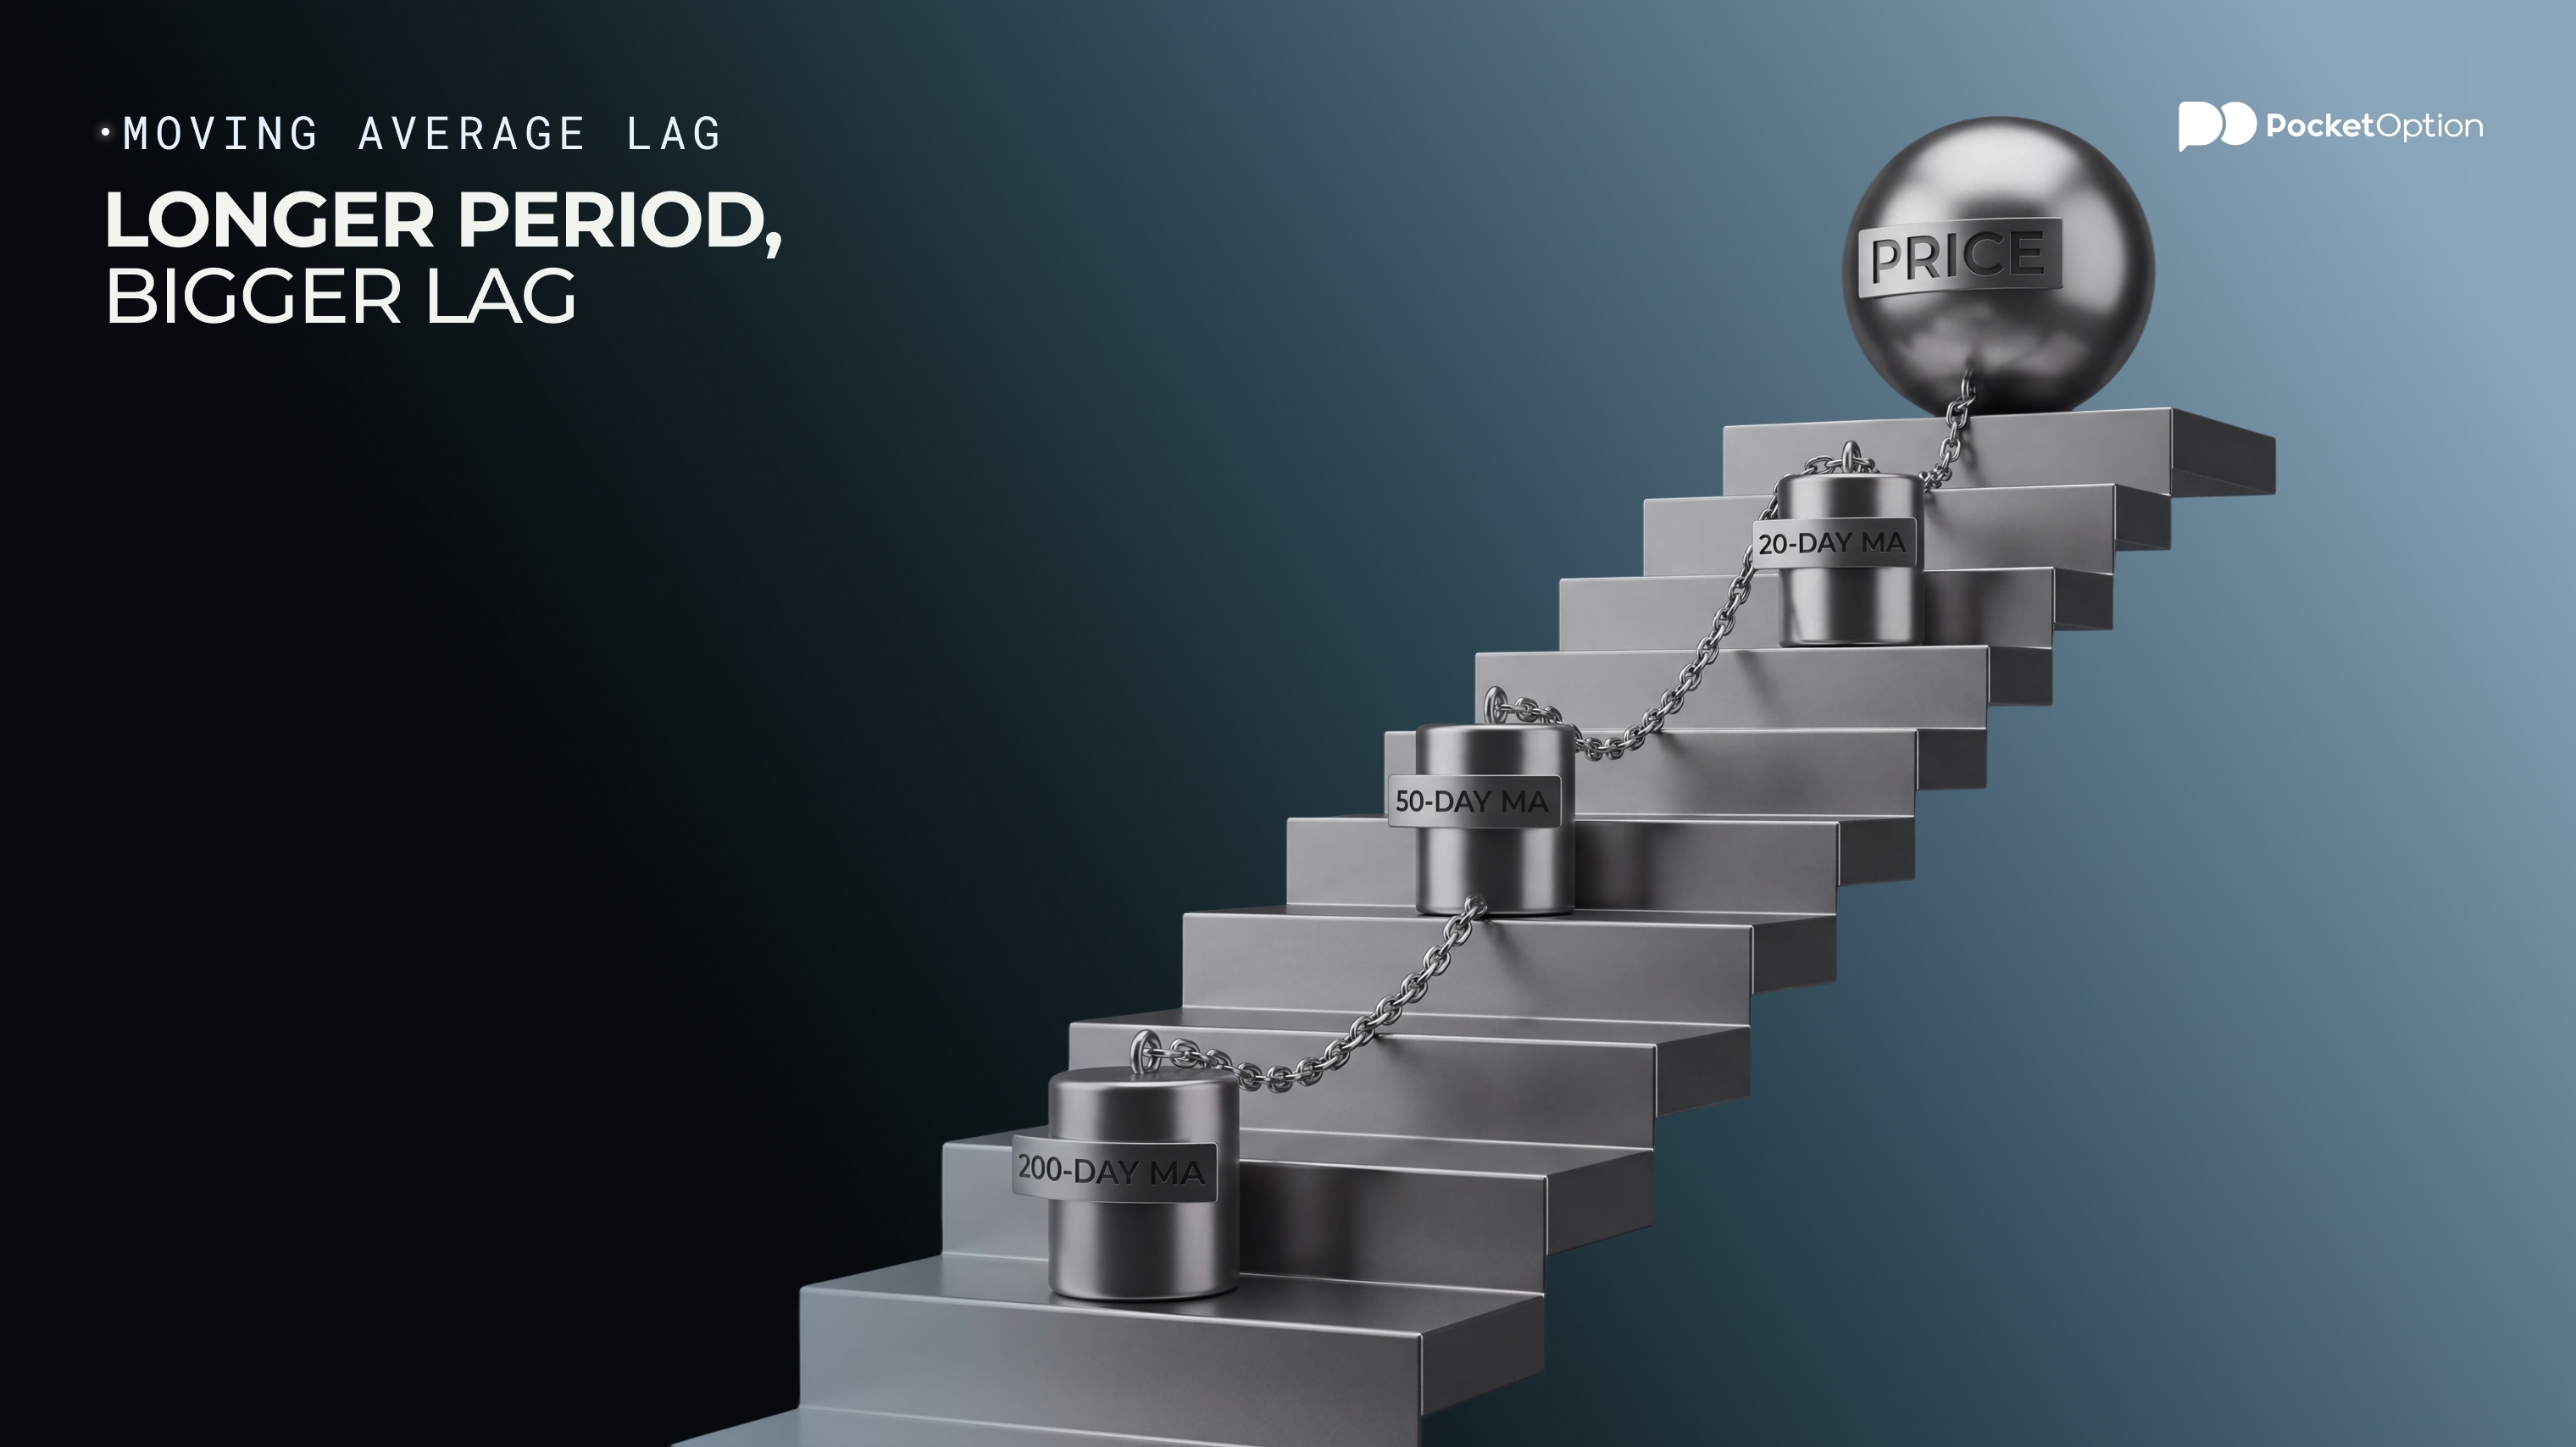
In a steady trend, a simple moving average trails the price by roughly (N - 1) ÷ 2 bars. Take a market that rises by $1 on every bar, with the last ten closes running from $101 up to $110:
10-period SMA: the average of $101 to $110 is $105.50, the price of 4.5 bars ago.
5-period SMA: the average of $106 to $110 is $108, the price of 2 bars ago.
Moving average lag grows as the window widens: about 9.5 bars for a 20-period average, 24.5 for a 50-period one and 99.5 for a 200-period one. Real trends are rarely this steady, so the figures are a guide only.
SMA, EMA and WMA: Do They All Lag
All three lag, by different amounts and in different ways:
Type | How prices are weighted | Lag in a steady trend | Reaction at a turn |
|---|---|---|---|
SMA | Equal weight for every bar | (N - 1) ÷ 2 bars | Slowest |
WMA | Weights fall in a straight line, newest highest | (N - 1) ÷ 3 bars | Faster than the SMA |
EMA | Weights fall exponentially, newest highest | (N - 1) ÷ 2 bars with the standard 2 ÷ (N + 1) factor | Faster than the SMA |
One detail is often missed: in a perfectly steady trend, a standard EMA ends up as far behind as an SMA of the same period. Its advantage shows at turning points, where it bends sooner. Faster lines pay for that with more false signals in choppy markets, a trade-off that shapes the choice between the moving averages used for day trading.
What Lag Means for Signals
Because every moving average reacts late, the signals built on it arrive late too. In a crossover system, a buy signal appears when a short average rises above a long one, and by then the price has usually travelled some distance from the low. On a daily chart, a 50/200 crossover can come weeks after the bottom.
In sideways markets the opposite problem appears: the lines cross back and forth and produce whipsaws. Pairing averages with other tools, as in this MA, MACD and ADX forex strategy, is one way to filter such signals, though each added tool brings its own delay.
How Traders Work With the Lag
The lag cannot be switched off, but it can be managed:
Use a long average as a trend filter, trading only in its direction, rather than as an entry trigger.
Wait for confirmation, such as a candle close beyond the average, accepting a later entry for fewer false starts.
Match the period to the holding time: a 200-period line is too slow for a trade that lasts a few bars.
Whatever settings are chosen, backtesting the strategy on past data shows how much of each move the delay costs before real money is involved, although a good test does not guarantee future results.
Conclusion
A moving average is a lagging indicator because it is calculated from prices that have already happened, so it confirms a trend rather than predicting it, and the delay grows with the period. Treat the lag as the price of a smoother line, choose a period that matches the holding time, expect faster averages to give more false signals, and test any crossover rule on past data before relying on it.
See the lag before risking money.
Try DemoDisclaimer: Trading involves significant risk of capital loss and may not be suitable for all investors. Past performance does not guarantee future results.
See more:Glossary