
MA, MACD and ADX Forex Strategy on Pocket Option
Every one of these indicators measures something different, combining them makes one of the most popular configurations in the world of forex trading. The guide tells about what each indicator adds to the process and how to join them together on Pocket Option.

Why Combine MA, MACD, and ADX
The mere use of an indicator does not guarantee any significant information. For instance, crossing of price by moving average might happen in an unstable market, while MACD could indicate the upward trend during a short-term rise in cases when there is a substantial downtrend happening. By combining three indicators measuring different features of price, the combination can eliminate many signals appearing as the result of noise and not trend itself.
As for this combination, every indicator has its own job: MA helps confirm the direction, MACD helps with entry timing, while ADX shows whether market trend strength is increasing or decreasing. A rising ADX points to strengthening momentum, but it does not guarantee that a trade signal will be successful.
What Each Indicator Contributes to the Strategy
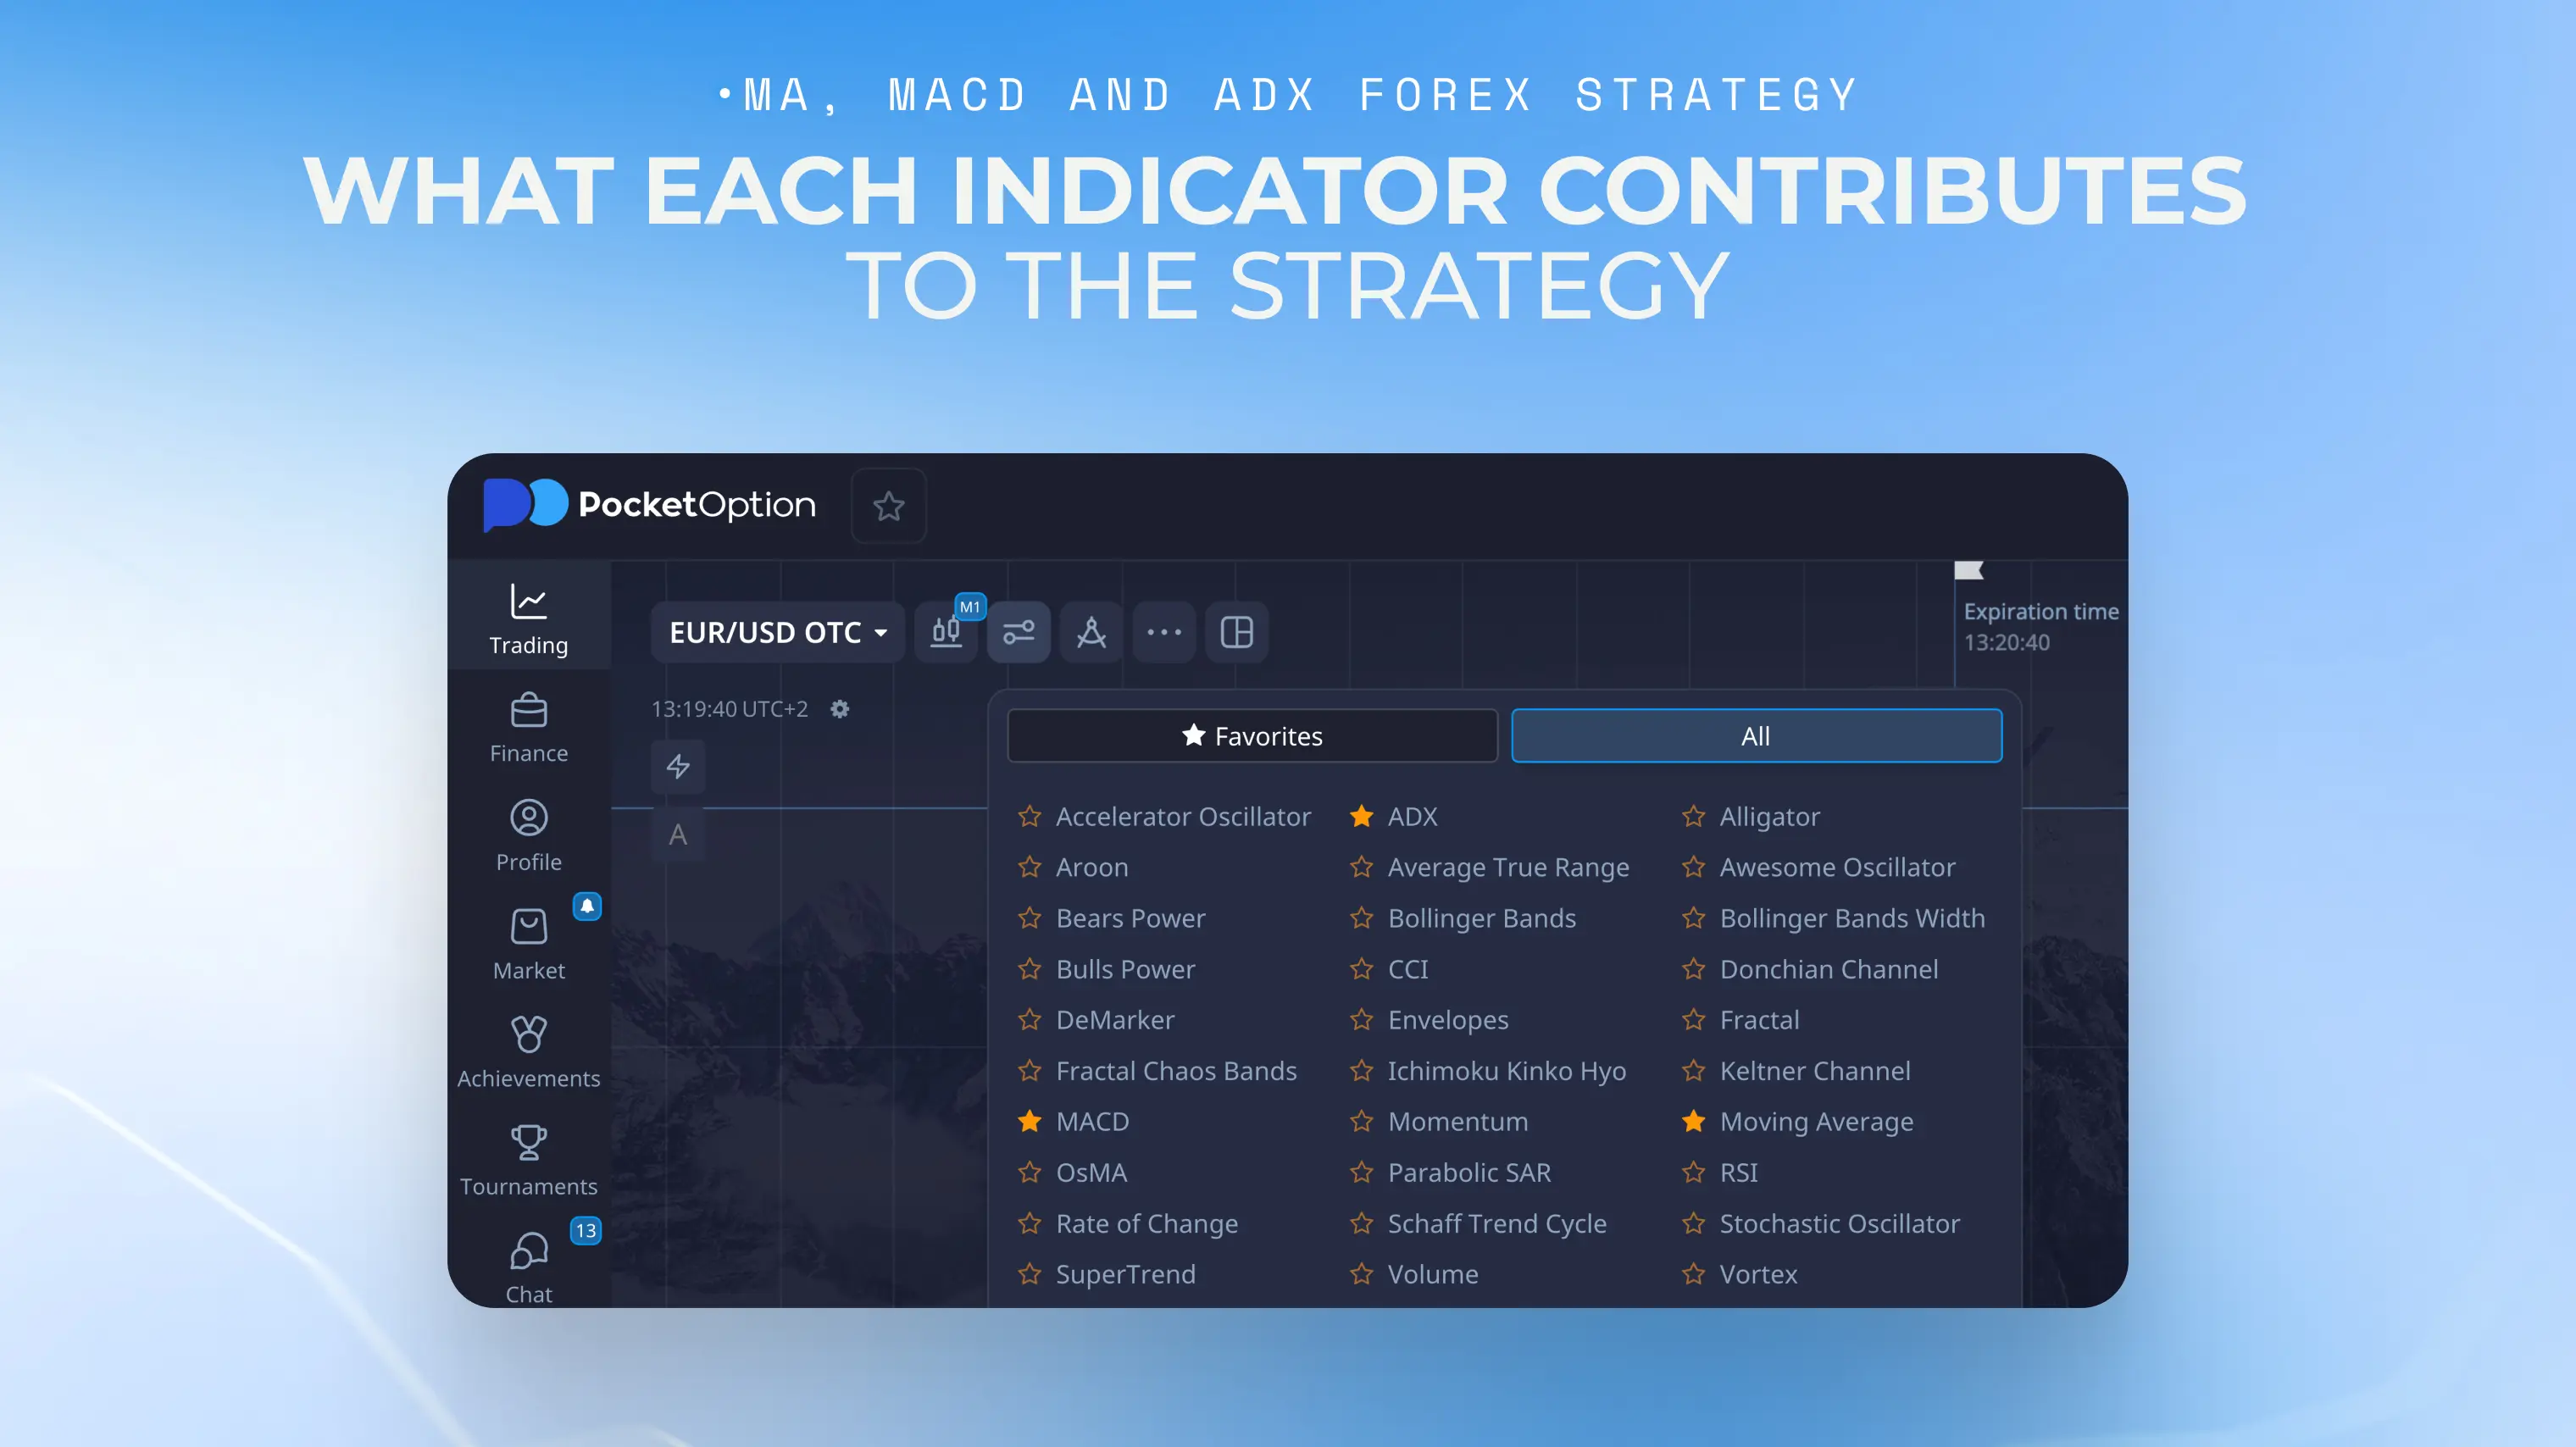
Traders looking for the best trend forex indicators often compare tools by the specific role each one plays in identifying direction, momentum, and trend strength. Every indicator in the combination has its own job; the lists are not completed with only one indicator at a time and any signals from a single oscillator cannot be interpreted as satisfactory by themselves.
Moving Average: Confirming Trend Direction
A moving average dampens fluctuations in prices in the short term so that it becomes easier to see the general direction. When the price is above a moving average with a longer period, the trend is viewed as positive. When prices fall below it, the trend is regarded as negative. More on the use of moving averages within the context of trend following can be found in forex trend trading guide.
MACD: Timing Entries and Spotting Momentum
The MACD indicator registers the correlation between two moving averages and presents the results as a momentum indicator. A crossing of the MACD curve above the signal line indicates the growth of the momentum in the trend direction. A crossing below means that the momentum is diminishing. Within the framework of this trading strategy, the MACD indicator is employed for accurate trade entries, given that the MA has already confirmed the trend direction. The recommended parameters for the MACD setting can be found in the MACD settings guide.
ADX: Filtering Out Weak or Ranging Markets
The ADX indicator does not establish the direction of the market. Rather, it shows the strength of a trend regardless of whether price is moving up or down. A rising ADX indicates that the current trend is strengthening, while a falling ADX indicates weakening trend strength. A falling ADX does not automatically mean that the market has entered a range, and neither reading guarantees whether an MA or MACD signal will succeed or fail. For a more comprehensive overview of this and the rest of the indicators, refer to the whole tutorial on indicators in the full indicator tutorial.
Suggested Settings for Each Indicator
Indicator | General Settings | What It Reveals |
|---|---|---|
Moving Average | 50 periods and applied to closing price | The general direction of the trend |
MACD indicator | 12, 26, 9 (standard) | The level of momentum and timing of the entry position |
ADX | 14 period, threshold of around 25 | Whether the market is trending |
These settings are commonly used starting points and not a hard-and-fast rule. They can be modified upon different pairs and time frames, and default settings should be always confirmed in the platform.
Buy Entry Rules
If you want to make a buy trade, you need three conditions to be met:
The price is above the chosen moving average meaning that the trend is upward
MACD is above its signal line meaning that the momentum is upwards too
ADX is above the chosen threshold and preferably rising, showing that trend strength is increasing
Sell Entry Rules
In the case of the sell signal, all the conditions will be the same, but in an opposite way:
The price is below the chosen moving average meaning that the trend is downward
MACD is below its signal line meaning that the momentum is downwards too
ADX is above the chosen threshold and preferably rising, showing that the downward trend is gaining strength
Setting Stop-Loss and Take-Profit Levels
The stop-loss and take-profit rules in this section apply when the strategy is used through MT4/MT5, where these protective orders can be attached to an open forex position. In Pocket Option Quick Trading, trades use a fixed expiration time, so a conventional stop-loss is not used the same way.
For an MT4/MT5 position, the initial stop-loss can be placed beyond the latest relevant swing low for a buy trade or above the latest swing high for a sell trade. It may later be adjusted according to the trader’s management rules rather than being treated as permanently fixed entry.
A simple take-profit rule is to target twice the initial risk. For example, if the distance between the entry and stop-loss is 25 pips, the take-profit can be set 50 pips from the entry, creating a 1:2 risk-to-reward ratio. The same rule should be defined before the trade rather than choosing an exit only after price starts moving.
Time Frames and Currency Pairs to Test with This Strategy
Because this strategy relies on trend confirmation, H1 and higher timeframes can be practical starting points for testing it, as they generally contain less short-term price noise. This does not mean that one timeframe is automatically more effective than another, so traders should compare results across different timeframes. Information on time frame selection is available in the best time frame guide.
Major currency pairs can also be convenient starting points because of their typically higher liquidity. However, the strategy is not limited to majors, and its performance should be tested separately for each pair and market condition.
Setting Up the Strategy on Pocket Option
The three indicators can be added from the indicator panel available on the Pocket Option chart interface. Each of the three indicators, namely, Moving Average, MACD, and ADX can all be applied to the chart with the necessary adjustments made in the indicator settings prior to executing any trades.
The way the strategy is applied depends on the trading mode. MA, MACD, and ADX can be used for chart analysis, but the Stop Loss and Take Profit rules described above are intended for MT4/MT5 forex positions. Pocket Option Quick Trading uses fixed trade expiration instead of a conventional Stop Loss attached to an open position.
with Pocket Option
Quick StartBacktesting the Strategy Before Trading Live
Before making use of the strategy with real units of currency, the historical prices should be analyzed to find out how often the three set criteria came together, and what would have happened in case the trades had been made. Testing a strategy in the past does not guarantee anything about the future, but it can help to understand if it makes sense to use the rules since they can generate either an insufficient number of setups or too many to be effective.
Common Mistakes When Combining Multiple Indicators
Some of the common mistakes can undermine the effectiveness of the approach:
Following the signals of one indicator while neglecting the other two
Reducing the value of the ADX threshold to receive more signals
Using the same settings for a different pair or timeframe
Moving the Stop Loss farther from the original risk level simply to avoid a losing position
Practicing on the Pocket Option Demo Account
The demo account provides for the testing of all three indicators collectively in real market conditions without incurring any financial risk. It is at this stage that entry rules are refined, and the trader learns how often real signals are formed before investing in real money.
Reviewing Trades After Each Session
Note-taking of what signals were entered and whether all three conditions were fulfilled when entering a trade makes it easier to determine the origin of loss - whether the market moved against a good signal or the rules were not followed.
Adjusting the Strategy as Conditions Change
Over time markets move between stronger trends, weaker trends, and ranging conditions. A rising ADX suggests that trend strength is increasing, while a falling ADX shows that the current trend is losing strength. A declining ADX alone does not prove that the market has entered a range. Review the strategy settings as conditions change rather than threatening one ADX reading as an automatic trading decision.
Conclusion
MA, MACD, and ADX give answers to different questions: where the price is moving, when should the trade be executed, and if the market changes fast enough to act on it. Using the indicators together can help filter some weaker or conflicting setups, although the combination does not guarantee that an individual signal will be successful.
Open an account and put this strategy into practice.
Create AccountDisclaimer: Trading forex and various financial instruments carries high risks of losing money and may not be appropriate for every investor. past performance as well as the parameters of the indicators discussed here do not guarantee future success. Independent advice should be acquired whenever needed and conditions of trading should be verified on the Pocket Option platform as they may be different.
See more:InterestingTrading Strategies