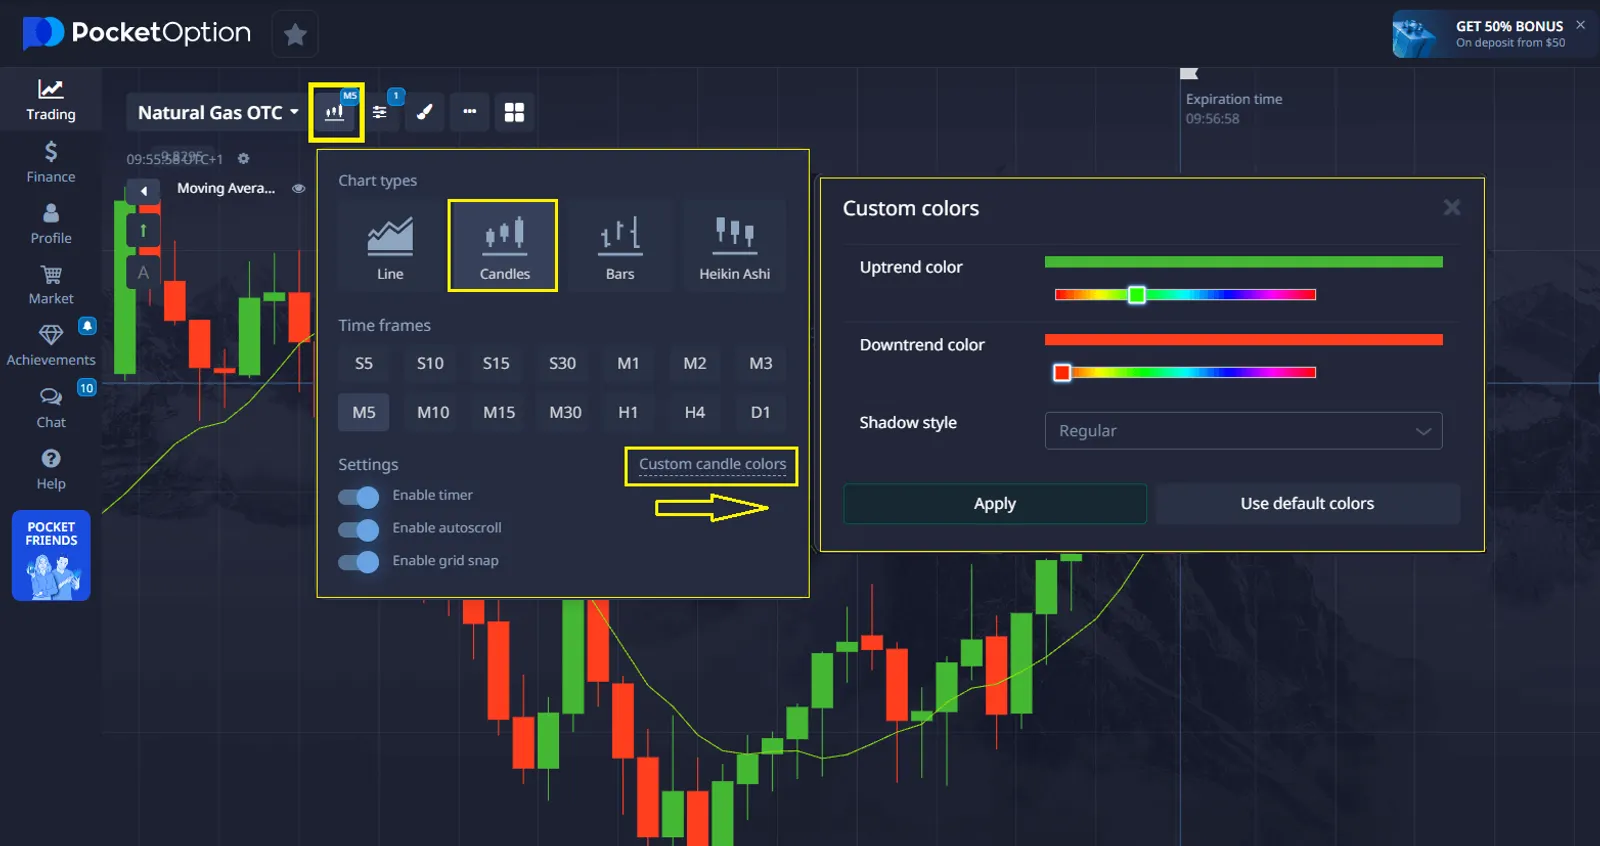
- Bộ chọn khung thời gian – từ 5 giây đến 1 tháng
- Chuyển đổi loại biểu đồ – chuyển đổi giữa các kiểu hiển thị
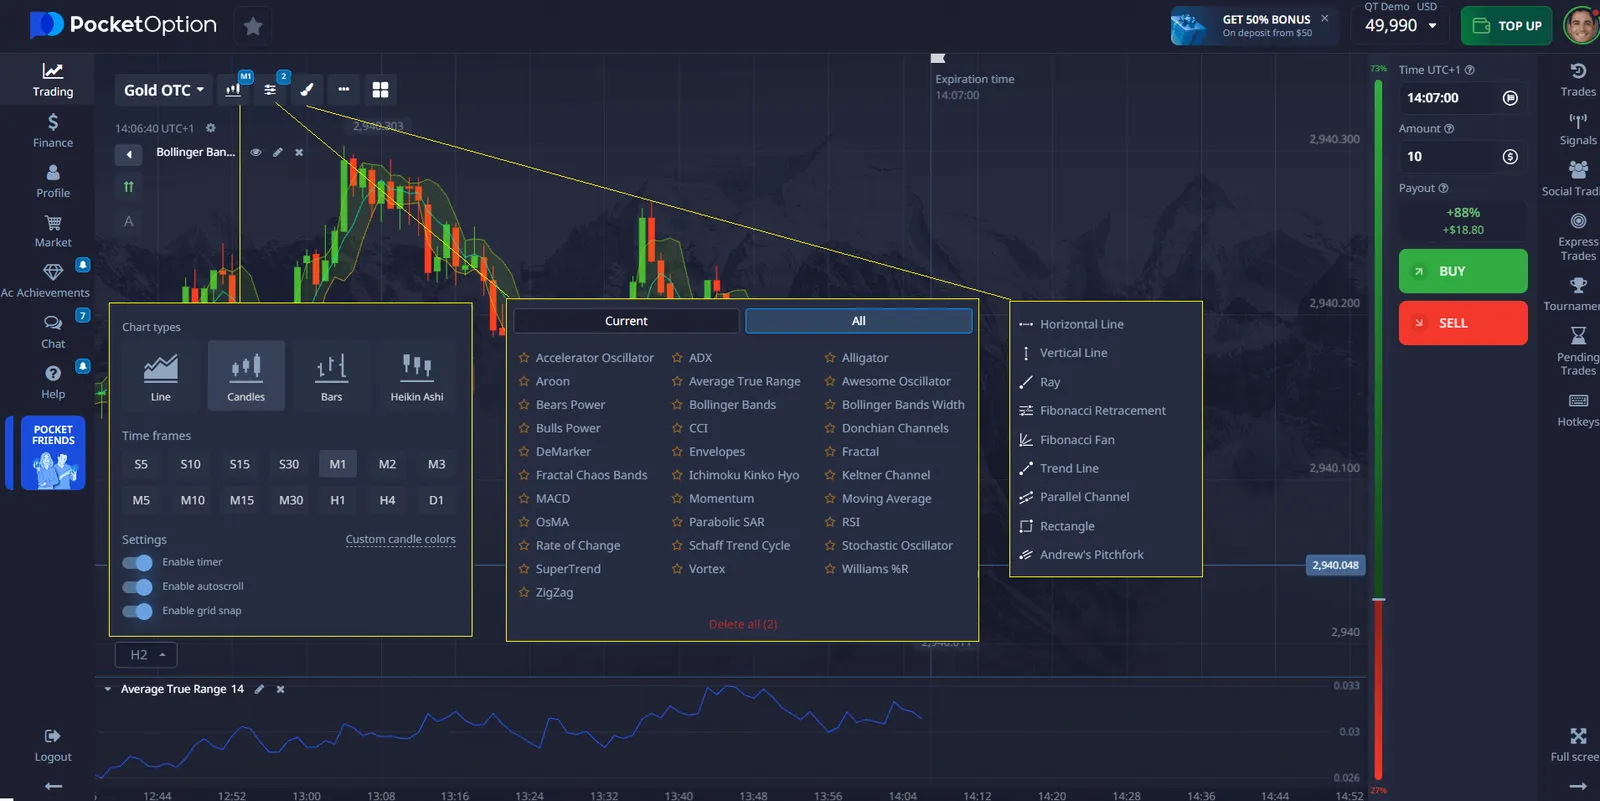
- Menu chỉ báo – chứa hơn 30 chỉ báo kỹ thuật
- Công cụ vẽ – bao gồm đường xu hướng, Fibonacci và hình chữ nhật
- Biểu đồ đa – hiển thị nhiều biểu đồ cùng một lúc
Cách Đọc Biểu Đồ Pocket Option

Việc thành thạo phân tích biểu đồ trên Pocket Option có thể cải thiện đáng kể kết quả giao dịch của bạn. Bài viết này phân tích các khía cạnh phức tạp của phân tích kỹ thuật thành những hiểu biết có thể hành động, giúp bạn xác định các mô hình có lợi nhuận và đưa ra quyết định dựa trên dữ liệu trên một trong những nền tảng giao dịch phổ biến nhất hiện nay.
Article navigation
- Nền tảng của việc đọc biểu đồ hiệu quả trên Pocket Option
- Điều Hướng Giao Diện Biểu Đồ của Pocket Option
- Biểu Đồ Đường: Đơn Giản Thời Gian Thực
- Thực Hành và Học Hỏi với Các Công Cụ Giáo Dục trên Pocket Option
- Tùy Chỉnh Các Biểu Đồ Pocket Option của Bạn
- Kết Luận: Làm Chủ Phân Tích Biểu Đồ Pocket Option
Nền tảng của việc đọc biểu đồ hiệu quả trên Pocket Option
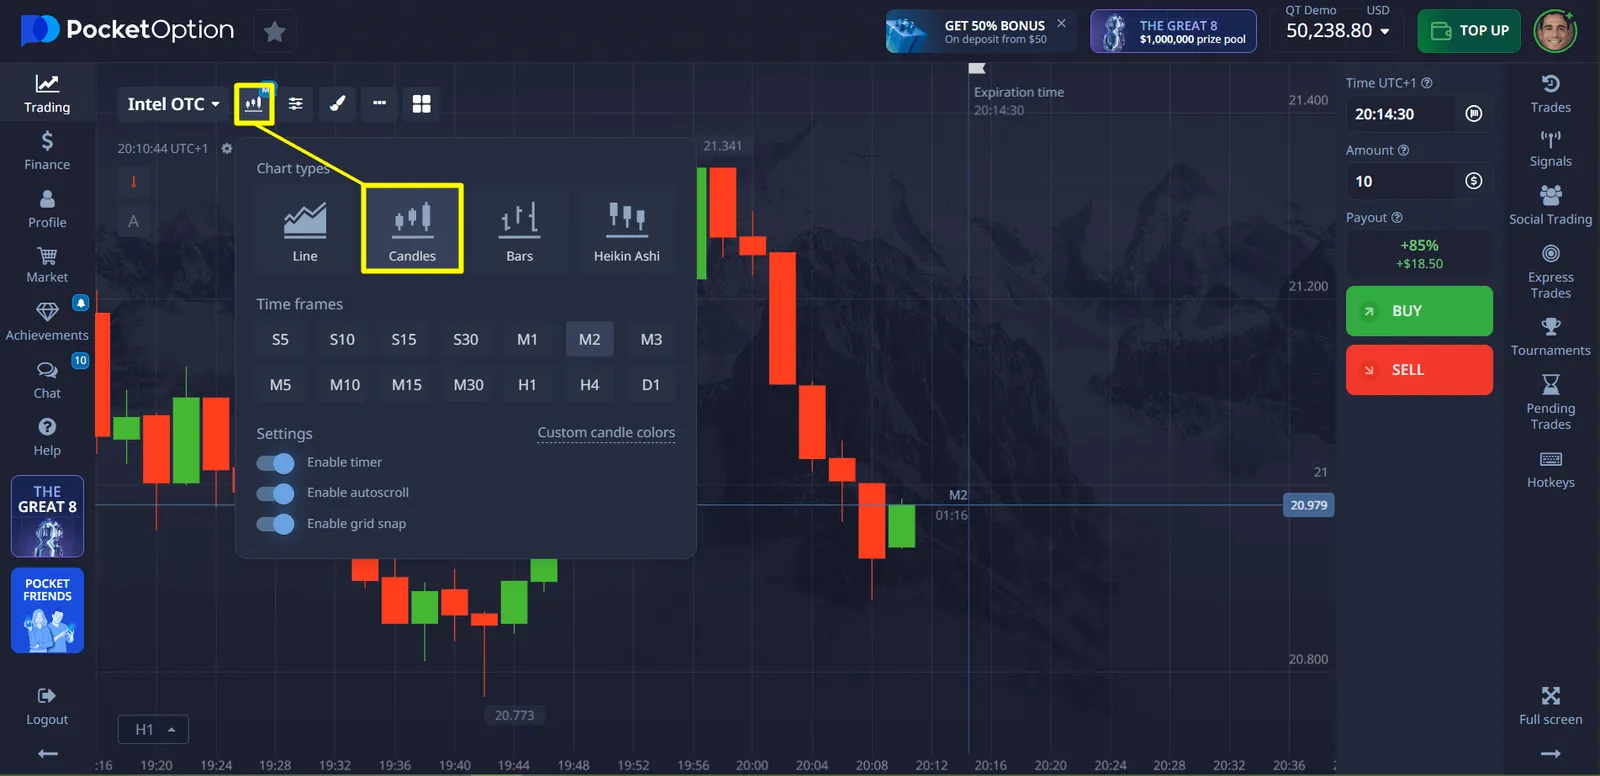
Hiểu cách đọc biểu đồ trên Pocket Option là điều cần thiết cho giao dịch có lợi nhuận. Nền tảng cung cấp bốn loại biểu đồ khác nhau: Nến, Thanh, Đường và Heiken Ashi, mỗi loại tiết lộ các khía cạnh khác nhau của hành vi thị trường. Theo thống kê của nền tảng, các nhà giao dịch thành thạo phân tích nến cải thiện tỷ lệ thành công của họ!
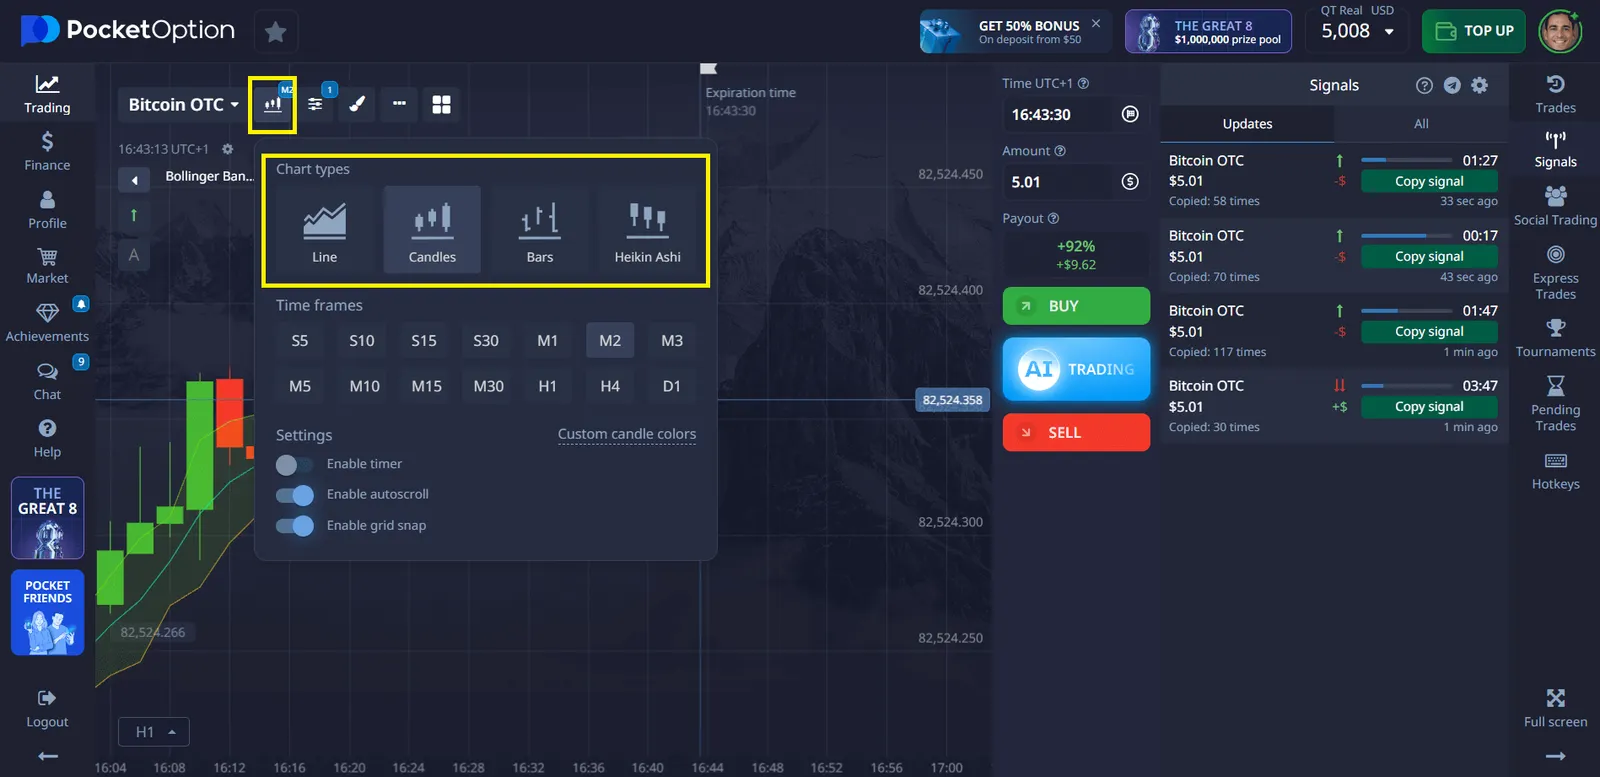
Dưới đây là sự so sánh các loại biểu đồ có sẵn trên Pocket Option:
| Loại Biểu Đồ | Được Sử Dụng Tốt Nhất Cho | Ứng Dụng Thực Tế |
|---|---|---|
| Biểu Đồ Đường | Tổng quan xu hướng | Xác định hướng đi chính của thị trường mà không có tiếng ồn |
| Biểu Đồ Thanh | Phân tích khoảng giá | So sánh vị trí mở/đóng qua các phiên |
| Biểu Đồ Nến | Nhận diện mẫu hình | Phát hiện tín hiệu đảo chiều như mẫu hình bao trùm |
| Heiken Ashi | Lọc xu hướng | Giảm tín hiệu sai trong các giai đoạn biến động |
Điều Hướng Giao Diện Biểu Đồ của Pocket Option
Giao diện biểu đồ của Pocket Option chứa năm thành phần chính được đặt ở đầu màn hình:
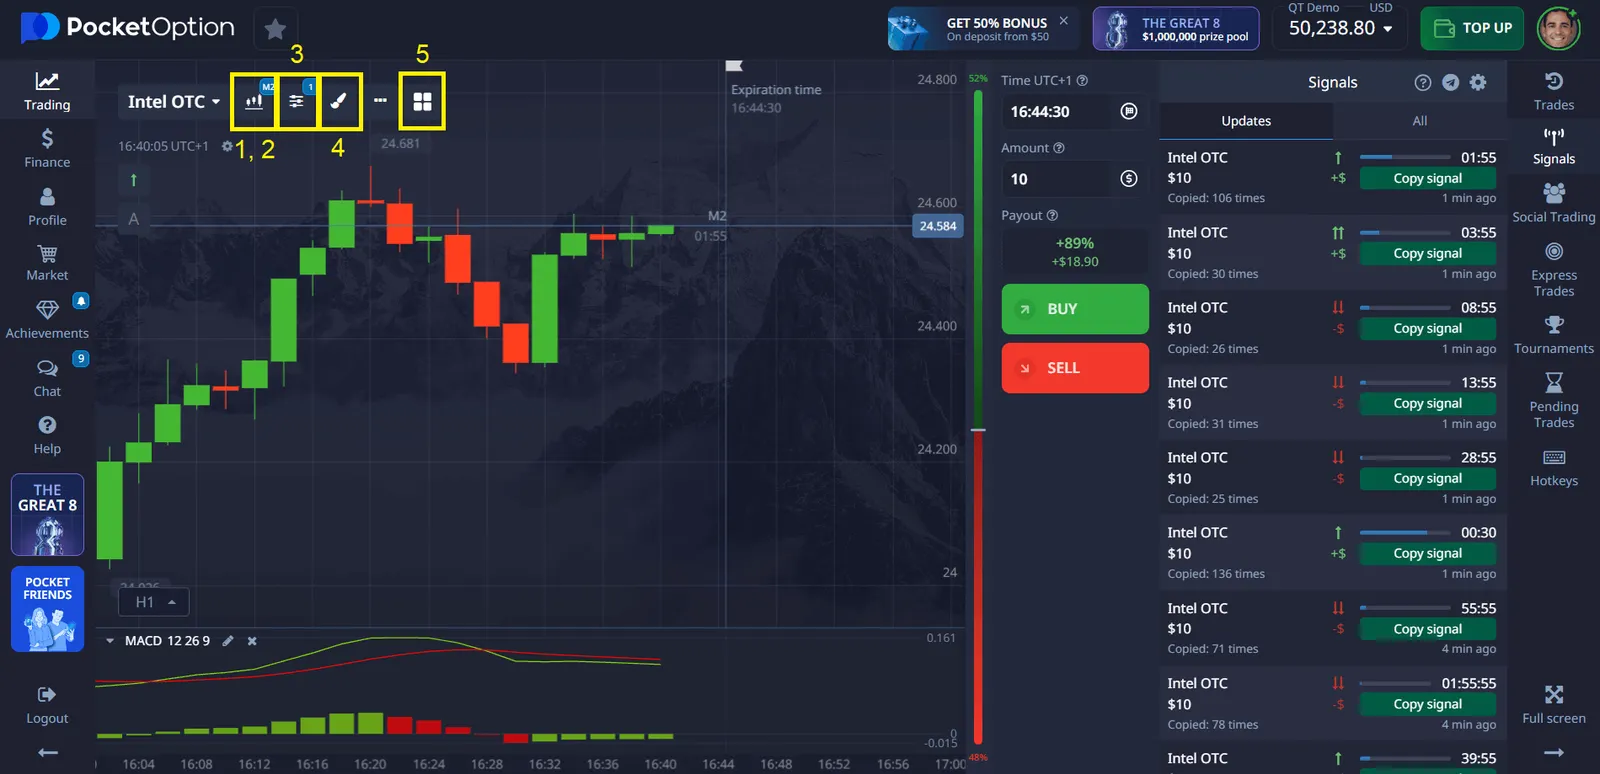
Để giao dịch nhiều cặp tiền tệ cùng một lúc, hãy chọn bố cục biểu đồ đa (2-4 biểu đồ) bằng cách sử dụng nút bên cạnh logo nền tảng, hoặc mở nhiều tab trình duyệt để có thêm tùy chọn xem.
Biểu Đồ Đường: Đơn Giản Thời Gian Thực
Biểu đồ Đường trên Pocket Option là một biểu đồ dựa trên tick theo dõi chuyển động giá thời gian thực. Nó nhấn mạnh những thay đổi nhỏ, nhanh chóng—tick—và khi phóng to, bạn có thể quan sát nhiều tick mỗi giây. Các nhà giao dịch cũng có thể kích hoạt tính năng “khu vực” trong cài đặt biểu đồ, điều này làm đầy không gian bên dưới đường để có cái nhìn tốt hơn.
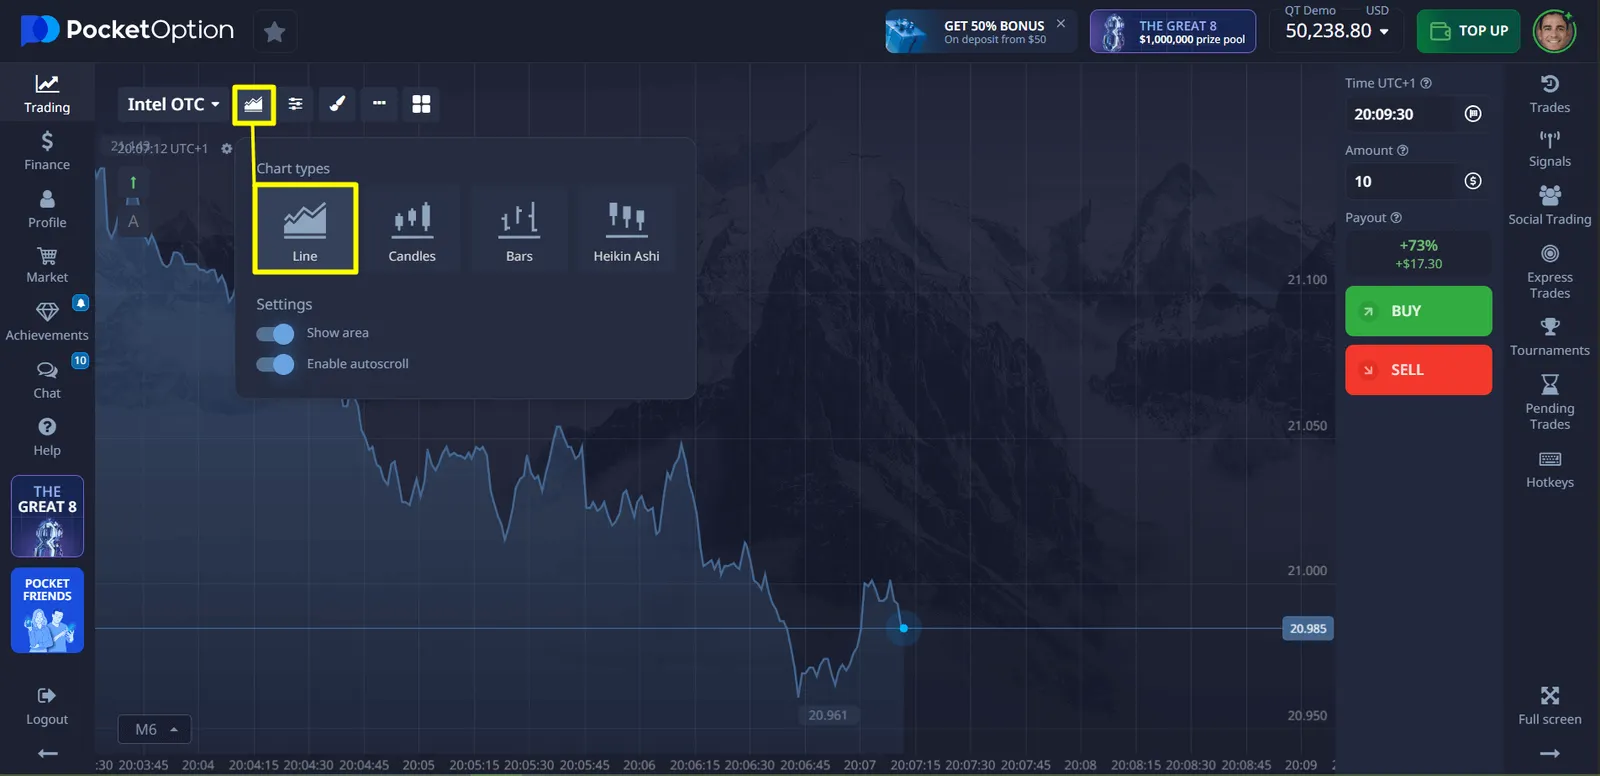
Biểu đồ này phù hợp nhất để theo dõi những thay đổi giá ngắn hạn và thực hiện các đánh giá thị trường nhanh chóng. Nó cung cấp một bố cục sạch sẽ, tối giản mà không có các yếu tố chi tiết như giá mở hoặc giá đóng. Biểu đồ Đường đặc biệt có giá trị cho các nhà giao dịch tập trung vào động lực giá và tìm kiếm cái nhìn nhanh chóng, đơn giản về hướng đi của thị trường.
Biểu Đồ Nến: Phân Tích Thị Trường Sâu Sắc
Biểu đồ Nến là một trong những loại biểu đồ chi tiết và được sử dụng rộng rãi nhất trên Pocket Option. Mỗi cây nến đại diện cho một khoảng thời gian đã chọn và bao gồm bốn điểm dữ liệu thiết yếu:
- Giá mở – nơi giá bắt đầu trong khoảng thời gian
- Giá đóng – nơi giá kết thúc trong khoảng thời gian
- Cao – giá cao nhất đạt được
- Thấp – giá thấp nhất được ghi nhận
Thân nến được mã hóa màu để chỉ ra liệu giá đã tăng (tăng giá) hay giảm (giảm giá), trong khi bấc cho thấy toàn bộ khoảng giá trong thời gian đó.
Biểu đồ này lý tưởng cho:
- Phân tích kỹ thuật và xác định các mẫu hình thị trường
- Phát hiện xu hướng và các mức hỗ trợ/kháng cự chính
- Hiểu tâm lý thị trường thông qua kích thước và màu sắc của nến
Biểu đồ Nến là hoàn hảo cho các nhà giao dịch dựa vào dữ liệu lịch sử chính xác và cần cái nhìn toàn diện về hành vi thị trường để đưa ra quyết định thông minh.
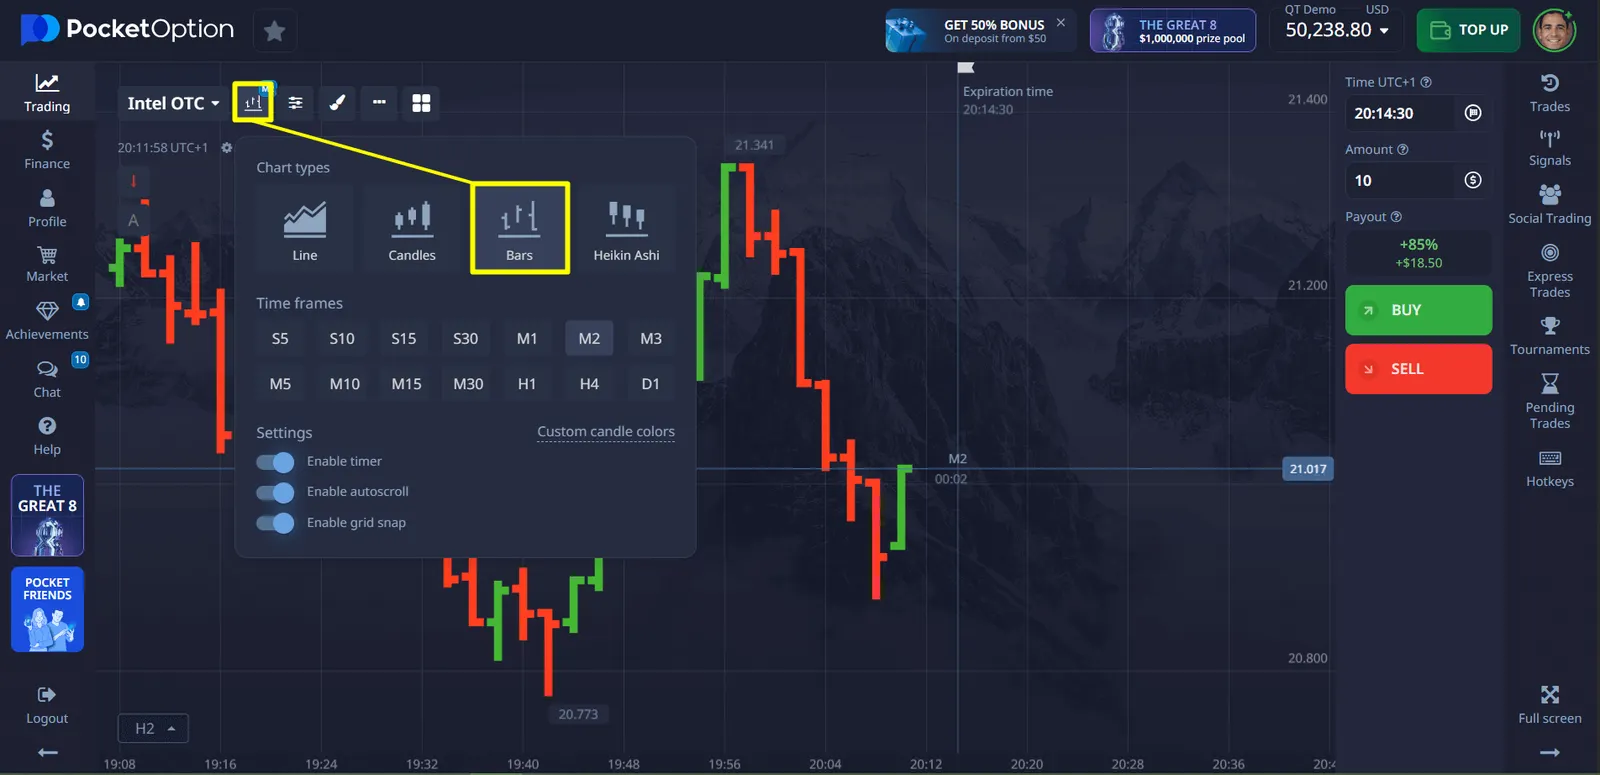
Biểu Đồ Thanh: Chi Tiết nhưng Tối Giản
Biểu đồ Thanh trên Pocket Option cung cấp thông tin giá toàn diện cho mỗi khoảng thời gian đã chọn trong định dạng không phải nến. Mỗi thanh bao gồm:
- Giá mở (tick ngang bên trái)
- Giá đóng (tick ngang bên phải)
- Cao (đỉnh của thanh dọc)
- Thấp (đáy của thanh dọc)
Biểu đồ này được sử dụng tốt nhất cho:
- Phân tích độ biến động giá qua chiều dài thanh
- Phát hiện xu hướng bằng cách quan sát chuỗi thanh
- Phân tích kỹ thuật với độ rõ ràng cao về giá cao-thấp-mở-đóng
So với nến, biểu đồ Thanh cung cấp ít sự lộn xộn về hình ảnh hơn, khiến nó trở thành lựa chọn yêu thích cho các nhà giao dịch tập trung hoàn toàn vào hành động giá và cấu trúc thay vì thẩm mỹ.
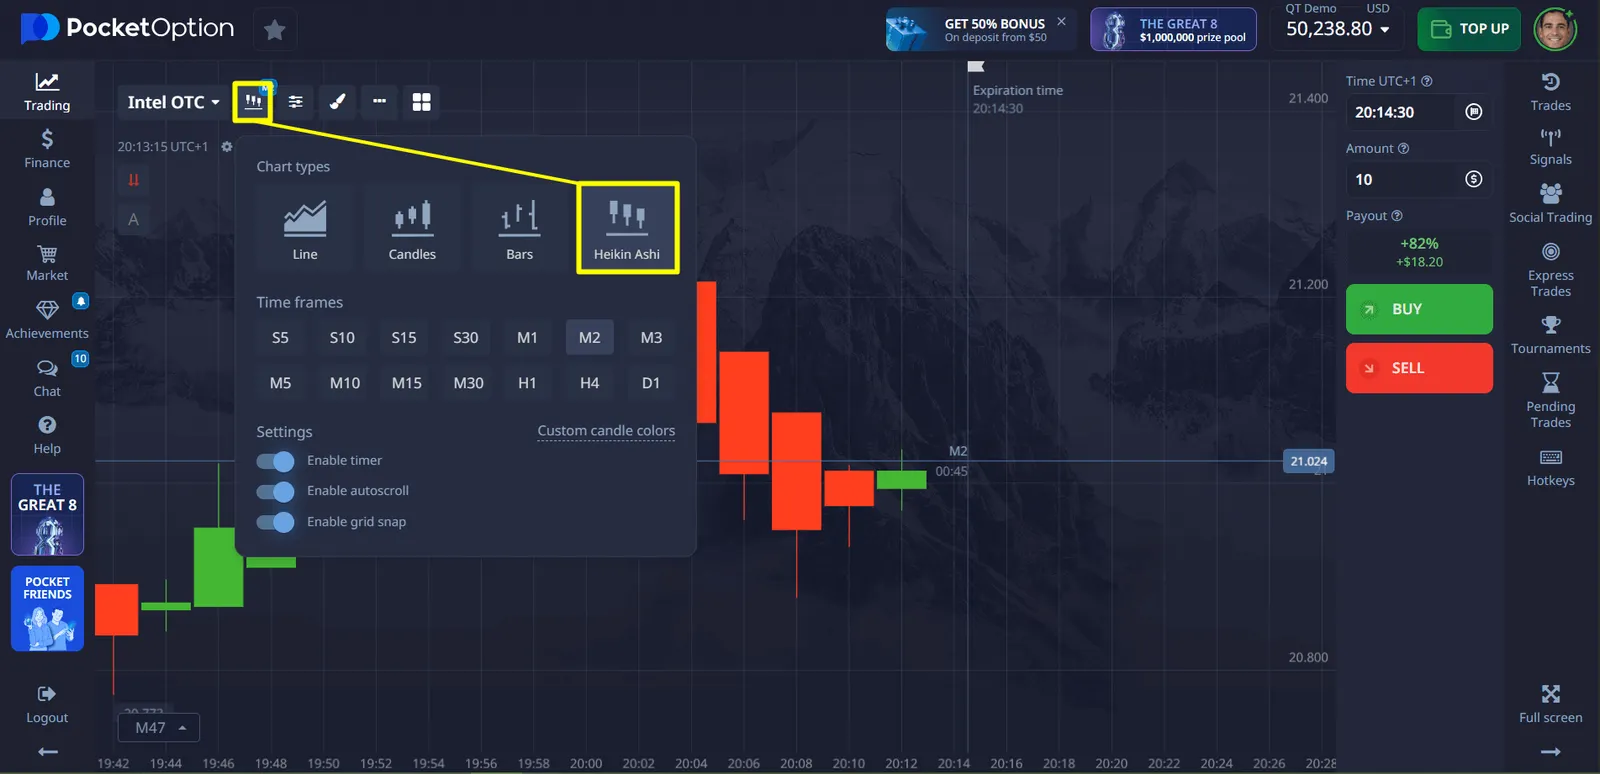
Biểu Đồ Heikin Ashi: Rõ Ràng Xu Hướng Qua Việc Làm Mềm
Biểu đồ Heikin Ashi là một loại biểu đồ chuyên biệt sử dụng các công thức đã được sửa đổi để làm mịn dữ liệu giá và làm nổi bật các xu hướng. Khác với các cây nến truyền thống, nó tính toán các giá trị mới cho mỗi cây nến dựa trên trung bình, điều này giảm tiếng ồn của thị trường.
Các đặc điểm chính:
- Nến được làm mịn giúp giảm thiểu biến động ngẫu nhiên
- Hướng xu hướng rõ ràng hơn nhờ tính nhất quán về hình ảnh
- Tín hiệu đảo chiều được cải thiện với ít tiếng ồn sai
- Cái nhìn thị trường sạch hơn, rộng hơn cho việc lập kế hoạch chiến lược
Tốt nhất cho:
- Chiến lược theo xu hướng
- Giao dịch swing để xác định điểm vào/ra tối ưu
- Phân tích dài hạn qua các khung thời gian lớn hơn
Biểu đồ Heikin Ashi là lý tưởng cho các nhà giao dịch muốn cắt giảm sự biến động và tập trung vào hướng đi rộng hơn của thị trường, giúp tránh các tín hiệu gây hiểu lầm và nâng cao độ rõ ràng.
Thực Hành và Học Hỏi với Các Công Cụ Giáo Dục trên Pocket Option
Trên Pocket Option, phần Giáo Dục cung cấp các chiến lược chi tiết được điều chỉnh cho các loại biểu đồ khác nhau—chẳng hạn như biểu đồ Nến.
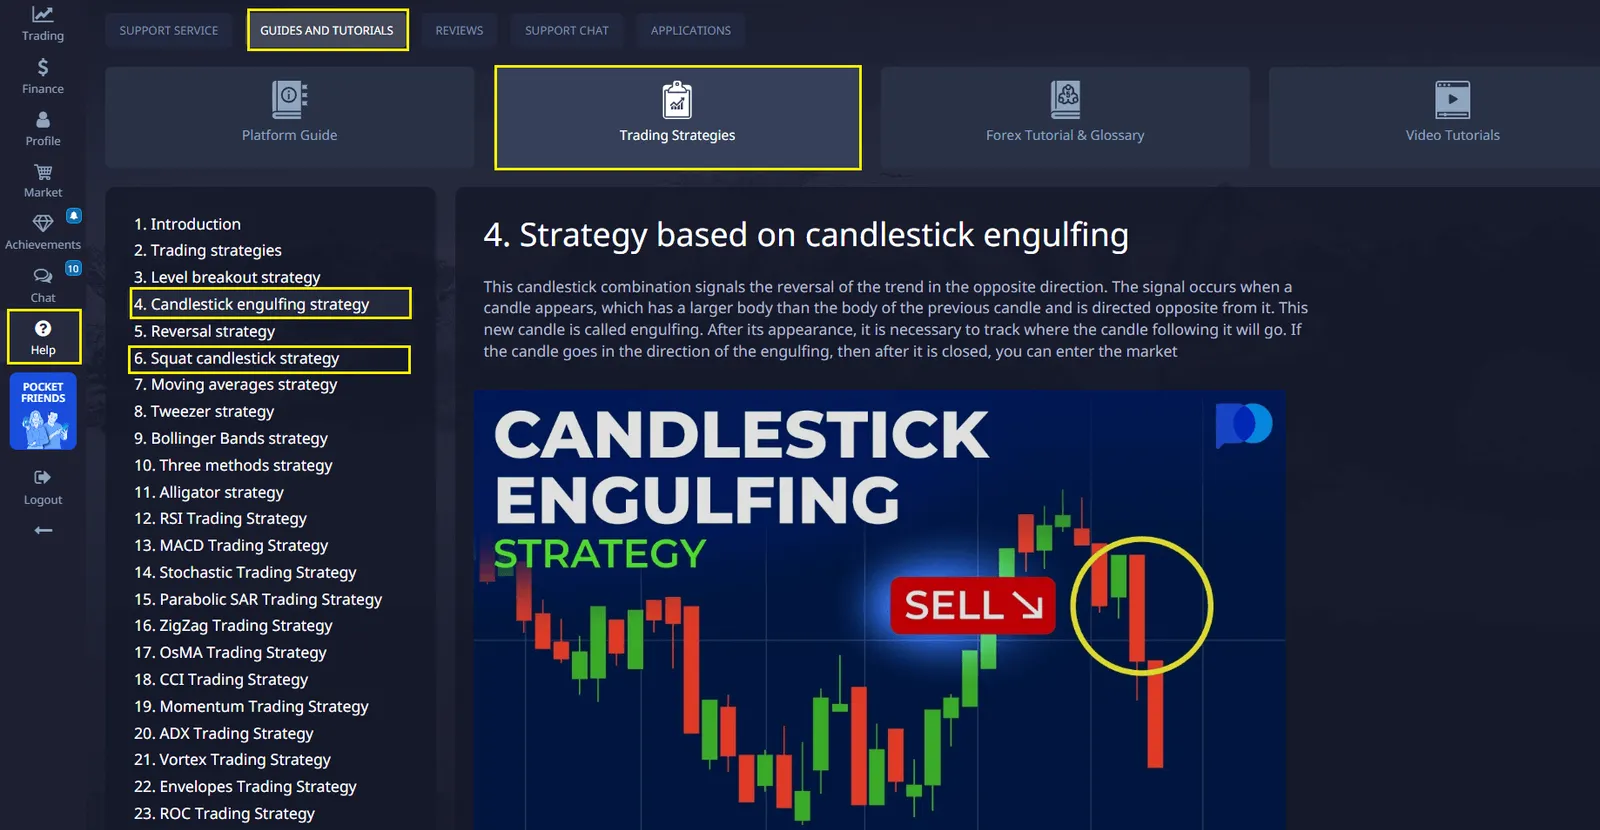
Các tài nguyên này giải thích cách diễn giải dữ liệu biểu đồ và xây dựng các chiến lược giao dịch hiệu quả dựa trên các mẫu hình và hành vi giá. Thêm vào đó, Pocket Option cung cấp một tài khoản demo miễn phí với $50,000, cho phép người dùng thực hành giao dịch trong môi trường không rủi ro và tăng cường sự tự tin trước khi chuyển sang quỹ thực.
Tùy Chỉnh Các Biểu Đồ Pocket Option của Bạn
Biết cách đọc các biểu đồ Pocket Option một cách hiệu quả cũng liên quan đến việc cá nhân hóa thiết lập hình ảnh của bạn. Nền tảng cho phép tùy chỉnh rộng rãi:
- Thay đổi màu biểu đồ (có sẵn chủ đề sáng/tối)
- Điều chỉnh kích thước và khoảng cách của nến
- Lưu nhiều mẫu biểu đồ cho các chiến lược khác nhau
- Tạo hồ sơ cài đặt chỉ báo tùy chỉnh
- Đặt cảnh báo giá ở các mức quan trọng
Kết Luận: Làm Chủ Phân Tích Biểu Đồ Pocket Option
Học cách đọc các biểu đồ Pocket Option kết hợp kiến thức kỹ thuật với kinh nghiệm thực tế. Tập trung vào việc làm chủ một loại biểu đồ và 2-3 chỉ báo trước khi mở rộng bộ công cụ phân tích của bạn. Theo dõi độ chính xác trong việc đọc biểu đồ của bạn trong một nhật ký giao dịch, ghi chú các mẫu hình và chỉ báo nào chứng minh là đáng tin cậy nhất cho phong cách giao dịch của bạn.
Hãy nhớ rằng việc đọc biểu đồ hiệu quả trên Pocket Option không phải là về độ phức tạp – mà là về sự nhất quán trong việc áp dụng các kỹ thuật phân tích đã được chứng minh. Bắt đầu với các mẫu hình nến và các kết hợp chỉ báo được nêu ở trên, sau đó tinh chỉnh cách tiếp cận của bạn dựa trên kết quả giao dịch thực tế.
FAQ
Khung thời gian nào hoạt động tốt nhất cho phân tích biểu đồ trên Pocket Option?
Đối với giao dịch trong ngày, hãy sử dụng biểu đồ 15 phút và 1 giờ làm khung thời gian chính của bạn. Những người giao dịch lướt sóng nên tập trung vào biểu đồ 1 phút và 5 phút, trong khi những người giao dịch theo xu hướng sẽ hưởng lợi nhiều nhất từ khung thời gian 4 giờ và hàng ngày.
Làm thế nào để tôi có thể xác định các đột phá giả trên biểu đồ Pocket Option?
Tìm kiếm xác nhận khối lượng—các đột phá thực sự cho thấy khối lượng tăng, trong khi các đột phá giả không có. Chờ cho nến đóng hoàn toàn vượt qua mức đột phá và kiểm tra xem giá có nhanh chóng trở lại phạm vi trước đó hay không.
Các chỉ báo nào hoạt động tốt nhất với biểu đồ nến của Pocket Option?
RSI, Đường trung bình động (20 và 50 kỳ), và Dải Bollinger cung cấp các tín hiệu xác nhận đáng tin cậy nhất. Những chỉ báo này bổ sung cho các mô hình nến trong khi giảm thiểu thông tin dư thừa có thể dẫn đến phân tích quá mức.
Làm thế nào để tôi nhận biết sự đảo chiều xu hướng trên biểu đồ Pocket Option?
Theo dõi sự phân kỳ giữa hành động giá và RSI hoặc MACD, cùng với các mẫu nến đảo chiều quan trọng. Khi giá tạo ra các đỉnh cao hơn nhưng các chỉ báo tạo ra các đỉnh thấp hơn (hoặc ngược lại), một sự đảo chiều thường xảy ra.
Tôi có thể sử dụng biểu đồ Pocket Option cho các chiến lược scalping không?
Có, Pocket Option hỗ trợ scalping với các khung thời gian xuống đến 5 giây. Để scalping hiệu quả, hãy sử dụng loại biểu đồ Heiken Ashi để giảm tiếng ồn, đặt EMA ở 5 và 13 kỳ, và tập trung vào các cặp tiền tệ có chênh lệch hẹp.
Giao dịch
Sign up for more like this
Customize your newsfeed with content you're actually interested in — get up-to-date personalized newsletter in your inbox.
Your comment
Comments are pre-moderated to ensure they comply with our blog guidelines.