How to Read Pocket Option Charts
Mastering chart analysis on Pocket Option can boost trading results. This article explains key technical patterns and actionable insights for smarter trades.
The Foundation of Effective Chart Reading on Pocket Option
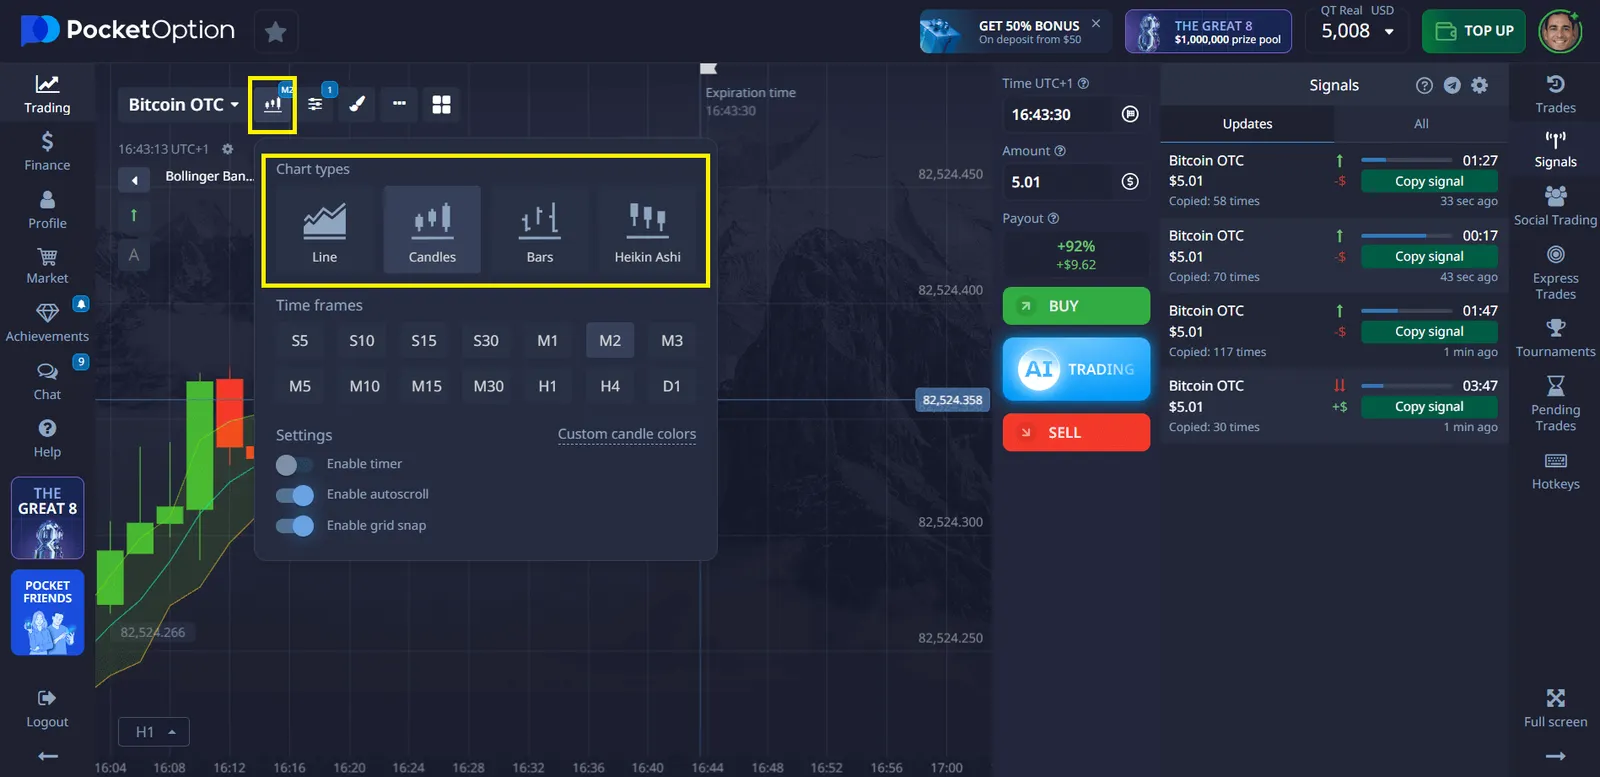
Understanding how to read Pocket Option charts is essential for profitable trading. The platform offers four distinct chart types: Candles, Bars, Line, and Heiken Ashi, each revealing different aspects of market behavior. According to platform statistics, traders who master candlestick analysis improve their success rate!
Here's a comparison of chart types available on Pocket Option:
| Chart Type | Best Used For | Practical Application |
|---|---|---|
| Line Charts | Trend overview | Identify major market direction without noise |
| Bar Charts | Price range analysis | Compare opening/closing positions across sessions |
| Candlestick Charts | Pattern recognition | Spot reversal signals like engulfing patterns |
| Heiken Ashi | Trend filtering | Reduce false signals during volatile periods |
Navigating Pocket Option's Chart Interface
Pocket Option's chart interface contains five key components positioned at the top of the screen:
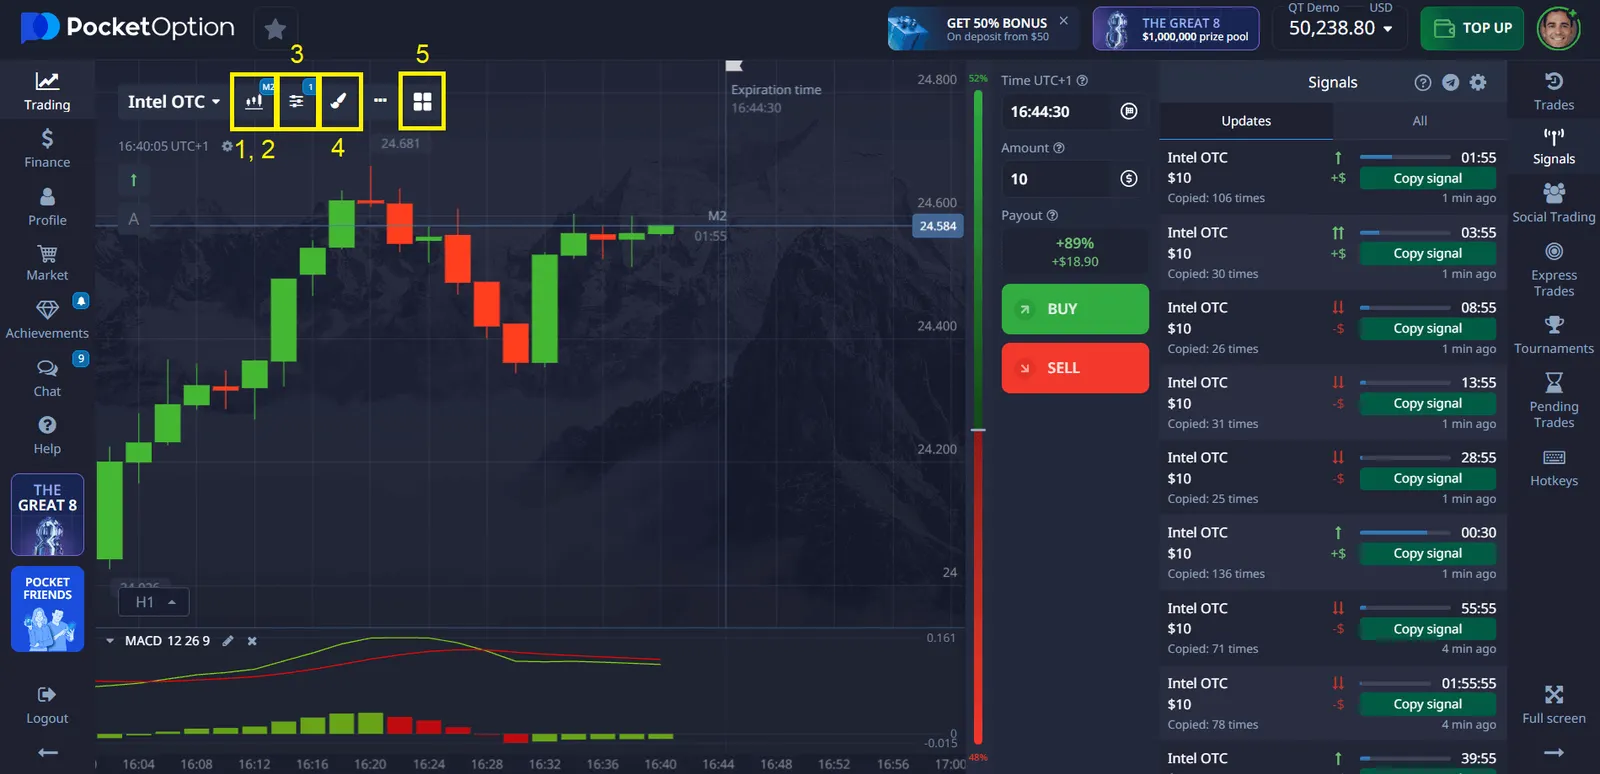
- Timeframe selector – ranges from 5 seconds to 1 month
- Chart type toggle – switches between visualization styles
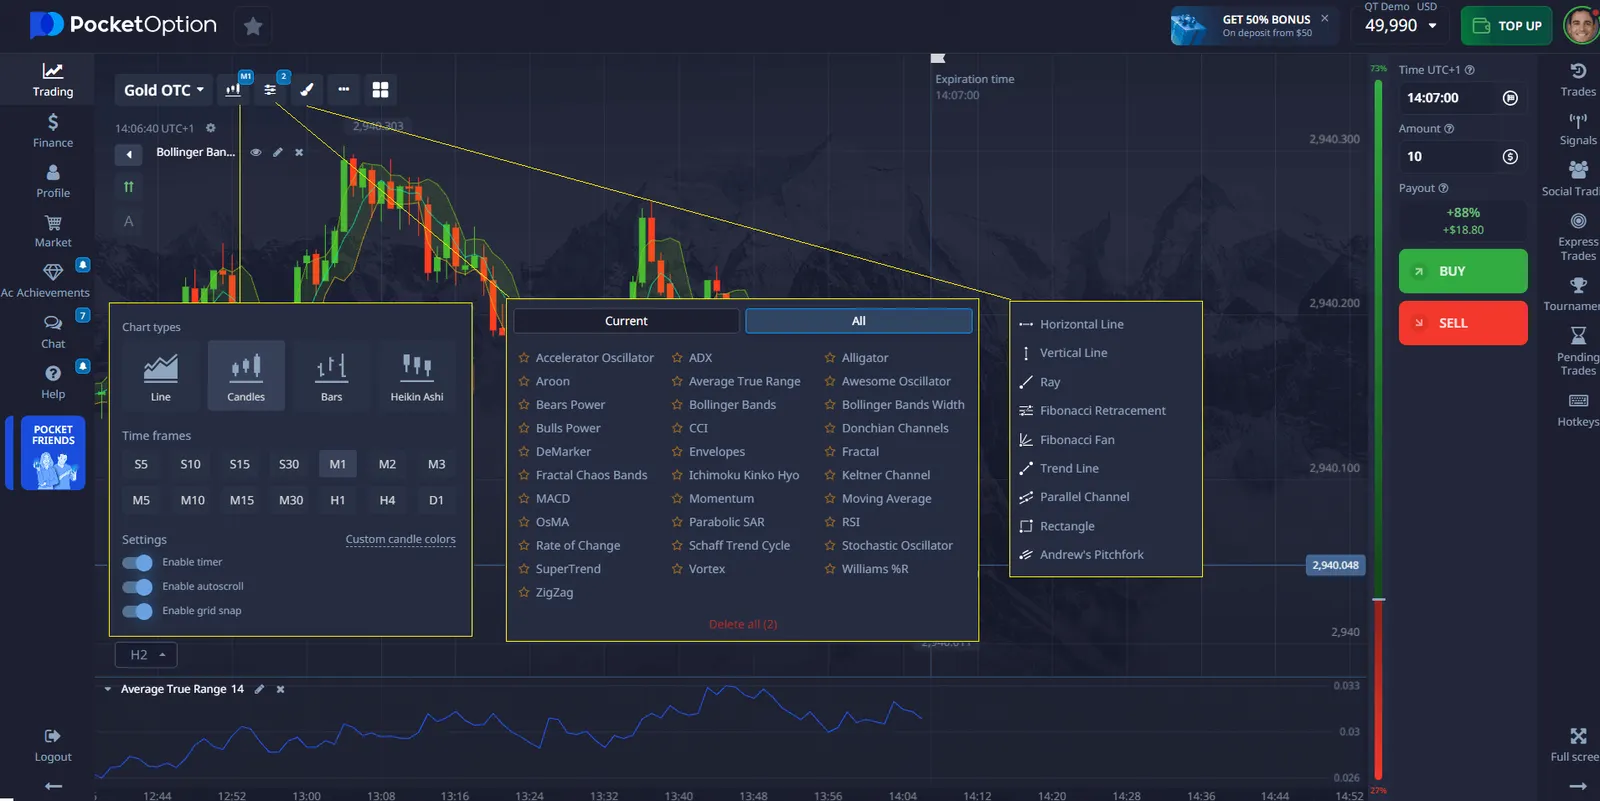
- Indicator menu – contains 30+ technical indicators
- Drawing tools – includes trendlines, Fibonacci, and rectangles
- Multi chart – displays multiple charts simultaneously
To trade multiple currency pairs at once, either select a multi-chart layout (2-4 charts) using the button next to the platform logo, or open several browser tabs for expanded viewing options.
Line Chart: Real-Time Simplicity
The Line chart on Pocket Option is a tick-based chart that tracks real-time price movements. It emphasizes small, rapid changes—ticks—and when zoomed in, you can observe multiple ticks per second. Traders can also activate the “area” feature in chart settings, which fills the space beneath the line for better visualization.
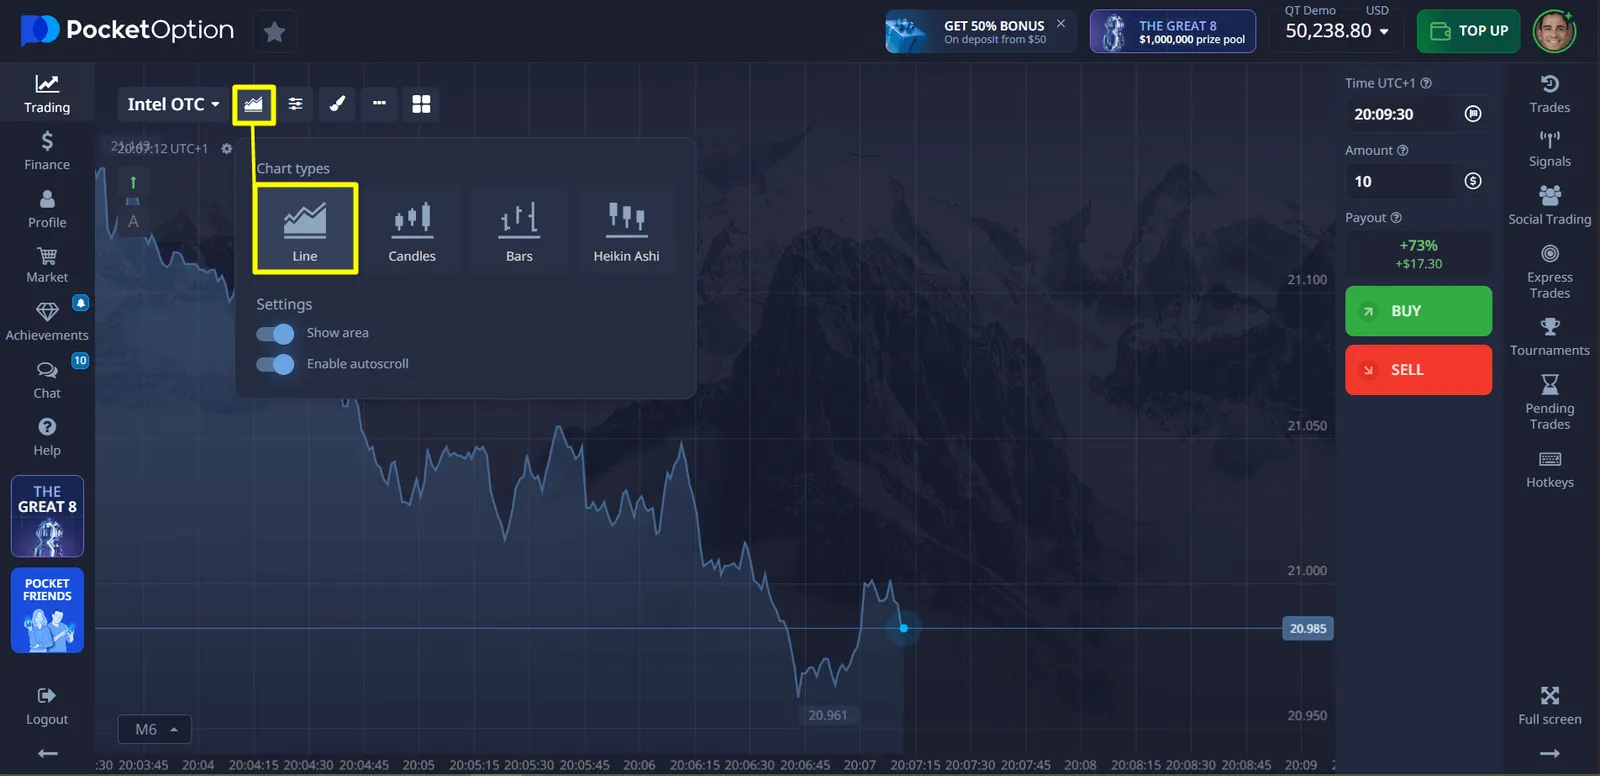
This chart is best suited for monitoring short-term price changes and conducting quick market assessments. It offers a clean, minimalist layout that excludes detailed elements like open or close prices. The Line chart is especially valuable for traders focused on price momentum and seeking a fast, simplified view of market direction.
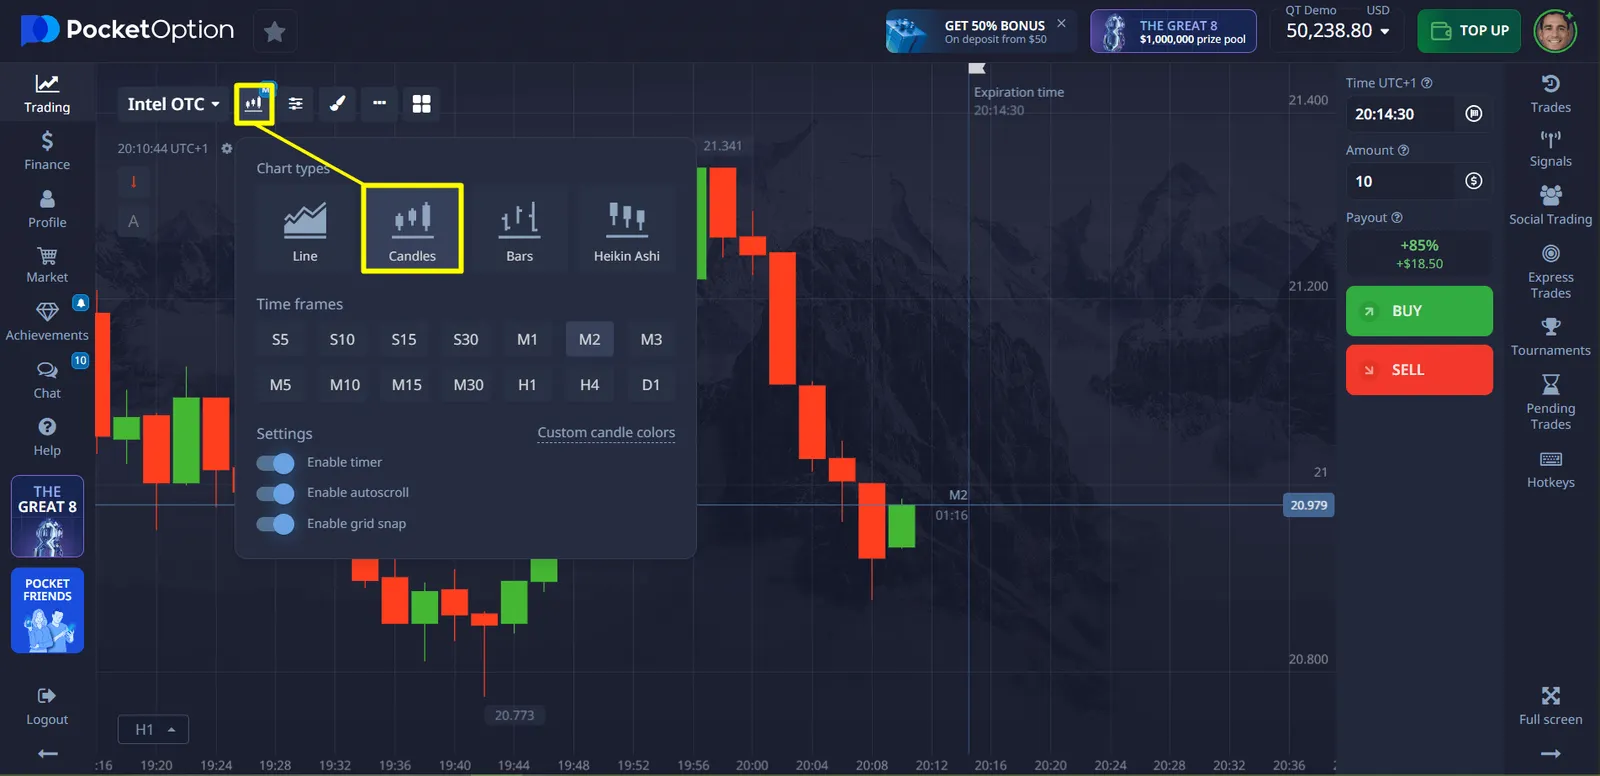
Candles Chart: In-Depth Market Analysis
The Candles chart is one of the most detailed and widely used chart types on Pocket Option. Each candlestick represents a selected time interval and includes four essential data points:
- Open price – where the price started in the interval
- Close price – where the price ended in the interval
- High – the highest price reached
- Low – the lowest price recorded
The candle’s body is color-coded to indicate whether the price went up (bullish) or down (bearish), while wicks show the full price range during the period.
This chart is ideal for:
- Technical analysis and identifying market patterns
- Spotting trends and key levels of support/resistance
- Understanding market sentiment through candle size and color
The Candles chart is perfect for traders who rely on precise historical data and need a full view of market behavior for informed decisions.
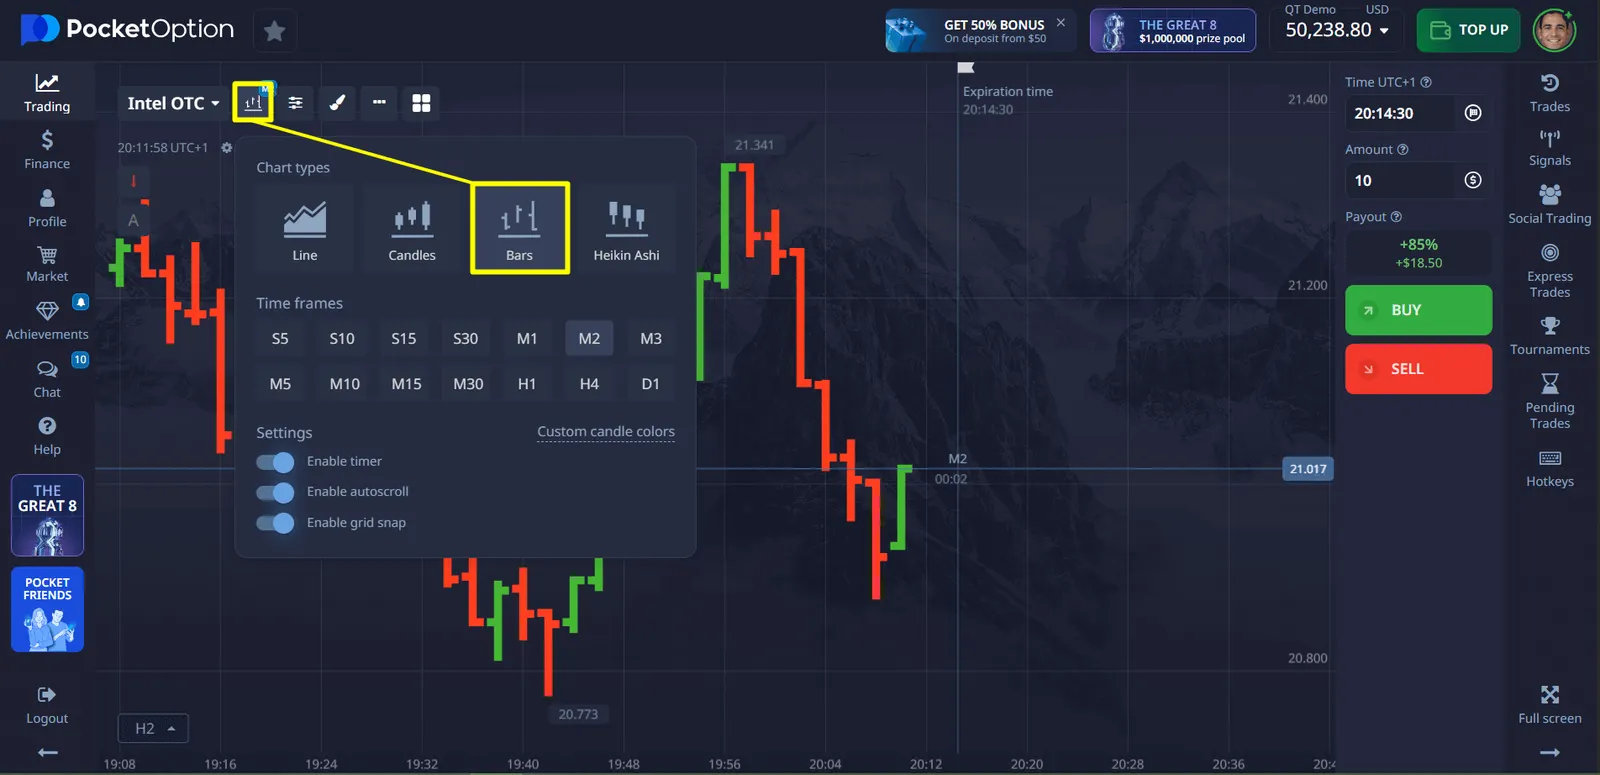
Bars Chart: Detailed but Minimalist
The Bars chart on Pocket Option delivers comprehensive pricing information for each selected time interval in a clean, non-candlestick format. Each bar includes:
- Opening price (left horizontal tick)
- Closing price (right horizontal tick)
- High (top of the vertical bar)
- Low (bottom of the vertical bar)
This chart is best used for:
- Analyzing price volatility via bar length
- Spotting trends by observing bar sequences
- Technical breakdowns with clear high-low-open-close visibility
Compared to candlesticks, the Bars chart offers less visual clutter, making it a favorite for traders who focus strictly on price action and structure rather than aesthetics.
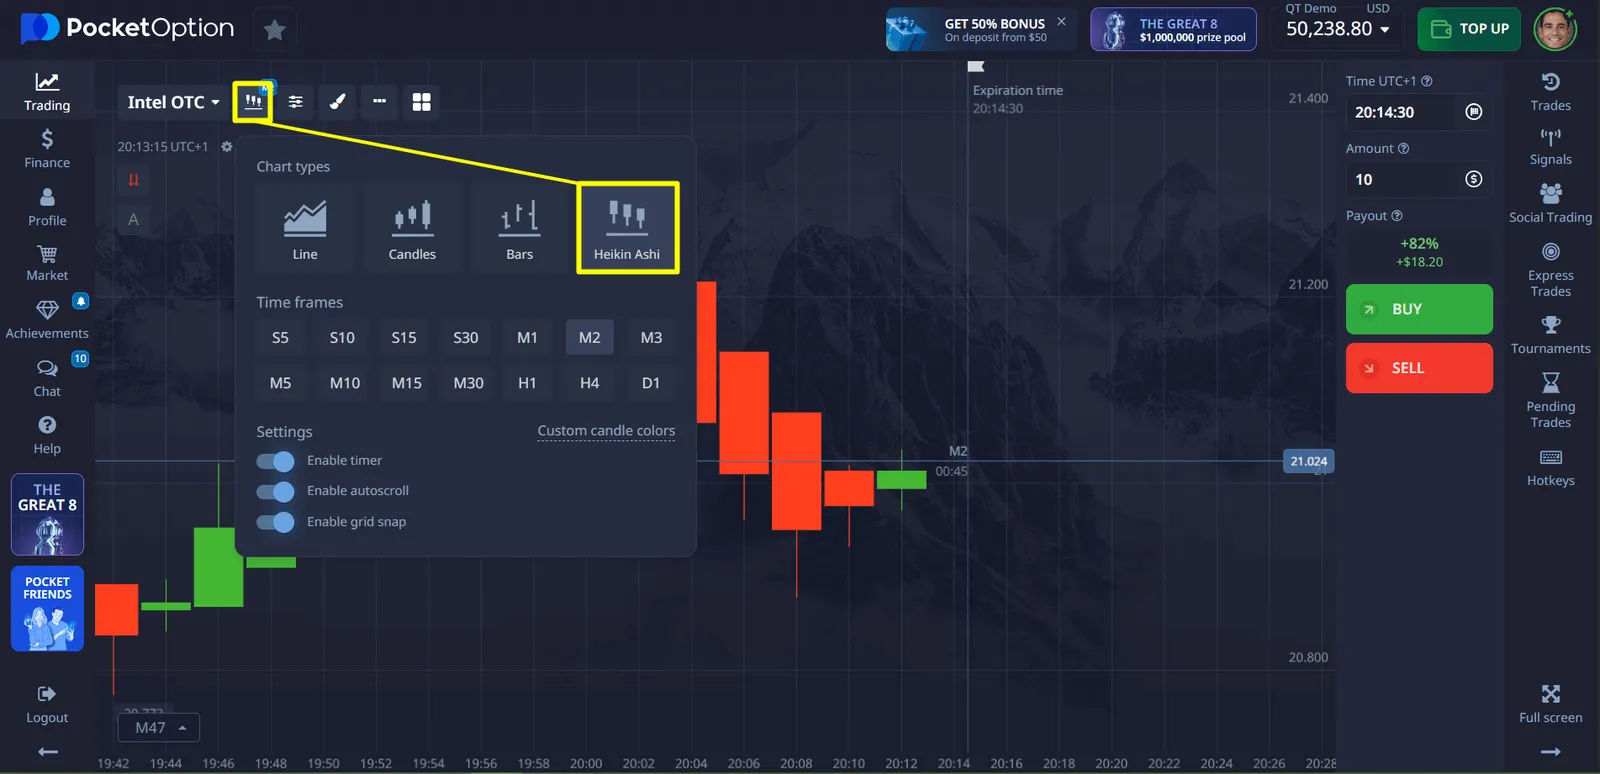
Heikin Ashi Chart: Trend Clarity Through Smoothing
The Heikin Ashi chart is a specialized type that uses modified formulas to smooth price data and highlight trends. Unlike traditional candlesticks, it calculates new values for each candle based on averages, which reduces market noise.
Key characteristics:
- Smoothed candles that minimize random fluctuations
- Clearer trend direction thanks to visual consistency
- Enhanced reversal signals with less false noise
- Cleaner, broader market view for strategic planning
Best for:
- Trend-following strategies
- Swing trading to identify optimal entry/exit points
- Long-term analysis across larger timeframes
The Heikin Ashi chart is ideal for traders who want to cut through volatility and focus on broader market direction, helping avoid misleading signals and enhancing clarity.
Practice and Learn with Educational Tools on Pocket Option
On Pocket Option, the Education section offers detailed strategies tailored to different chart types—such as the Candles chart.
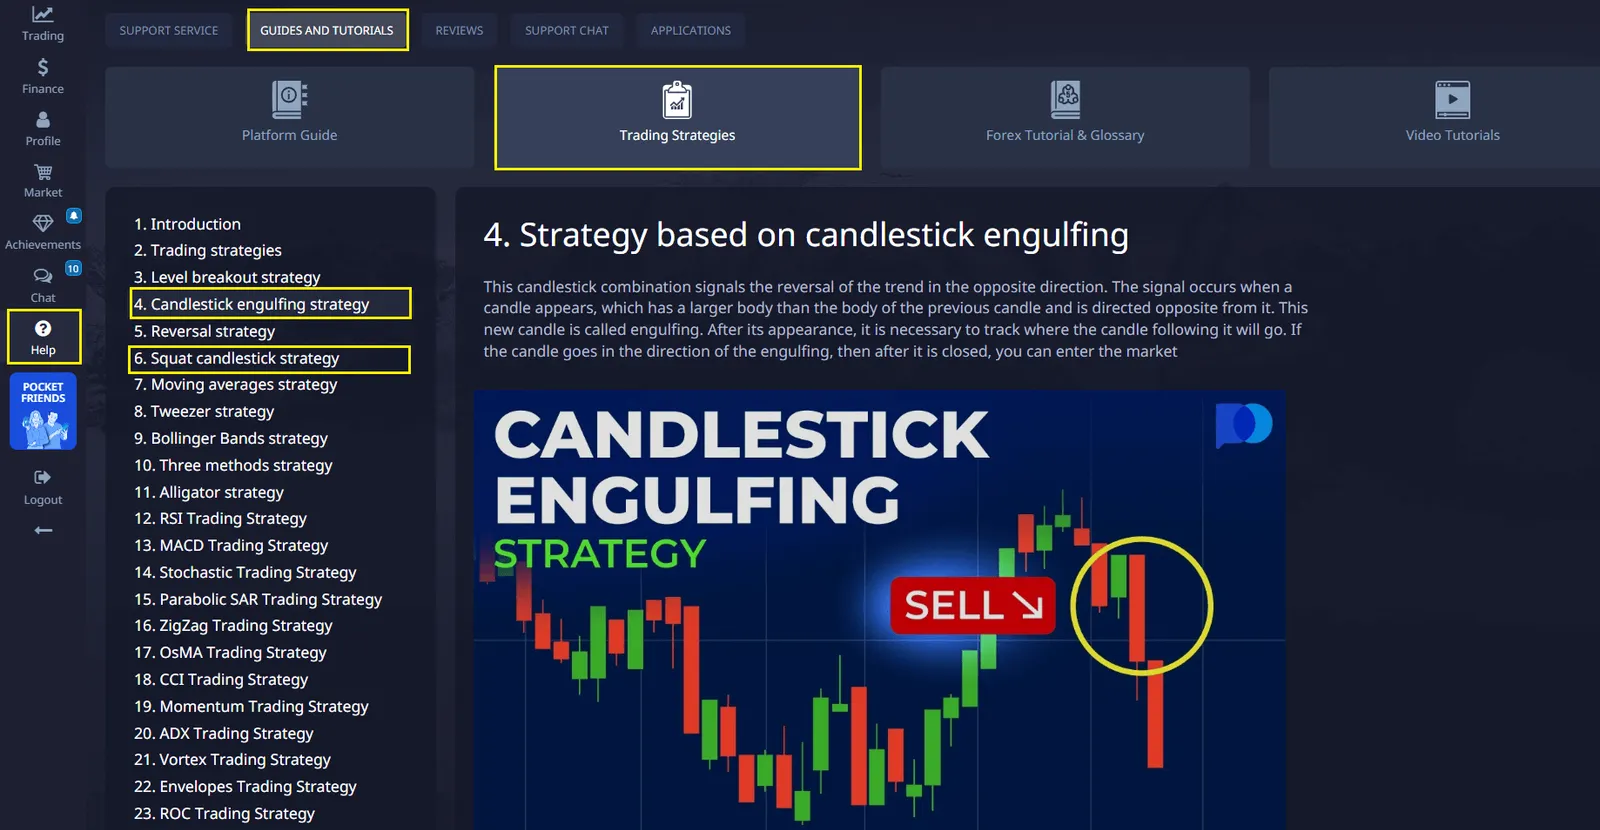
These resources explain how to interpret chart data and build effective trading strategies based on visual patterns and price behavior. Additionally, Pocket Option provides a free demo account with $50,000, allowing users to practice trading in a risk-free environment and gain confidence before switching to real funds.
Customizing Your Pocket Option Charts
Knowing how to read Pocket Option charts effectively also involves personalizing your visual setup. The platform allows extensive customization:
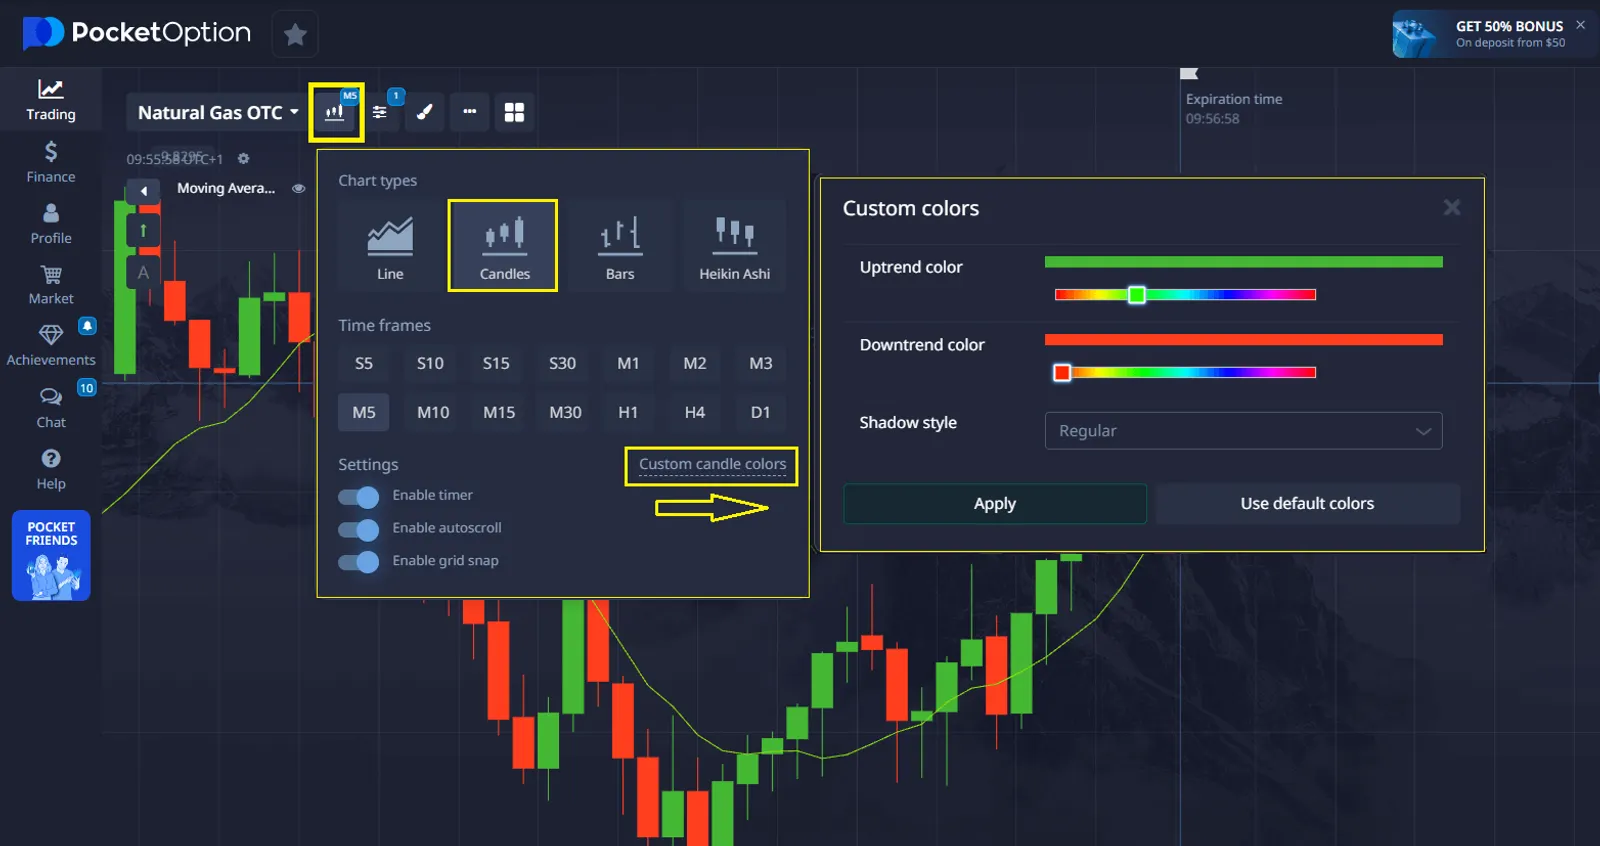
- Change chart colors (light/dark themes available)
- Adjust candle size and spacing
- Save multiple chart templates for different strategies
- Create custom indicator settings profiles
- Set price alerts at key levels