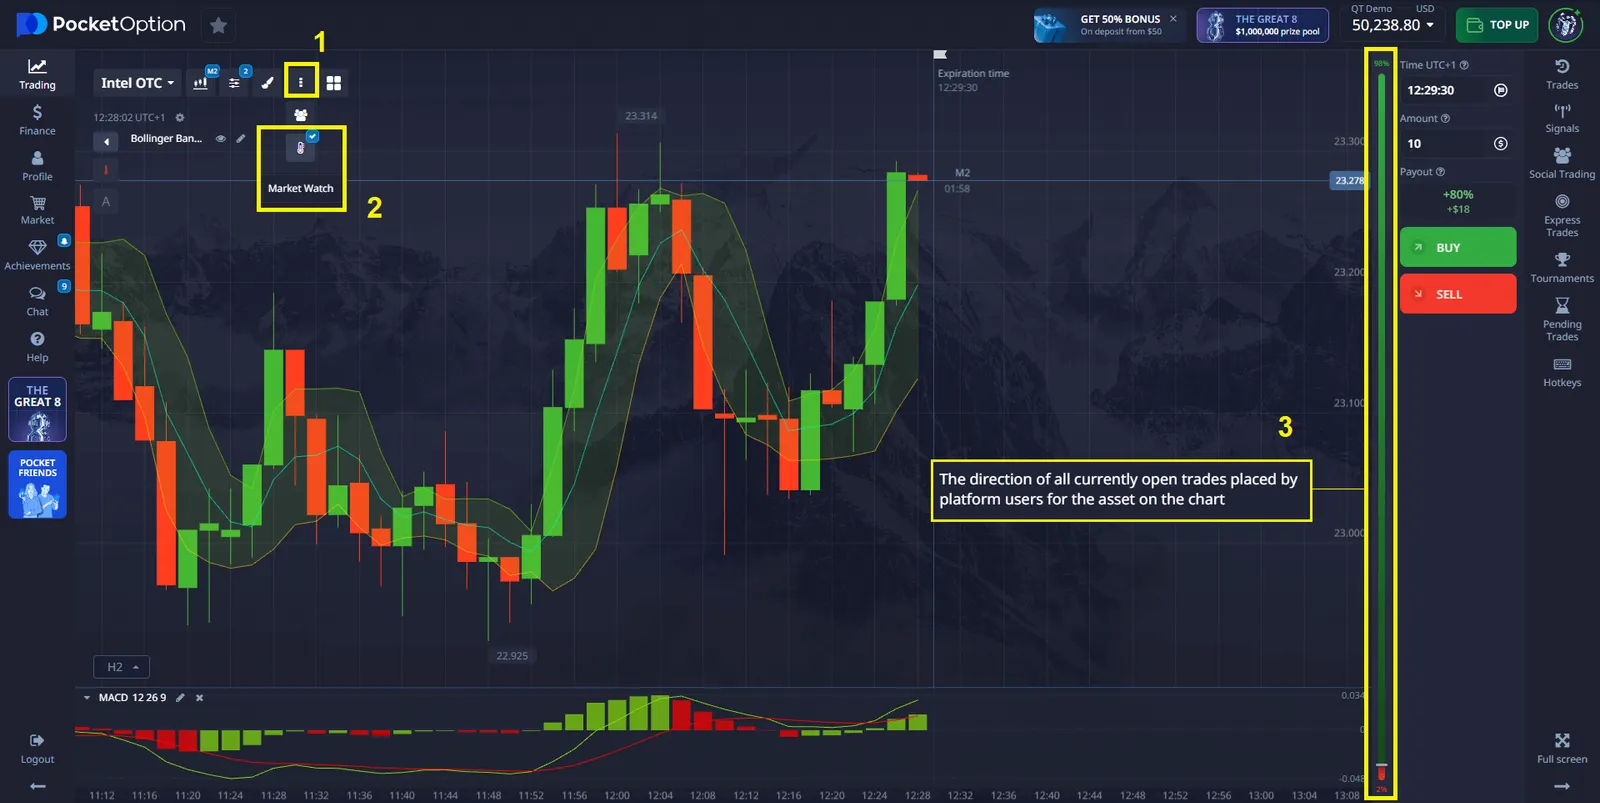
- Go to the “Market Watch” section.
- Activate it to get real-time data on asset prices, trends, and trading volumes.
- Select the assets you want to track and use the information to make buy or sell decisions.
Pocket Option Buy Sell Indicator Mastery
The Pocket Option platform offers traders a variety of tools to make informed decisions about buying and selling assets. Instead of simply buying or selling, users forecast whether the asset's price will rise or fall. If the forecast is correct, they can earn up to 92% profit. In this article, we will review the main tools on the Pocket Option platform that can help improve your trading.
1. Market Watch
Many traders just need to look at the market watch indicator to decide whether to buy or sell an asset. The Market Watch feature on Pocket Option allows traders to monitor current market trends in real time. You can watch asset prices, trading volumes, and market movements to stay updated on the latest market conditions.
To activate this feature:
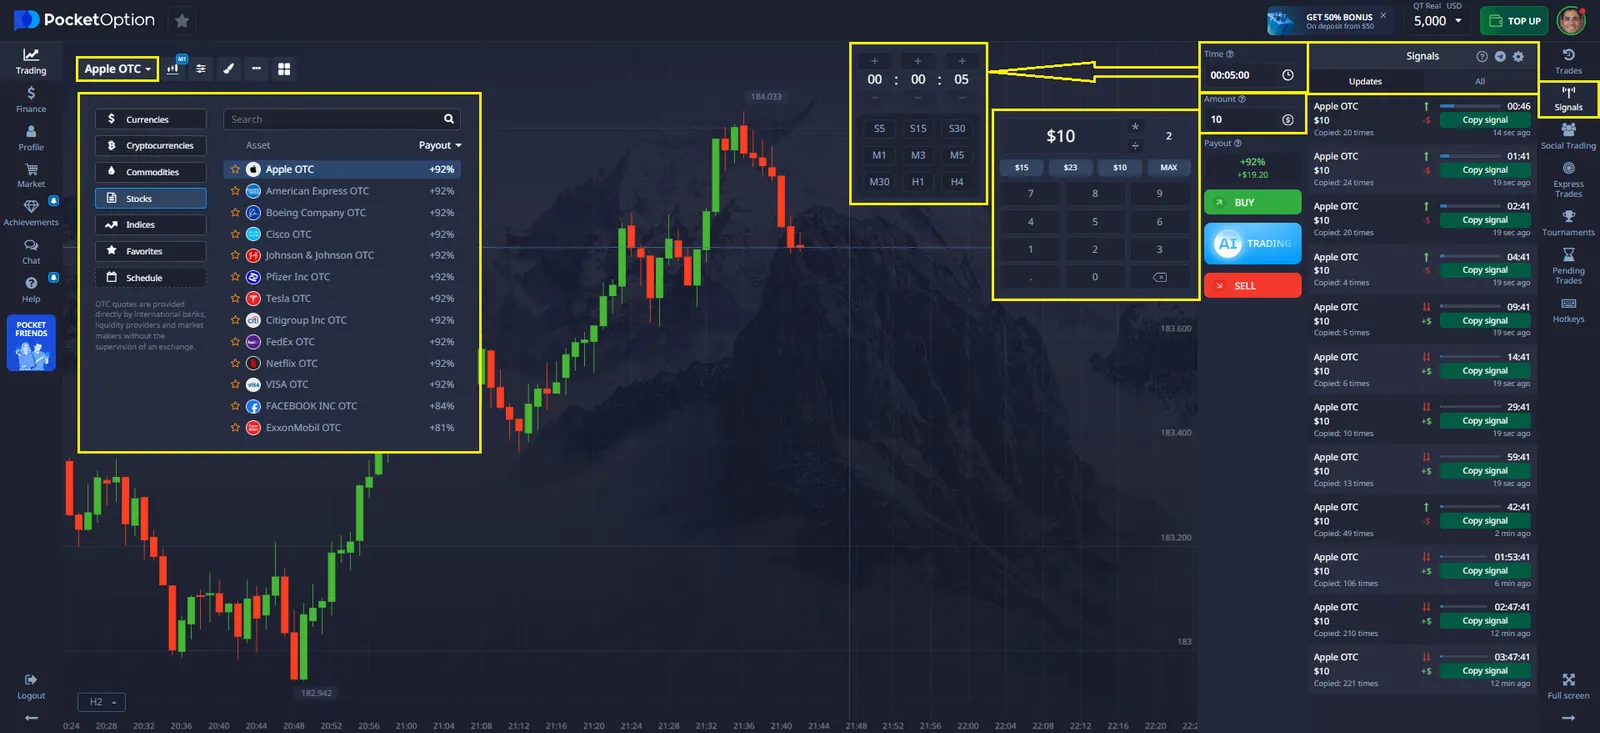
2. Pocket Option Signals
Signals are automatic recommendations that show possible market directions. When a signal appears on the chart, it may suggest whether to buy or sell an asset based on the direction of the arrow.
How to Use Signals on Pocket Option?
- Enable Signals: Go to the “Signals” section on the Pocket Option platform and activate them. This will allow arrows to appear on your chart.
- Watch the Arrows: An upward arrow signals a potential buy, while a downward arrow signals a potential sell.
- Evaluate the Signal and Make a Trade: Once the signal is activated, you can place a trade by selecting “Buy” or “Sell” depending on the direction of the arrow.
Pocket Option buy sell indicator signals are a helpful tool for identifying potential entry and exit points, but they work most effectively when combined with other indicators and your own market analysis.
3. Indicators on Pocket Option
Indicators are analytical tools that help traders assess market trends, price momentum, and potential reversals. They are divided into two types: trend-following indicators and momentum and reversal indicators.
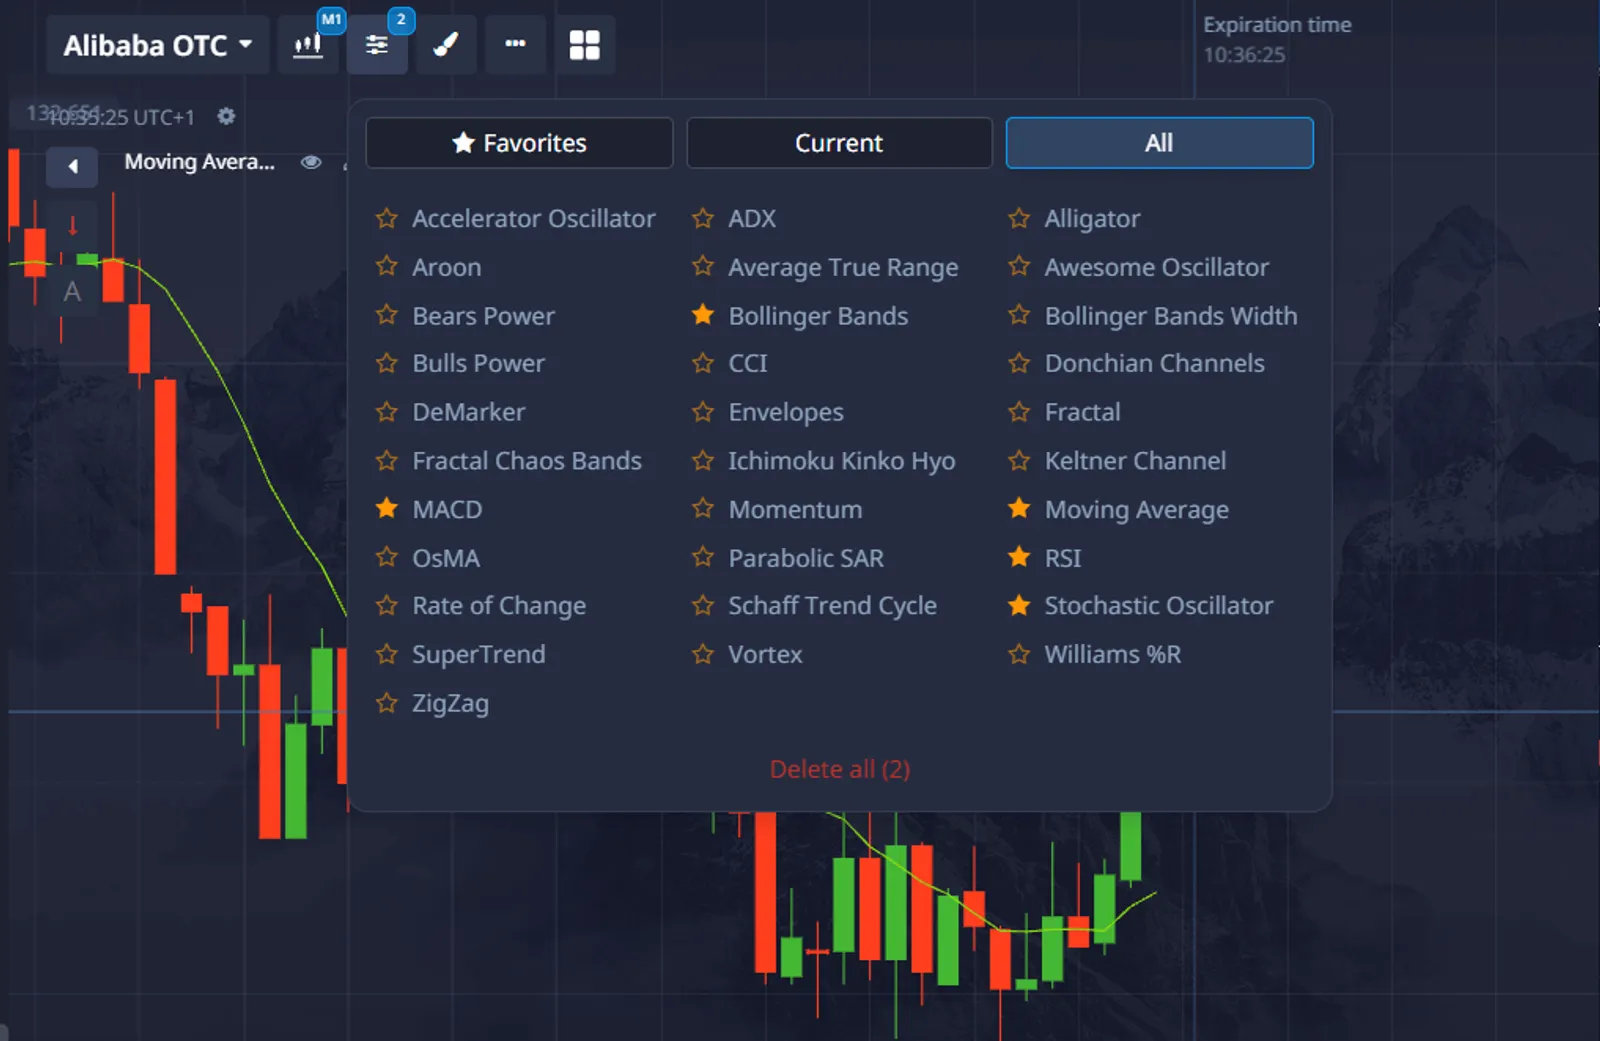
Trend-Following Indicators
These indicators are perfect for determining the market direction, which helps you stay on the right side of the trend.
- MACD (Moving Average Convergence Divergence) — helps determine momentum and trend direction using line crossovers.
- SuperTrend — draws a colored line that changes from red to green when the trend shifts, providing clear signals for market entry.
- Parabolic SAR — places dots that change position when the trend changes, making it ideal for determining exit points.
Table 1: Trend-Following Indicators
| Indicator | Settings | Ideal Assets | Expiry Times |
|---|---|---|---|
| MACD | Fast: 12, Slow: 26, Signal: 9 | Major currency pairs, Commodities | 15-30 minutes |
| SuperTrend | Period: 10, Multiplier: 3 | Cryptocurrency, Indices | 5-15 minutes |
| Parabolic SAR | Step: 0.02, Max: 0.2 | Major currency pairs | 5-15 minutes |
Momentum and Reversal Indicators
These indicators help determine moments when price direction might change, as well as identify overbought or oversold conditions in the market.
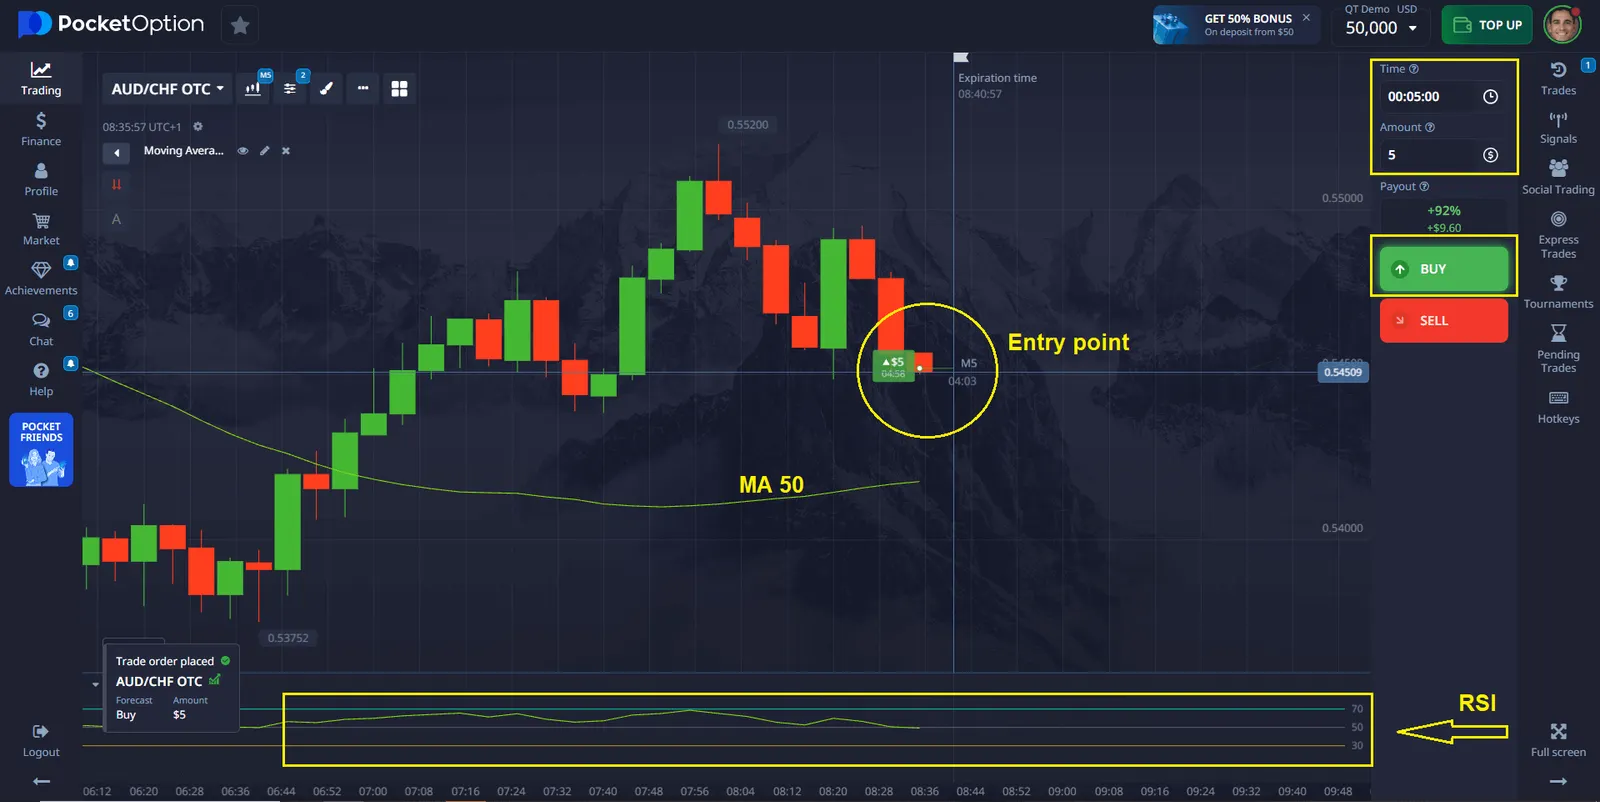
- RSI (Relative Strength Index) — measures price dynamics on a scale from 0 to 100, where values below 30 may signal a buy and values above 70 may signal a sell.
- Stochastic Oscillator — compares the current closing price with the price range over a set period. It generates signals when the lines cross key levels like 20 (oversold) or 80 (overbought).
- Bollinger Bands — create dynamic support and resistance levels based on market volatility, helping to identify moments to buy or sell.
Table 2: Momentum and Reversal Indicators
| Indicator | Accurate Buy Signal | Accurate Sell Signal | Success Rate |
|---|---|---|---|
| RSI | Crosses above 30 after bullish divergence | Crosses below 70 after bearish divergence | 65-75% across markets |
| Stochastic | Line K crosses above Line D below level 20 | Line K crosses below Line D above level 80 | 60-70% across markets |
| Bollinger Bands | Price touches lower band, then moves inward with increased volume | Price touches upper band, then moves inward with increased volume | 55-65% on all markets |
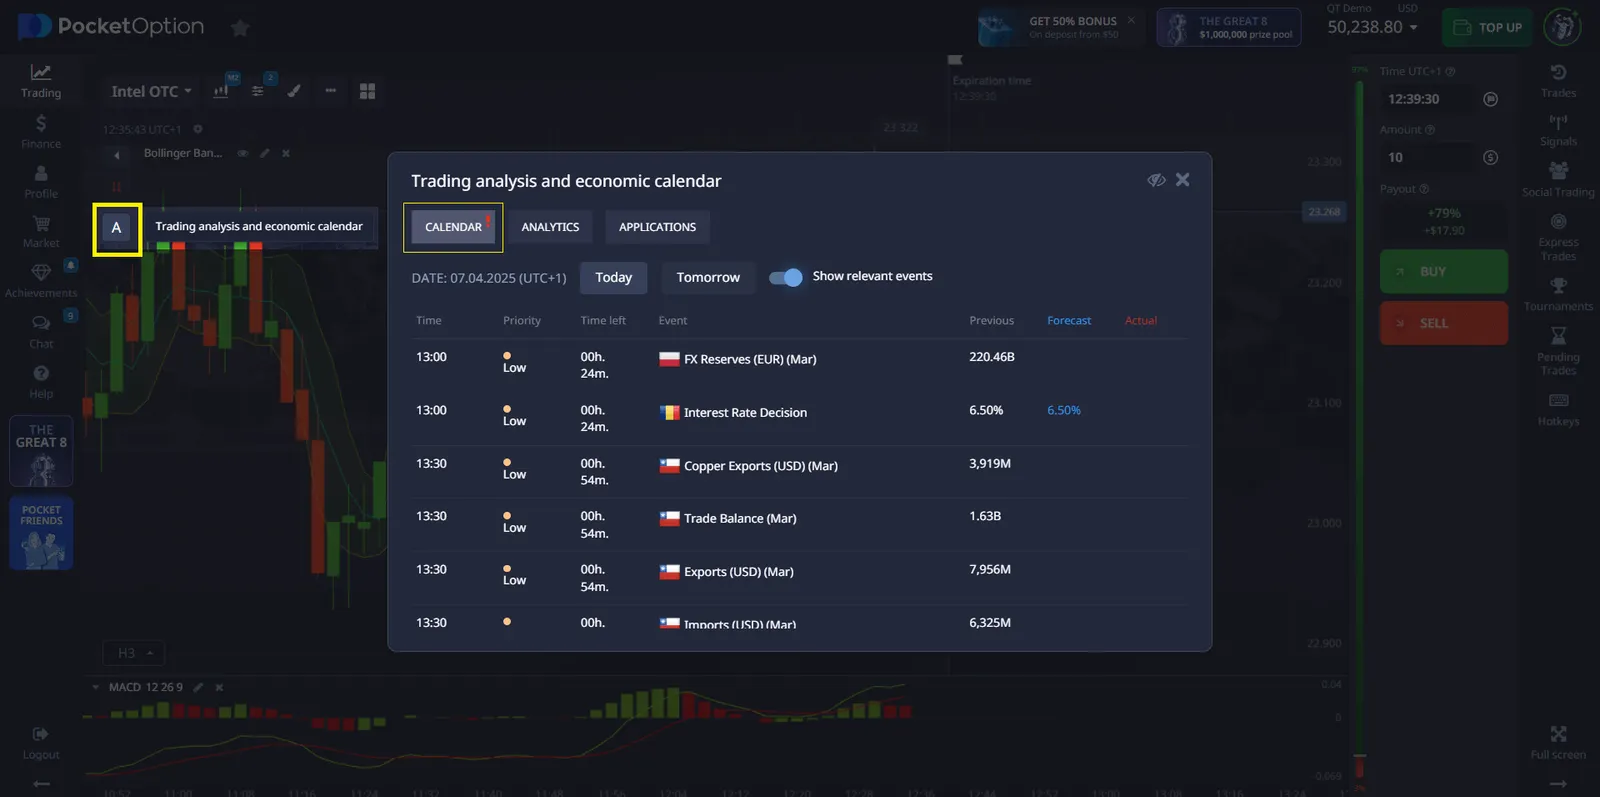
2. Economic Calendar
The economic calendar is an important tool for traders that allows them to track upcoming economic events, news, and reports that may impact the market. Knowing these events helps predict possible price movements and improves trading strategy.
To use the economic calendar on Pocket Option:
- Open the trading platform.
- Go to the “Analytics” section, where you can find up-to-date information on upcoming events.
- Use this data to analyze the impact of news on the market and make more informed trading decisions.
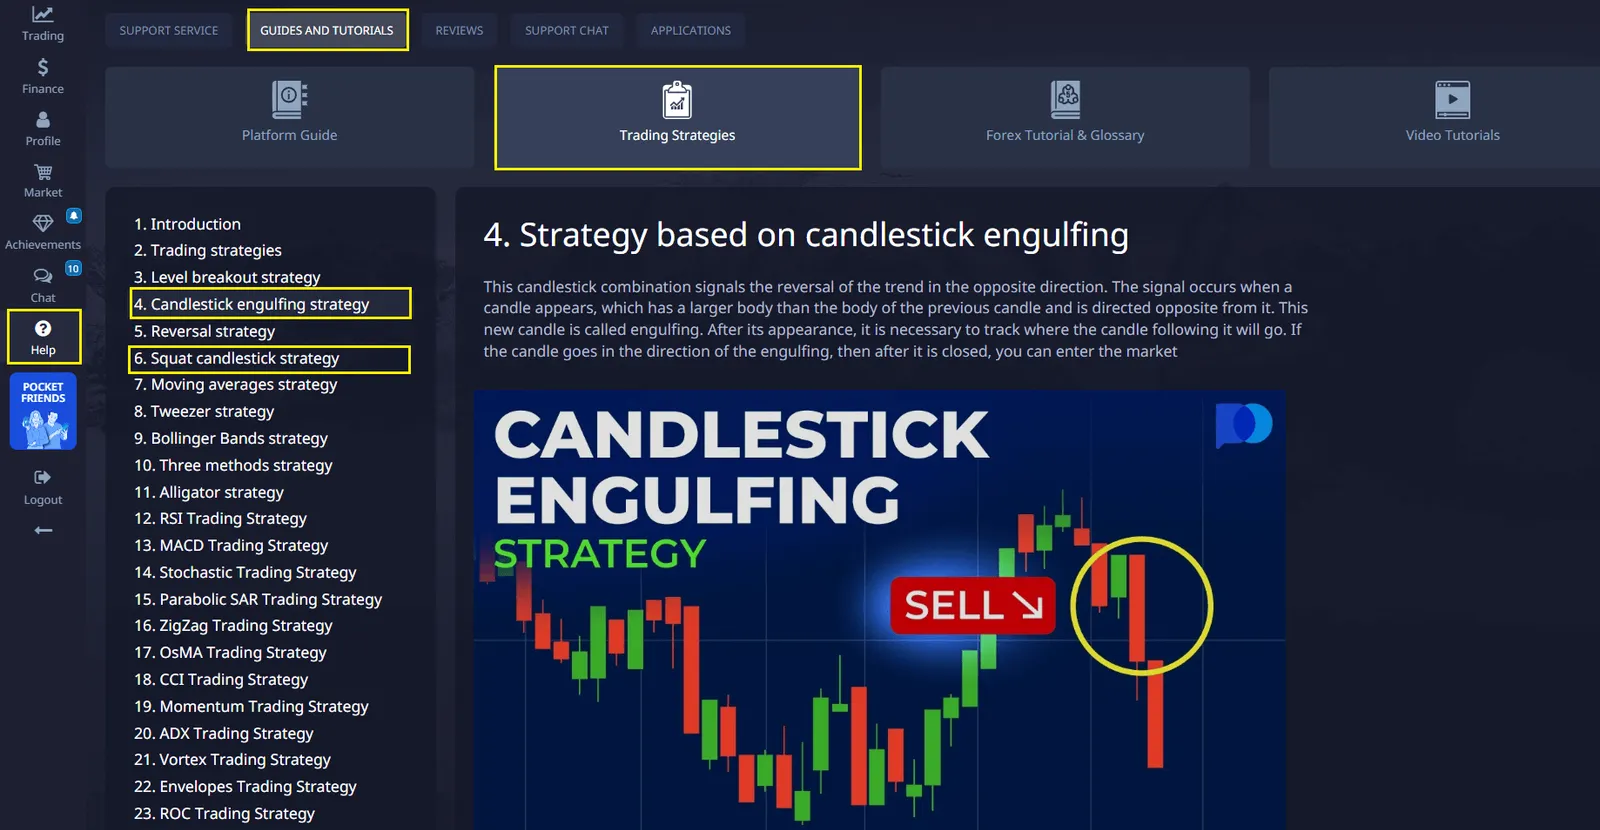
3. Candlestick Patterns
Candlestick patterns are combinations of candles that can indicate trend changes or reversals in the market. They can be a great addition to your analysis and help predict when to buy or sell.
On Pocket Option, you can track patterns on asset charts and analyze them to determine points of entry or exit. Patterns such as “Doji,” “Lightning,” or “Bullish and Bearish Engulfing” can help you identify when the price might reverse.
Conclusion
Pocket Option provides traders with many tools, including indicators and signals, as well as features such as the economic calendar, candlestick patterns, and market watch, to help make more accurate buy or sell decisions. Using these tools will improve your trading strategy and increase the accuracy of your trading decisions. Begin your journey with demo account to test these concepts without financial risk, then transition to live trading with minimal position sizes as your confidence and consistency grow.
FAQ
What exactly is a buy sell indicator on Pocket Option?
A buy sell indicator on Pocket Option is a technical analysis tool that generates specific signals telling traders when to potentially enter a buy or sell position. These indicators use mathematical algorithms to analyze price data and market conditions, producing visual signals (often arrows, dots, or color changes) directly on price charts to indicate favorable entry points for trades.
Can beginners use advanced buy sell indicators effectively?
Yes, beginners can use advanced indicators, but should start with simpler ones first. New traders should focus on understanding one or two fundamental indicators thoroughly before adding complexity. Starting with trend-following indicators like Moving Averages or MACD is recommended, then gradually incorporating oscillators like RSI. Practice with demo accounts before trading real money to understand how indicators behave in different market conditions.
Should I use multiple buy sell indicators simultaneously?
Using 2-3 complementary indicators is often more effective than relying on just one or overloading your charts with many indicators. The key is selecting indicators that provide different types of information - for example, pairing a trend indicator (like Moving Averages) with a momentum oscillator (like RSI) and a volatility measure (like Bollinger Bands). Too many indicators can lead to confusion and contradictory signals.
How should I adjust indicator settings for different timeframes?
Shorter timeframes (1-5 minutes) generally require more responsive indicator settings with shorter periods (e.g., 9-14 for RSI instead of the standard 14-21). Longer timeframes benefit from extended periods to filter out market noise. Always backtest your settings on the specific timeframe you plan to trade. Many traders use slightly more conservative thresholds for very short timeframes to reduce false signals caused by market volatility.
How do I analyze candlestick patterns?
Candlestick patterns help identify possible trend reversals or continuations in the market. Traders use them to make decisions about entering or exiting a position.
GLOBAL MARKETS RADAR
Sign up for more like this
Customize your newsfeed with content you're actually interested in — get up-to-date personalized newsletter in your inbox.
Your comment
Comments are pre-moderated to ensure they comply with our blog guidelines.