
Pocket Option 1 Minute Strategy: Quantitative Analysis for Rapid Trading
Just 2 charts and 3 indicators are enough for a popular 60-second setup. This guide gives you a framework for fast entries. Rules to follow, exit discipline, session limits, and how to properly test it for free.

Why 1-Minute Trading Is Different
People like Warren Buffett and Charlie Munger famously did one or two trades a year. Some people do a few traders per week. But for some, that is just too boring and too slow to compound. Why wait for a setup on a weekly chart, when you can trade every minute? A 60- second chart compresses a decision into a small window, and significantly changes not just the pace, but the math:
Fast noise dominates. A large share of the price movement inside any single 60-second candle can be attributed to the bid-ask bounce and small order imbalances. This is fundamentally different from a daily or even an hourly chart, that responds to news and changing fundamentals. From this point of view, 1 minute binary options strategy is much more heavily dominated by TA.
More trades means more decisions, faster. As you can place many times more trades per session, the wins are quicker to compound, and the losses are quicker to register and to let you grow. If you can understand why a setup didn’t work, you can fix it the exact next minute, no need to wait for days.
Indicators lag differently. The same RSI, BB, or moving averages react much faster on a 1-minute chart. There are also more quick reversals that trigger and immediately invalidate a signal, making it behave quite differently.
None of this means that ultra short term trading doesn’t work. It only means that the rules need to be tighter than on a slower timeframe. There’s much less time to think between a signal and a trade, and you need to be able to differentiate all the fast market noise. There are 1-minute binary options strategies that do work, but they often require more precision and practice.
on Pocket Option Trading Platform
Get StartedChoosing an Asset for 1-Minute Trading
Not every asset suits 1-minute trading equally. Some stocks and altcoins don’t exist in Pocket Option quick trading mode, others, like small-cap stocks, are too choppy and prone to reversals. Two things matter more with scalping than on longer charts:
Liquidity. Rarely traded assets that have low volume and not many traders can produce rather erratic 5-second candles. They won’t work well with basic TA, as the data is too erratic. Major FX pairs, such as EUR/USD, and large-cap cryptos (BTC, ETH) often have cleaner and simpler price action for scalping.
Session timing. The exact same assets may behave differently depending on the time window you trade them at. AUD/NZD during the end hours of the US session is famously far less appealing than at the peak of the Asian session. And the most volume famously happens on Gold and EUR/USD during the London/NY session overlap. That is why that timing has less random noise compared to the quieter times.
Entry Rules
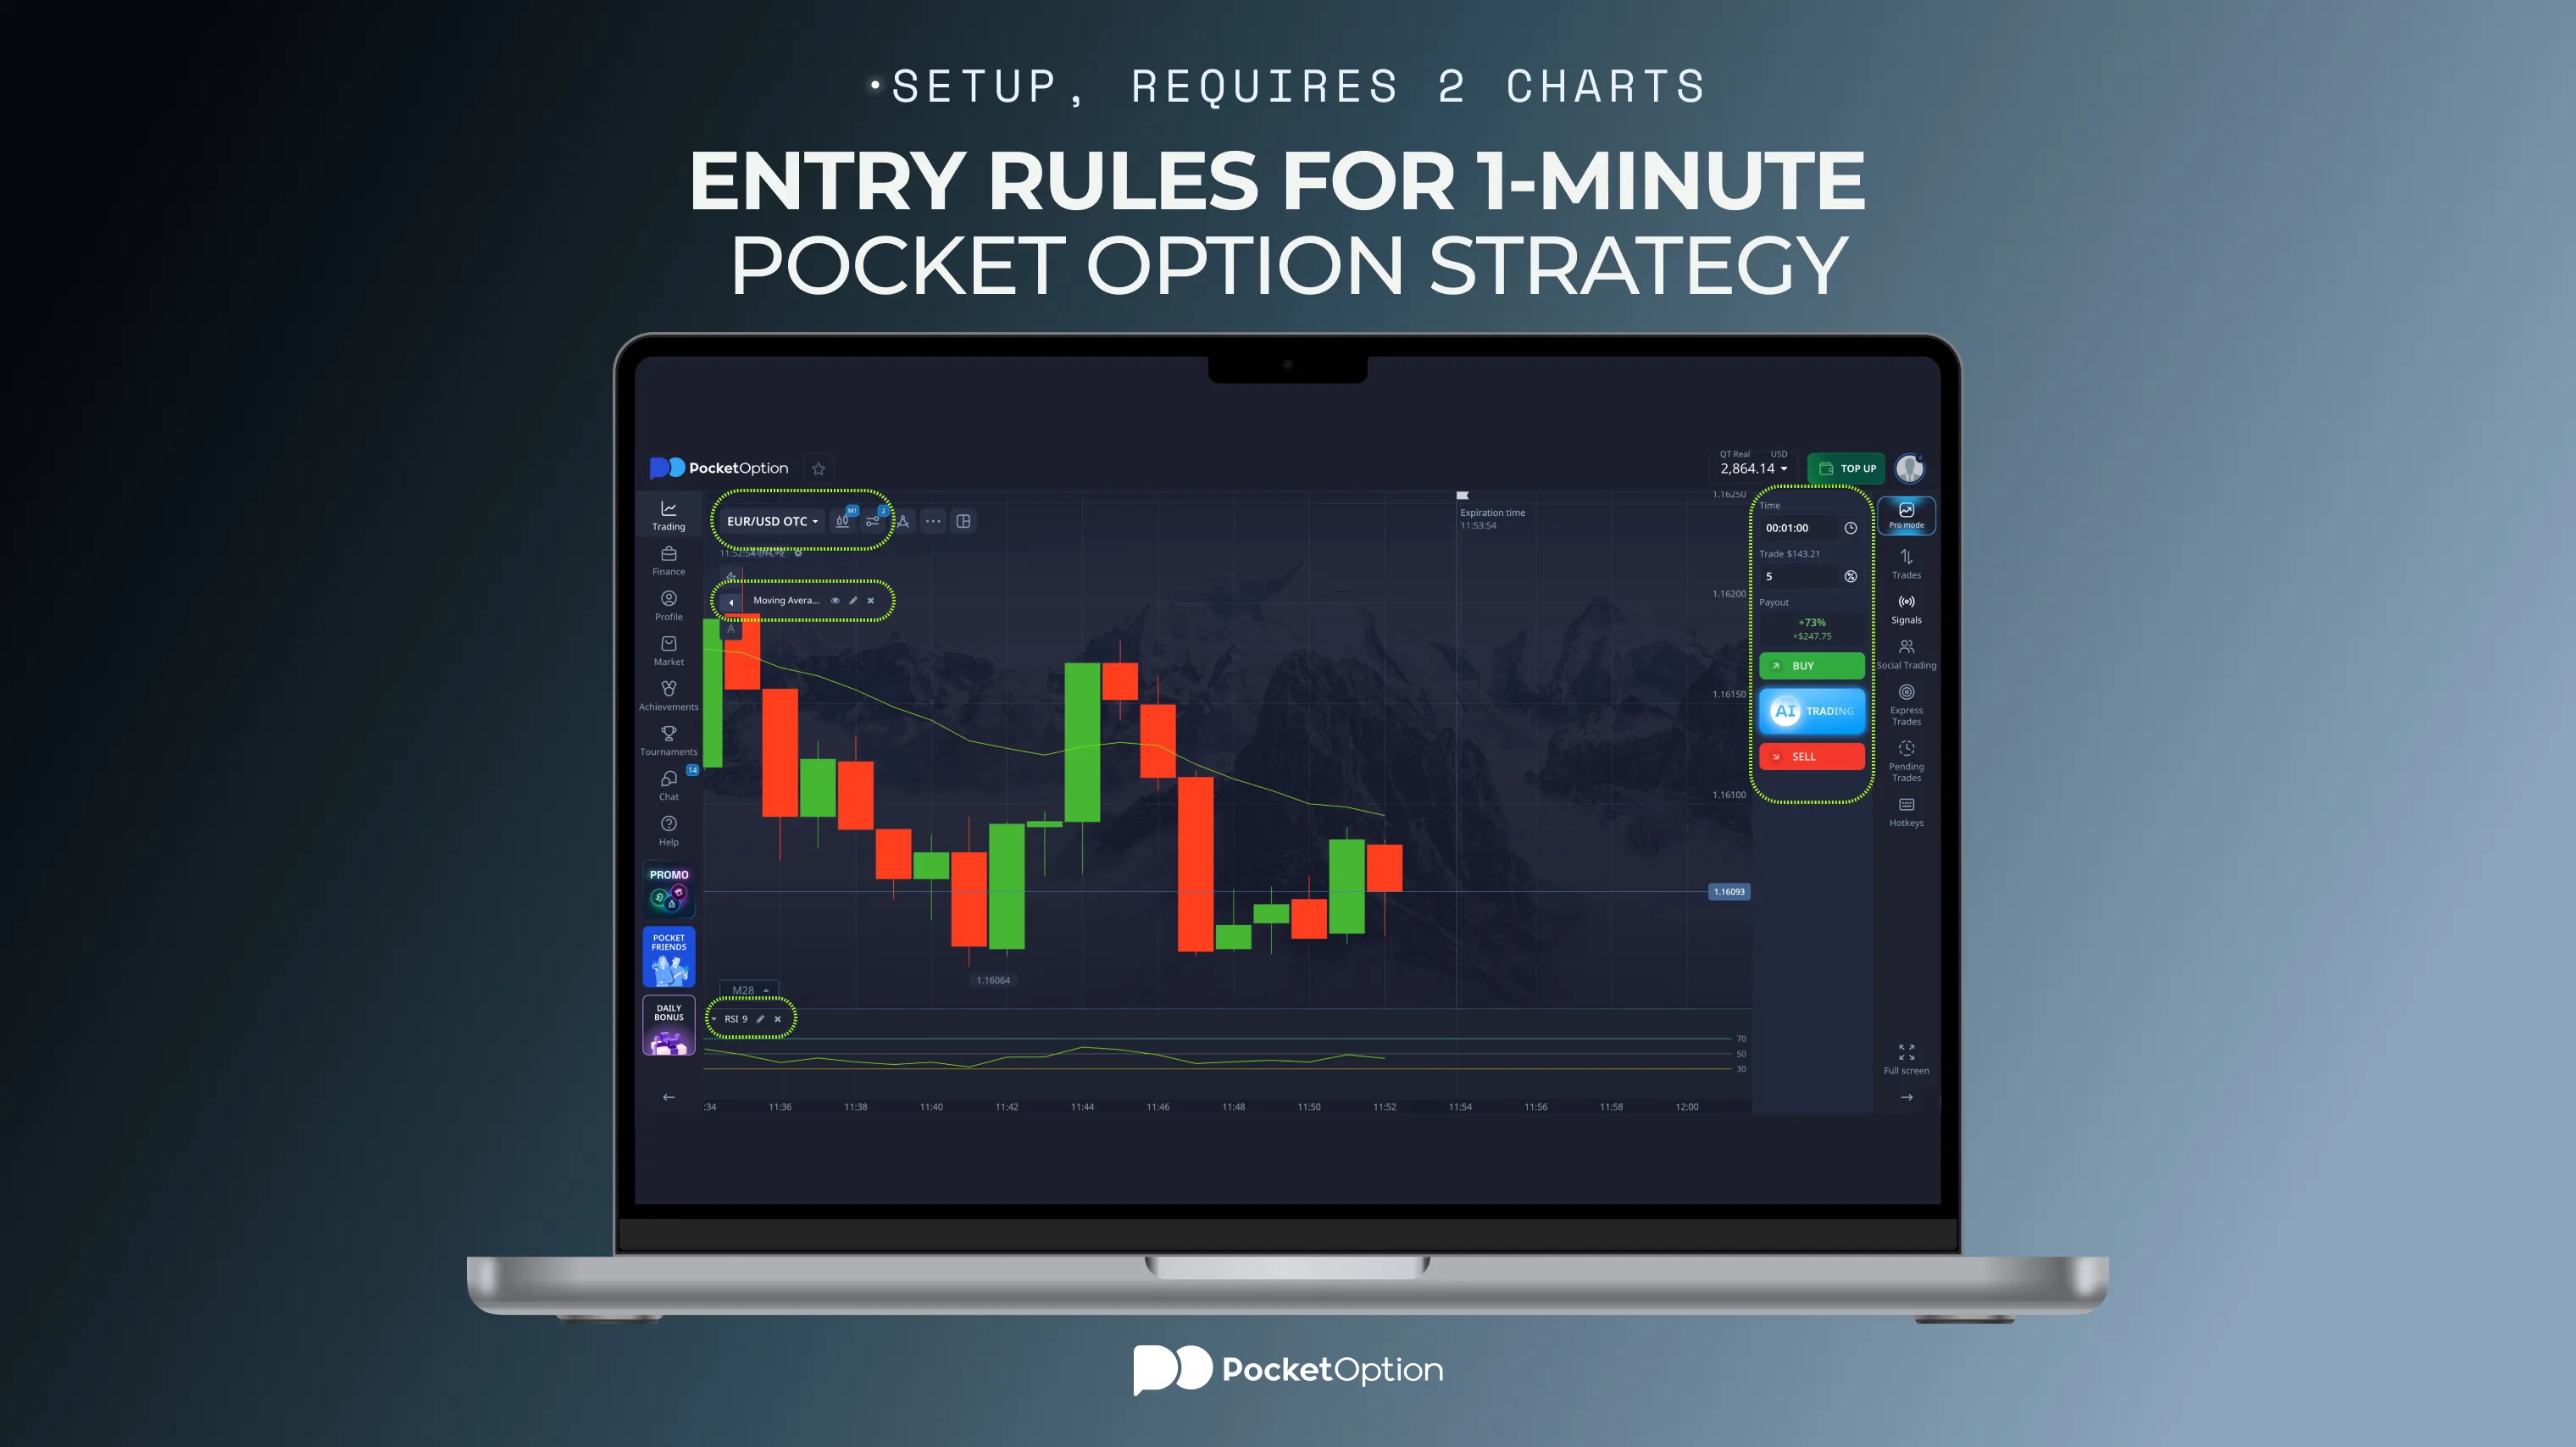
There are plenty of Pocket Option strategies that work in the 1-minute window, discussed in chats and in blogs. Here's just one example for the Quick Trading mode, which can be a concrete starting point.
Setup, requires 2 charts:
Chart 1: 1-minute candles, for entries.
Chart 2: 5-minute candles, opened at the same time, as a filter for trends, to always trade in the direction of a larger move.
Indicators: 21-period EMA (to identify trend direction), 9-period RSI (instead of standard 14, for even faster reactions), Volume indicator.
Entry rule for longs:
You notice that price is trading above the 21 EMA on both 1-minute and 5-minute charts.
RSI (9) crosses back above 30 after spending some time dipping below that level. This indicates a proper momentum shift, not just "oversold conditions". The move has legs to run.
The volume is above recent average, or volume MA is picking up. This filters out random noise that can produce false signals in such a quick trading mode.
Entry rule for shorts: the polar opposite of everything described above. Price stays below the 21 EMA on both charts, RSI (9) is crossing below 70, and you see a volume confirmation. This is a high-probability setup for a downside move.
The key is that all three conditions have to align. If even one is missing, the chances are lower, and you might just be dealing with fast market noise. In such case the rule is to skip the trade. This is where scalping discipline lies: not just in waiting for the proper setup, and not just in risk-management, but in the capacity to say ‘no’ to an almost-perfect trade. This is the beauty of a Pocket Option 1 minute strategy: there’s always another great setup just around the corner, even if perhaps it’s on a different chart.
Exit Logic and Session Limits
In Quick Trading mode your exit point is set automatically at the second you enter. You just select how many seconds or minutes later that point will be. After that, you won’t be able to manually close the trade, so there’s no forced error or an additional skill check there. However, you can still apply "exit logic". Here it mostly means entry discipline, and choosing the correct time window to execute the trade:
Don't chase a missed signal into the next candle. If your entry condition isn't quite met at that second, you should wait for the next full proper setup. Entering late on a fading signal often can lead to loss.
Don't average up your position size to "make back" for a loss. Fixed position sizing is key in the Quick Trading mode. It should be decided in advance, and changed very rarely. This is what keeps one bad trading hour from becoming a bad session, or a bad week.
Not having clear session limits are where a lot of 1-minute Pocket Option strategies go wrong. Having a specific number decided before the session (like ‘I will trade down to -$50, or up to +$100’) is often the key to a successful day. Specific numbers matter less than having a clear goal in mind, before a trading day starts. Staying in for too long, or starting to adjust mid-way through often leads to a lot of unnecessary stress and bad decision making.
Trade Walkthrough
Let’s suppose you're applying this framework at Pocket Option, scalping EUR/USD pair on the 1-minute chart.
Trade Details
Parameter | Value |
|---|---|
Asset | EUR/USD |
Trade Duration | 1 minute (60 seconds) |
Indicators Used | 21 EMA, RSI (9), Volume |
Entry Signal | Price above 21 EMA on both charts, RSI (9) crosses above 30, volume is currently at or above average |
Investment Amount | For example, $10 per trade |
Trade Outcome | Either +$19.20 per trade, or +0, depending on the outcome |
Trade Process
Enter the Quick Trading mode at Pocket Option.
Open the 1-minute and 5-minute EUR/USD charts, side by side (or one under another).
Apply the MA, RSI, and Volume indicators to both charts from the toolbar above.
Press the ‘Edit’ button near the RSI, change the period from 14 to 9.
Press the ‘Edit’ button near the MA on the main chart, change period to 21, and style from SMA to EMA.
Wait for a moment where the price is hovering above the 21 EMA on both charts.
Confirm that RSI (9) is crossing back above 30, after a dip below.
Check that Volume is at or above the recent average.
Set execution time (top left corner) to 1 minute, select the trade size, in $.
If all three conditions are met, open a BUY trade (press green button).
The trade will settle automatically. A correct forecast will pay out, depending on an asset pair, up to +92% for a trade (meaning, a $10 trade will yield $10 + $9.20 = $19.20). An incorrect trade will lose the $10. Both are normal and expected outcomes, not a sign of a failed framework. Whether the strategy works for you overall can only be determined after multiple trade sessions.
Testing and Refining on Demo Account First
There’s no need to put any money at risk. You can start exploring Pocket Option 1 minute strategy on a demo account, and transition to real funds only after you’ve had some success. There is nobody rushing you. You don’t have to judge a binary strategy from just a handful of trades. Execute it a few dozen, or even a hundreds times, and make sure it works for you, and you understand the risks involved:
Run the exact strategy you’re going to use for at least 50-100 trades on demo. Not 5 or 10, and not a ‘similar’ version. The exact strategy, no cheating. Many users believe trading on demo is not as fun, but that is the exact mindset that doesn’t lead you to profits. Testing a strategy just a few times doesn’t prove or disprove the framework.
Log every trade. Asset pair, time, which entry conditions were met, and the outcome. This lets you see what might be producing false signals, and what you can improve. Even the most advanced win/loss tally on the platform can’t tell why exactly you executed the trade. Only you know that.
Test across different conditions. Various sessions, assets, timeframes. Maybe in your case the 1 minute binary options strategy will work best on 2 minutes, and in the CFD mode. You might never know, unless you test this.
Move to real money only after the process and results are consistent. And even then, start with the smallest possible position size (in the case of Pocket Option it’s just 1 dollar). Treat the first few live sessions as further testing, not a guaranteed victory lap.
Pocket Option gives free $50,000 in virtual funds upon registration, with unlimited refills. This lets you test as many strategies as you want, for as long as you want, with no limits, and without putting any of your real capital on the line.
with Pocket Option trading platform
Get StartedCommon Mistakes to Avoid on the 1-Minute Chart
Loosening the rules after a losing streak. No increasing of size, no relaxing the condition ("the volume is close enough"). Losing streaks are exactly where rules matter most.
Treating every candle as a decision point. Most candles won't meet all three entry criteria. Letting go of potential ‘decent’ trades is also a skill to develop.
Ignoring the higher timeframe filter. Trading purely off the 1-minute chart without the 5-minute confirmations is a very common way false signals get acted upon.
Switching assets after a loss. Jumping to a different coin or pair on a real account means simply resetting your own sample size to zero. Testing a new asset on a demo before live trading is still advised.
For a deeper look at the individual tools this setup uses, you can also explore our:
Disclaimer: Trading involves significant risk of capital loss, and ultra-short timeframes may carry an additional risk from market noise and fast price swings. This article is for educational purposes only and does not constitute any financial advice. Test a strategy on a demo account before committing real funds.
See more:InterestingTrading Strategies