- Top Left: Simple Moving Average (SMA)
- Top Right: Exponential Moving Average (EMA)
- Bottom Left: Weighted Moving Average (WMA)
- Bottom Right: Smoothed Moving Average (SMMA)
Moving Averages for Day Trading: Maximizing Profit Potential

Day trading is a fast-paced and potentially profitable activity that requires quick decision-making and effective tools. One of the most popular and versatile technical indicators used by day traders is the moving average.
Understanding Moving Averages
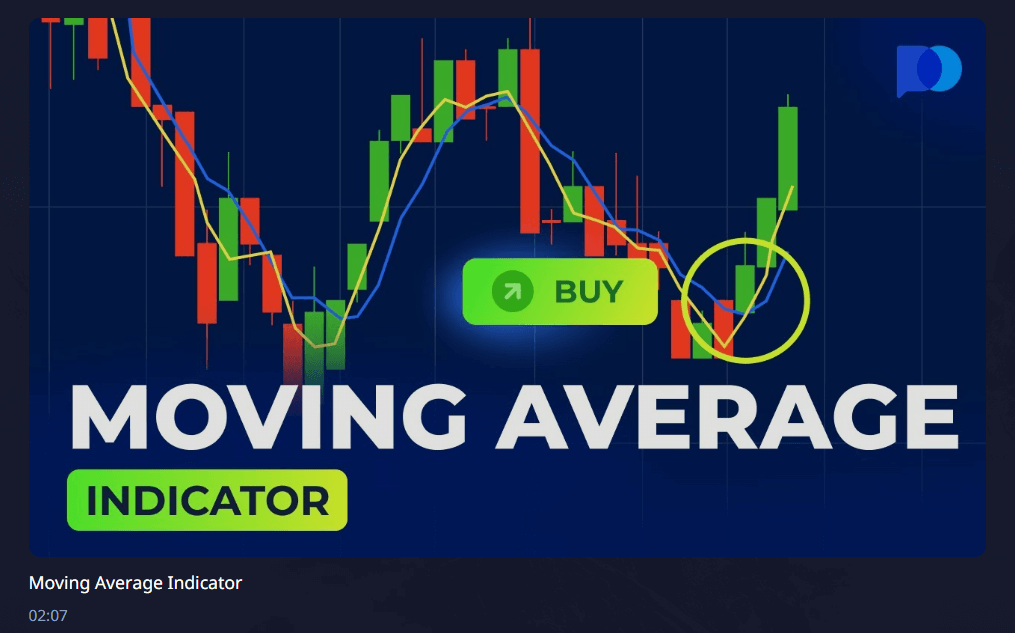
Moving averages for day trading are essential tools in technical analysis that help smooth out price data by creating a constantly updated average price. They are particularly useful for day trading because they can quickly identify trends and potential entry or exit points. Let’s examine the most common types of moving averages used in day trading:
| Type of MA | Description | Advantages | Disadvantages |
|---|---|---|---|
| Simple Moving Average (SMA) | Calculates the average price over a specific period | Easy to understand and calculate | Lags behind price action |
| Exponential Moving Average (EMA) | Gives more weight to recent prices | Responds faster to price changes | Can be more volatile |
| Weighted Moving Average (WMA) | Assigns different weights to data points | Balances recent and historical data | More complex to calculate |
| Hull Moving Average (HMA) | Reduces lag while maintaining smoothness | Provides earlier trend signals | Less commonly available on platforms |
Visual Comparison of Moving Averages
Below is a visual representation of how different types of day trading moving averages behave on candlestick charts:

What Moving Average Is Best for Day Trading?
What moving average to use for day trading? The best moving average for day trading often depends on your strategy. The 9-period and 20-period EMAs are commonly used for short-term trades, while the 50-period SMA may help identify larger trends. Faster averages like the 5-period EMA can be useful in highly volatile markets. Traders may combine multiple MAs to confirm signals.
What Is the 5-8-13 EMA Strategy for Day Trading?
The 5-8-13 EMA strategy is a dynamic method popular among trend-following day traders. It involves placing three exponential moving averages (EMAs) on a chart: one each for the 5, 8, and 13 periods. These settings are derived from the Fibonacci sequence and aim to capture short bursts of momentum within an overall trend.
- Buy Signal: When the 5 EMA crosses above both the 8 and 13 EMAs.
- Sell Signal: When the 5 EMA crosses below the other two.
This strategy is most effective in markets with strong, clear trends. It minimizes lag and helps traders enter early in a movement. Many professional traders overlay additional confirmation indicators, such as RSI or MACD, to avoid false signals.

📌 Pro Tip: According to trading educator Mark Helweg, “the 5-8-13 setup is one of the fastest ways to spot short-term trend shifts before they become obvious to the broader market.”
🎥 Suggested Video: “Trading 5-8-13 EMA Strategy in Real Markets” – available on Pocket Option’s YouTube channel.
Is SMA or EMA Better for Day Trading?
When comparing SMA vs. EMA for day trading, the key difference is responsiveness. EMAs react more quickly to price changes due to their weighted calculation, making them a go-to choice for intraday trading where timing is critical.
- EMA Pros:
- Faster reaction to recent price moves
- Helps catch trends early
- SMA Pros:
- Smoother, less noise
- Useful for confirming overall trend direction
🧠 Expert Insight: According to professional trader Jessica Tanaka, “EMAs give me the entry edge; SMAs give me confidence to stay in the trade.”
📌 Best Practice: Many traders use both indicators together: a short-term EMA (e.g., 9 or 20) to trigger entries, and a longer-term SMA (e.g., 50) to assess broader market sentiment.
Watch the video after registering on the Pocket Option platform.
Which Is Better: 50-Day or 200-Day Moving Average for Day Trading?
Although the 50-day and 200-day moving averages are typically used for swing or position trading, they still serve a role in day trading—particularly in identifying macro trend direction on the daily chart.
- 50-Day SMA:
- Tracks medium-term trends
- Useful for confirming support/resistance on the daily timeframe
- 200-Day SMA:
- Considered a major trend barometer
- Prices trading above it signal bullishness; below it indicate bearish sentiment
🎯 Tactical Use for Day Traders: Many intraday traders use the 50/200 levels as confluence zones, combining them with intraday EMAs or Fibonacci retracements for higher probability trades.
📌 Insider Insight: According to trader blog “AlphaFXEdge”, “institutions monitor the 200-day SMA religiously—it often acts like a self-fulfilling prophecy.”
Using Daily Chart in Swing and Day Trading
Unlike day trading, swing trading focuses on capturing price movements over several days or weeks, often relying on longer-term moving averages like the 50-day or 200-day SMA to guide entry and exit decisions.
The daily chart remains a crucial reference point—even for minute-by-minute decision-making. It provides context to the overall market structure, trend direction, and key support/resistance levels.
- Day Traders Use Daily Charts To:
- Identify high-probability zones
- Avoid trading against macro trends
- Swing Traders Rely on Daily Charts For:
- Spotting breakouts from consolidation
- Timing entries/exits based on candlestick patterns and MAs
🧠 Pro Insight: Day trading coach Amir L. says: “The daily chart is my compass. Even in the 5-minute world, I don’t trade without knowing what the daily trend is doing.”
🗣️ Real Trader Feedback:
“Pocket Option’s clean charting tools let me flip between timeframes in one click—it’s a huge edge for analyzing daily context while scalping.” – Lucas R., full-time trader
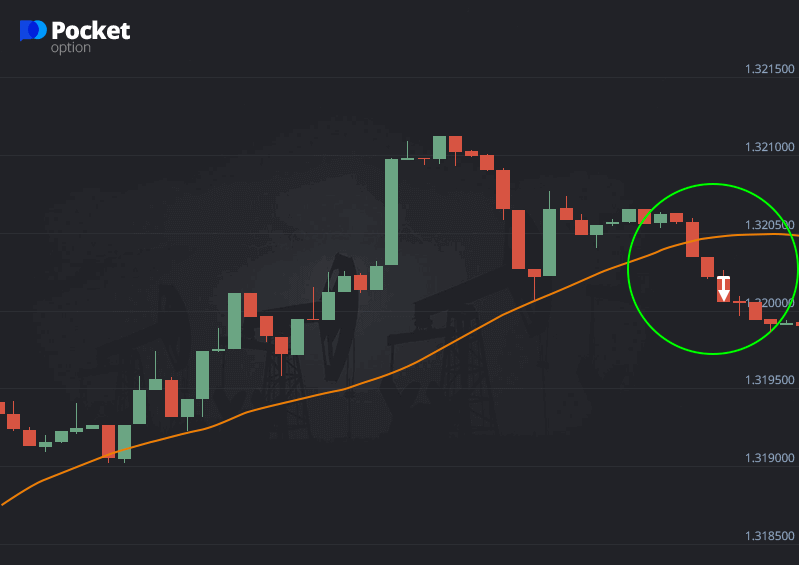
SMA Signal-Based Trading Strategies
One of the effective methods of analyzing market conditions is by using signals generated by the Simple Moving Average day trading (SMA) indicator. On a price chart with an SMA line, two primary types of signals can be identified:
- Trend Reversal – when the price crosses the SMA line.
- Trend Continuation – when the price bounces off the SMA line.
In these cases, the SMA acts as a dynamic support or resistance level depending on whether the price is above or below the indicator. For more accurate signals, it is recommended to use an SMA with a longer period. However, the optimal period should be selected individually for each trading instrument. For example, an SMA with a period of 30 is often suitable for the USDCAD currency pair.
Trading the SMA Bounce
Step-by-step guide for bounce trading:
- Add a 30-period SMA to the chart.
- Wait for the price to approach the SMA line.
- If, after touching the SMA, a second candle appears in the opposite direction, this can be interpreted as a signal to open an option in the direction of the price move.
💡 Tip: This setup often works well in trending markets during minor pullbacks.

Trading the SMA Breakout
Step-by-step guide for trading a breakout:
- Add a 30-period Simple Moving Average to the chart.
- Wait for a candle to close beyond the SMA line.
- If the next candle opens and closes in the direction of the breakout, this can confirm the signal — you can then enter a trade in the breakout direction.
💡 Note: Combine this approach with volume indicators for stronger confirmation.
Benefits of Using SMA
- Easy to interpret
- Widely supported on all platforms
- Works well in multi-timeframe analysis
Pocket Option and Moving Averages
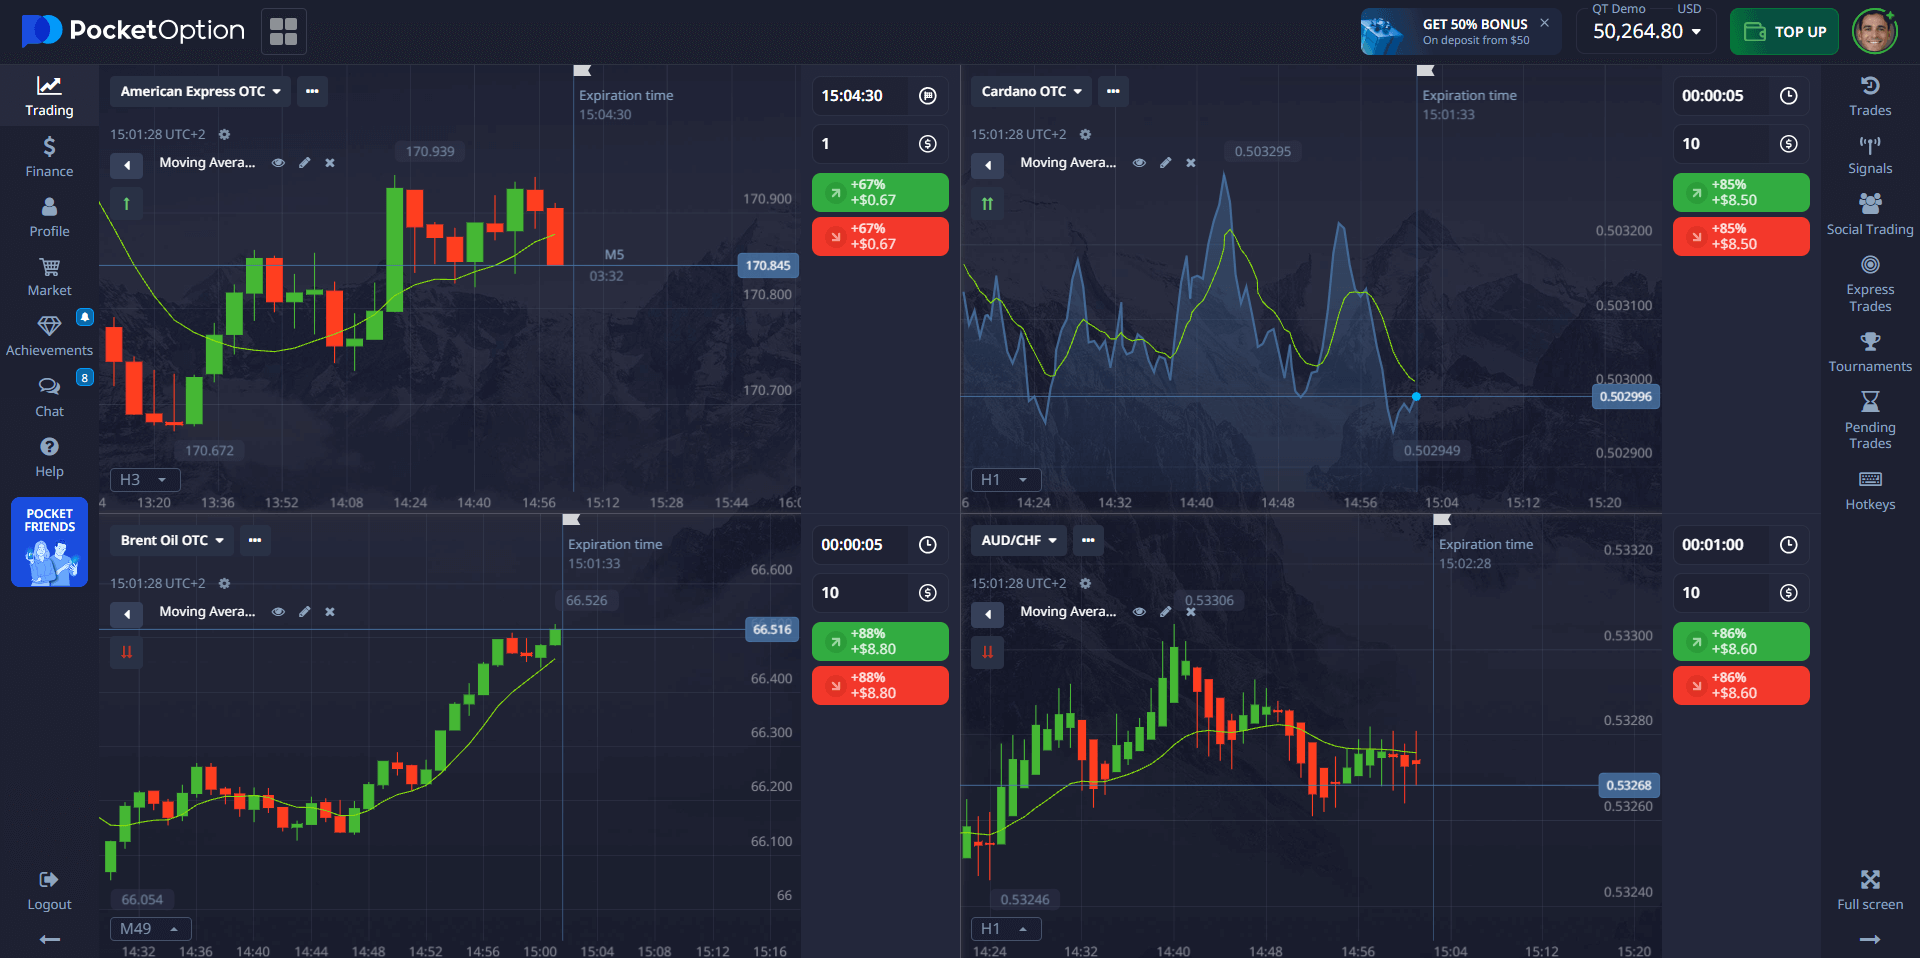
The Pocket Option platform offers a wide range of technical analysis tools and chart options that let you incorporate various indicators—including moving averages—into your trading strategy.
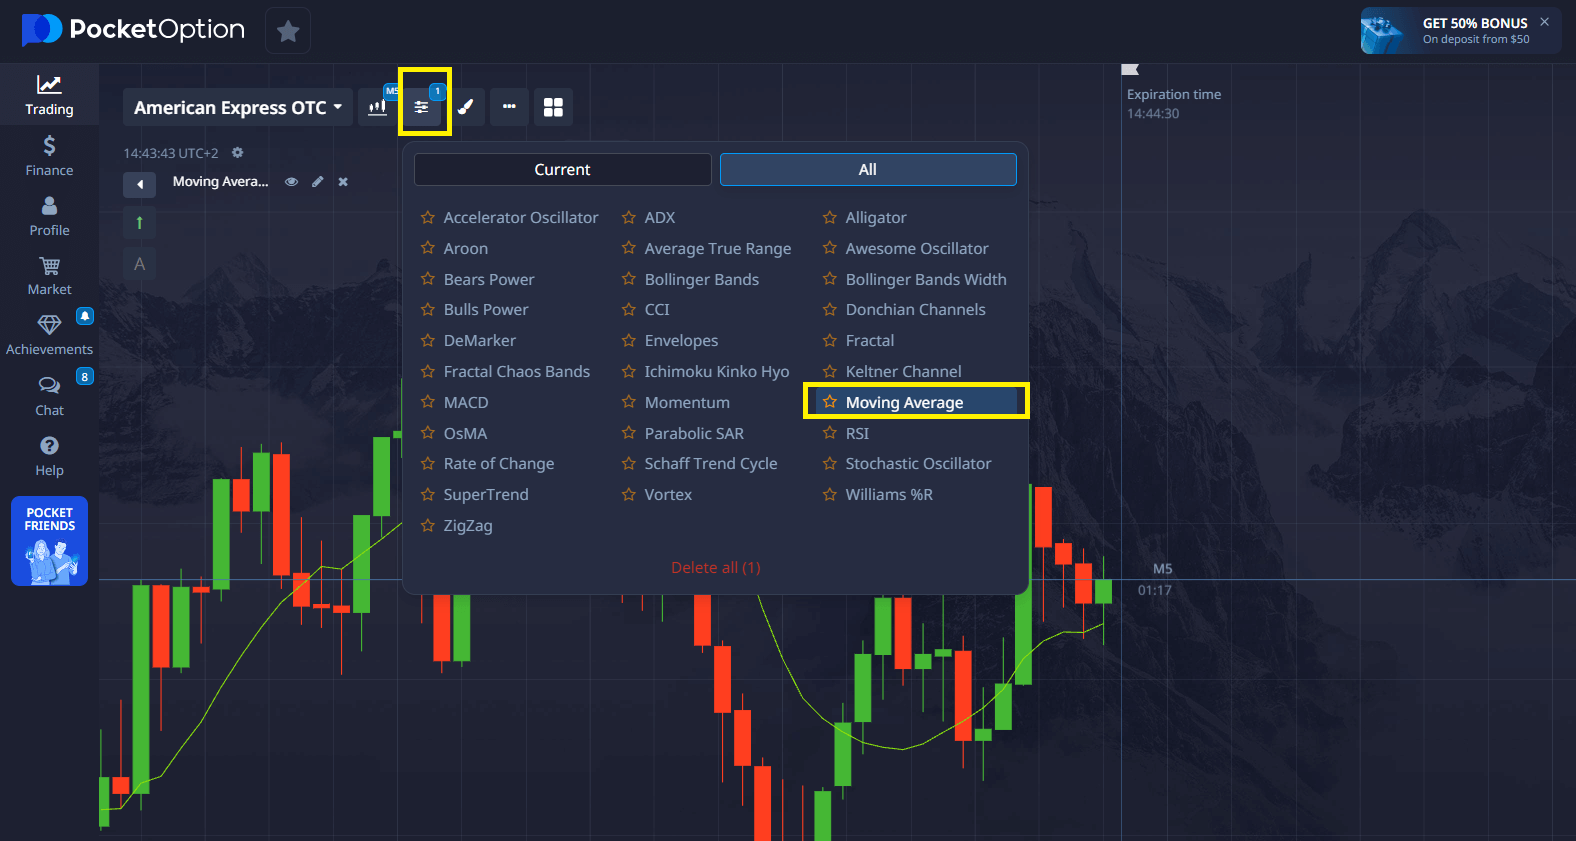
You can customize your charts to display moving averages with different timeframes, helping you identify short- and long-term trends. Additionally, the in-platform signals provide trend direction indicators that can complement your technical analysis.
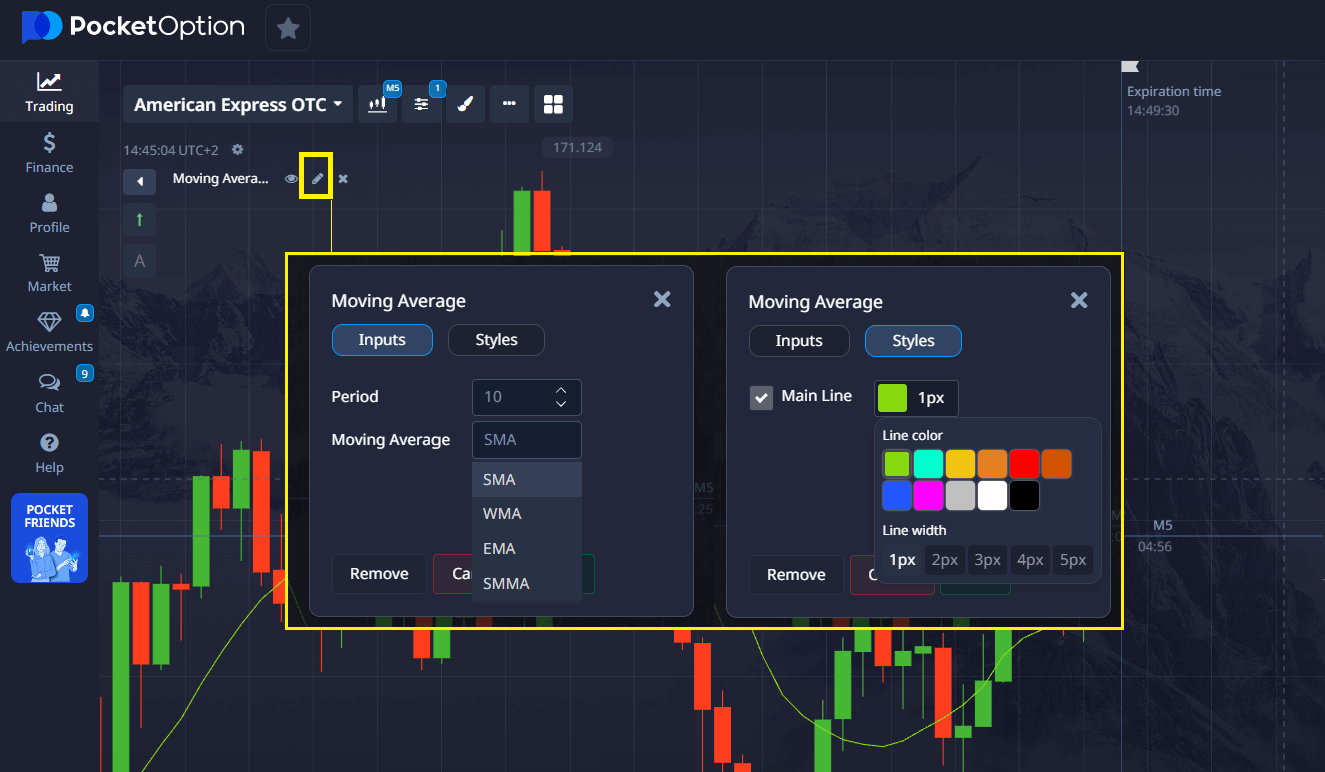
Pocket Option’s user-friendly interface allows both beginners and advanced traders to effectively use moving averages as part of their day trading setup. You can set alerts, adjust indicator settings, and analyze real-time data seamlessly on both desktop and mobile versions.
Example Trade Using the Trend Following Strategy
One of the most effective strategies on Pocket Option is the trend following strategy. Let’s go through a step-by-step example of a trade using this method.
- Asset: AUD/CHF
- Timeframe: 5 minutes
- Trade Amount: $5
Tools Used:
- Moving Average (MA) 50 indicator
- Relative Strength Index (RSI) indicator
Step 1: Identifying the Trend
Open the AUD/CHF chart and add the MA 50 indicator. If the price is above this line and moving upward, the trend is bullish. If the price is below the MA 50 and moving downward, the trend is bearish.
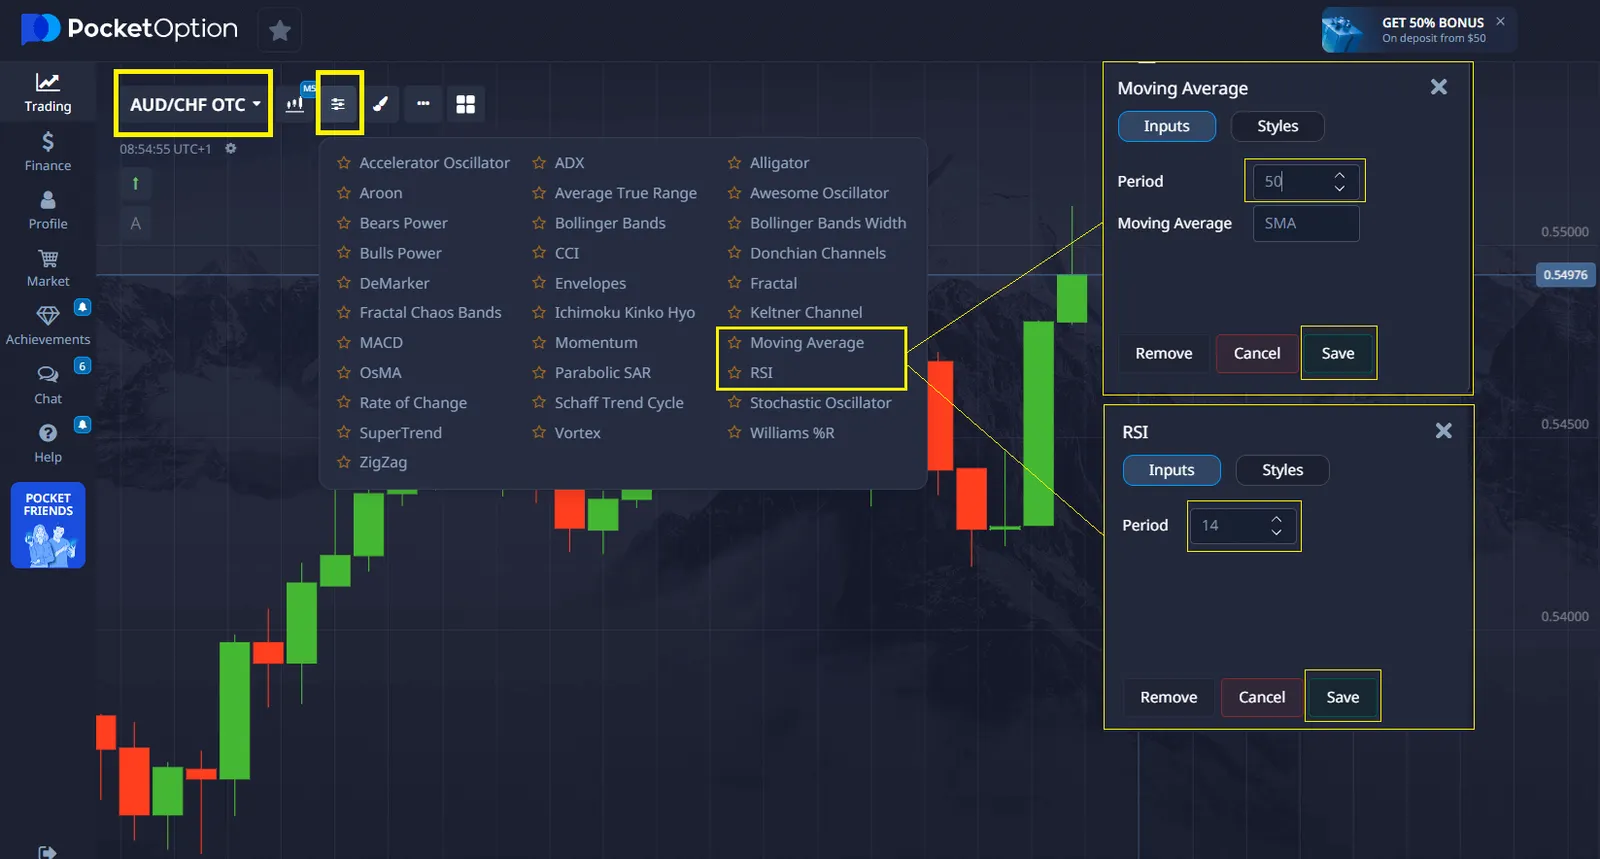
Step 2: Confirming the Signal
Add the RSI indicator and check its value:
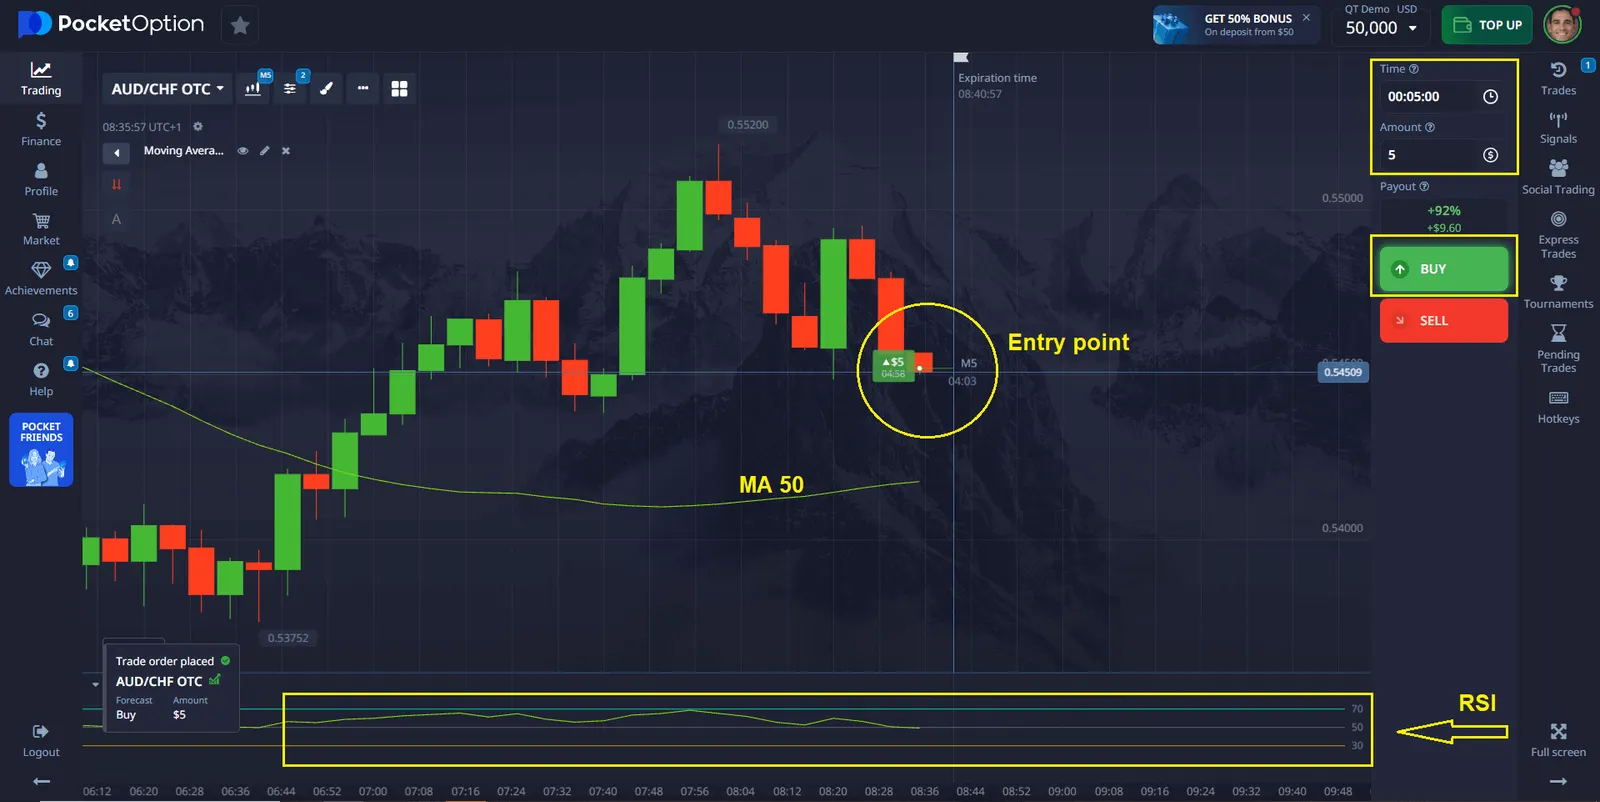
- If RSI is above 50, it confirms an uptrend.
- If RSI is below 50, it confirms a downtrend.
In our example, the price is above the MA 50, and RSI is at 55, confirming an uptrend.
Step 3: Placing the Trade
Since the trend is bullish, we wait for a slight price pullback and then open a CALL (Buy) trade for 5 minutes with a $5 investment.
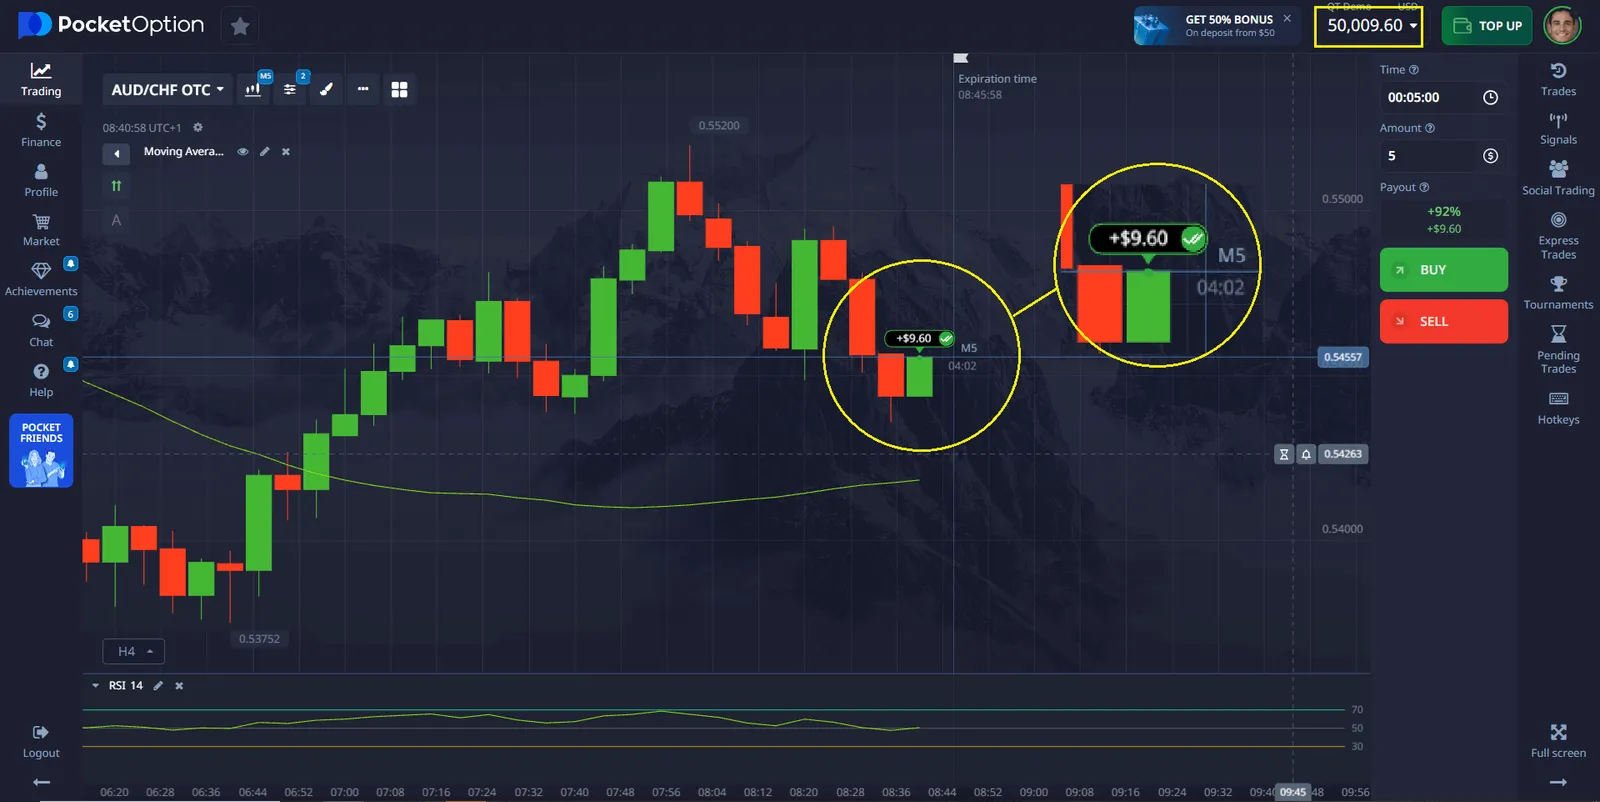
Step 4: Closing the Trade
After 5 minutes, the price continues to rise, and the trade closes in profit.
Result: By analyzing the trend and confirming signals with indicators, we executed a successful trade.
Conclusion
Moving averages for day trading are versatile and powerful tools that can significantly enhance your trading strategy when used correctly. By understanding the different types of moving averages, choosing the right platform, and implementing advanced techniques, you can improve your ability to identify trends, spot potential entry and exit points, and make more informed trading decisions.
Whether you’re using Pocket Option for its user-friendly interface or a more advanced platform like MetaTrader for extensive customization, the key to success lies in consistent practice, ongoing education, and disciplined risk management. As you gain experience with moving average day trading strategies, you’ll develop a deeper understanding of market dynamics and refine your ability to capitalize on short-term price movements.
Remember that while moving averages are valuable tools, they should be part of a comprehensive trading strategy that considers multiple factors. By avoiding common pitfalls and continually optimizing your approach, you can harness the full potential of moving averages to enhance your day trading performance. Discuss this and other topics in our community!
FAQ
What is the best moving average for day trading?
The best moving average for day trading depends on your specific strategy and the market conditions. Many day traders use a combination of short-term (e.g., 9-period) and longer-term (e.g., 20 or 50-period) exponential moving averages (EMAs) for quick signal generation and trend confirmation.
How do I choose the right time period for my moving averages?
Choosing the right time period depends on your trading style and the volatility of the asset you're trading. Generally, shorter periods (5-20) are used for short-term signals, while longer periods (50-200) are used for trend identification. Experiment with different periods and backtest your strategy to find the optimal settings.
Can I use moving averages alone for day trading?
While moving averages are powerful tools, it's generally not recommended to use them in isolation. Combine moving averages with other technical indicators, price action analysis, and consideration of fundamental factors for a more comprehensive trading approach.
How do moving average crossovers work in day trading?
Moving average crossovers occur when a shorter-period moving average crosses above or below a longer-period moving average. A bullish crossover (short crossing above long) may signal a potential buy opportunity, while a bearish crossover (short crossing below long) may indicate a selling opportunity. However, always confirm these signals with other indicators or price action.
Are there any limitations to using moving averages for day trading?
Yes, moving averages have limitations. They are lagging indicators, meaning they can provide late signals in fast-moving markets. They may also generate false signals in choppy or ranging markets. It's important to be aware of these limitations and use moving averages in conjunction with other analysis tools for more reliable trading decisions.
GLOBAL MARKETS RADAR
Sign up for more like this
Customize your newsfeed with content you're actually interested in — get up-to-date personalized newsletter in your inbox.
Your comment
Comments are pre-moderated to ensure they comply with our blog guidelines.