-
23 AUG 2025
 Eco
Eco
-
26 AUG 2025
 Eco
Eco
-
27 AUG 2025
 Eco
Eco
-
30 AUG 2025
 Eco
Eco
-
1 SEP 2025
 Eco
Eco
-
4 SEP 2025
 Eco
Eco
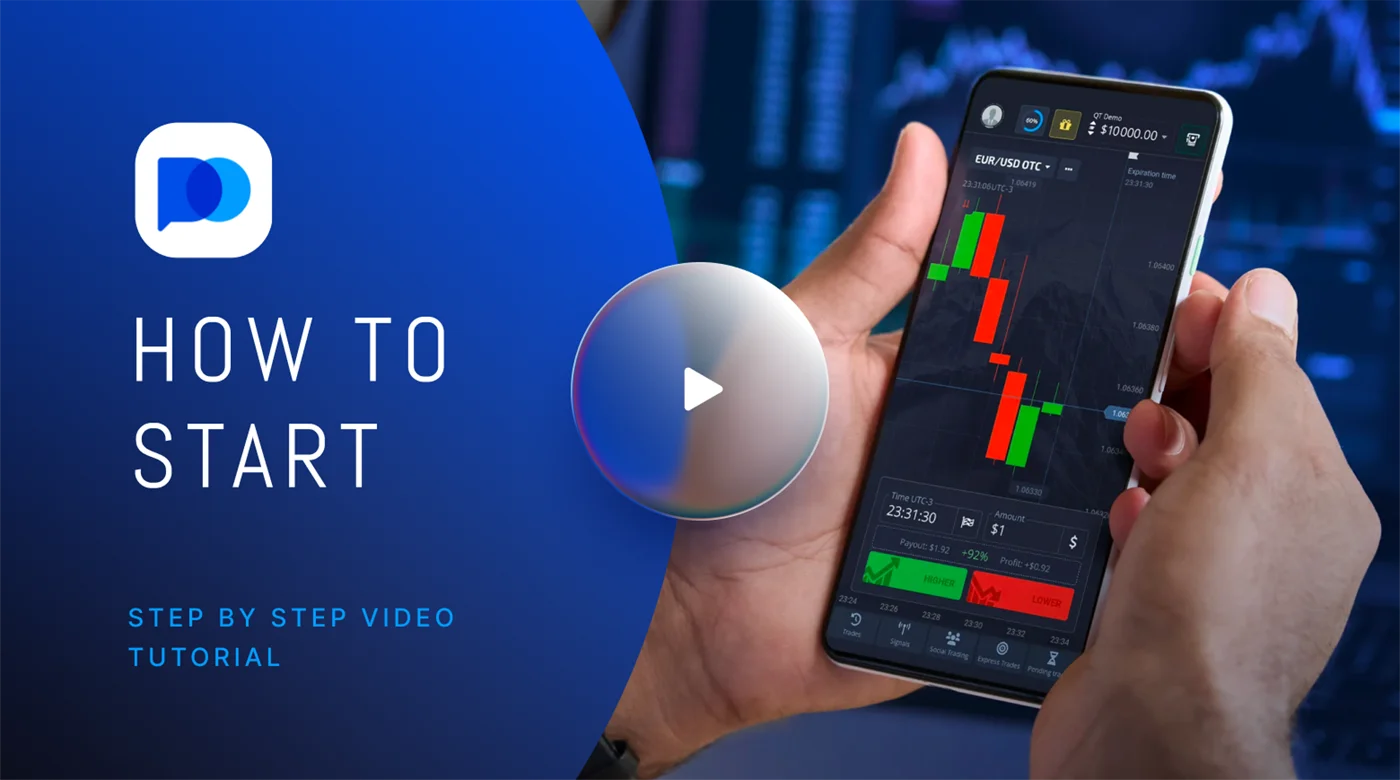
How to Start Trading on Pocket Option | Trading Tutorial
Begin your trading journey with Pocket Option using this comprehensive how to trade guide. Perfect for trading for beginners, learn to register, switch to demo mode for practice, or dive straight into real balance trading.
Discover how to select assets, like the currency pair EUR/USD, and understand the basics of opening a trade.
This video walks you through setting an amount, analyzing trends on the main graph, and setting the expiration time to make a profit. Start trading now with Pocket Option and turn trading knowledge into action.
More info-
19 Aug2025
 Best Win Rate Trading Challenge – Pocket Option Broker CompetitionThe Best Win Rate Challenge is your chance to showcase your trading expertise and win valuable rewards. This exclusive competition, hosted by the Pocket Option Broker community, brings together skilled
 -
13 Aug2025
 Weekend Rush Winners Announced – Congratulations to Our Top TradersWe're excited to celebrate the incredible trading activity from this past weekend! Our Weekend Rush competition has concluded, and we're thrilled to recognize the outstanding performance of our most dedicated
 -
12 Aug2025
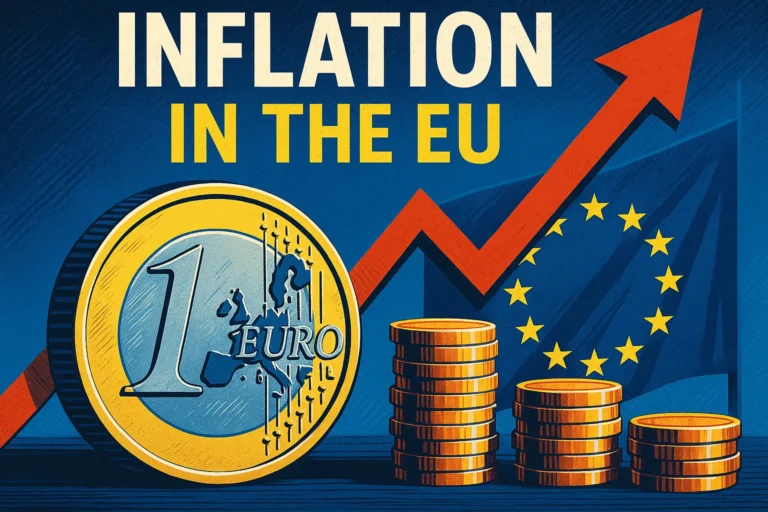
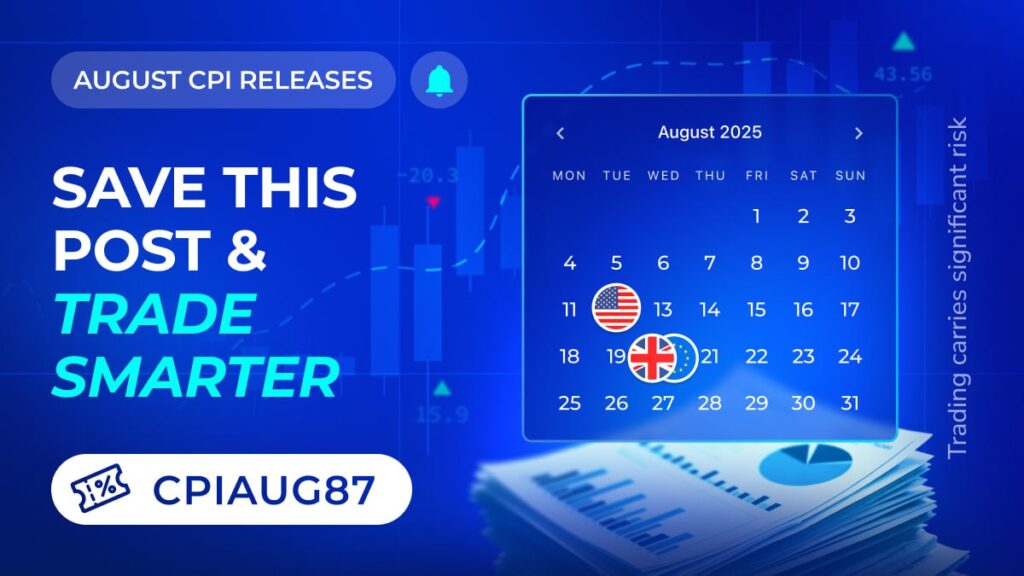 Track Inflation Like a Pro: CPI Release Calendar for Smart Currency TradingUnderstanding inflation trends is crucial for successful currency trading. The Consumer Price Index (CPI) serves as one of the most important economic indicators, directly influencing central bank decisions and currency
 -
8 Aug2025
 Weekend Rush: Get 88% Bonus + Win Extra $50!Kick off your weekend with an instant 88% bonus and a shot at winning $50 — the rush starts now! 🚀
 -
6 Aug2025
 Crazy Gem Days 2025: Join the Ultimate Gem Hunting Event on August 8-9Get ready for the most anticipated gem hunting event of the year! Crazy Gem Days returns with bigger rewards, more excitement, and non-stop action across two incredible days. Whether you're
 -
4 Aug2025
 New Trading Destinations: Mexico, Singapore & New York – Limited Time PromoReady for your next trading journey? Step beyond the ordinary and discover three exciting new trading destinations, each offering a unique experience, updated interface, and exclusive bonuses designed to elevate
 -
29 Jul2025
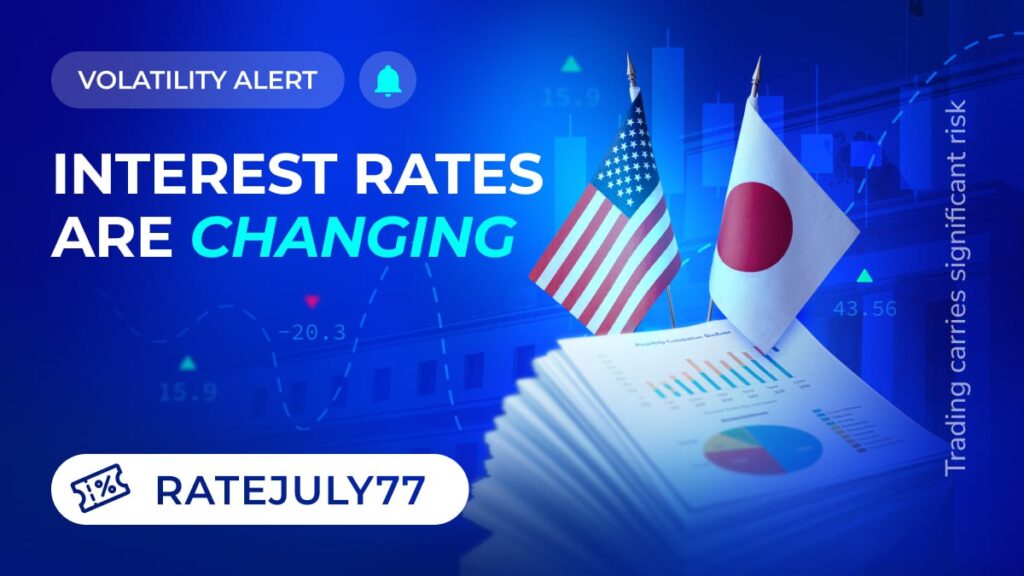 Fed and BOJ Rate Decisions This Week: Trading Opportunities on USD/JPY PairsMajor central bank decisions are approaching that could significantly impact currency markets. Traders should prepare for potential volatility as two of the world's most influential monetary authorities reveal their latest
 -
25 Jul2025
 Weekend Rush: 75% Bonus + Trading ContestsKickstart your weekend with an electrifying trading experience! Our Weekend Rush promotion combines a generous 75% deposit bonus with three thrilling trading challenges, giving you multiple ways to win exciting
 -
23 Jul2025
 Ultrade – Free Trading with Real Profits | Zero Funds RequiredUltrade makes trading easy: start without upfront investment and keep all your profits, designed for simplicity and global access.
 -
21 Jul2025
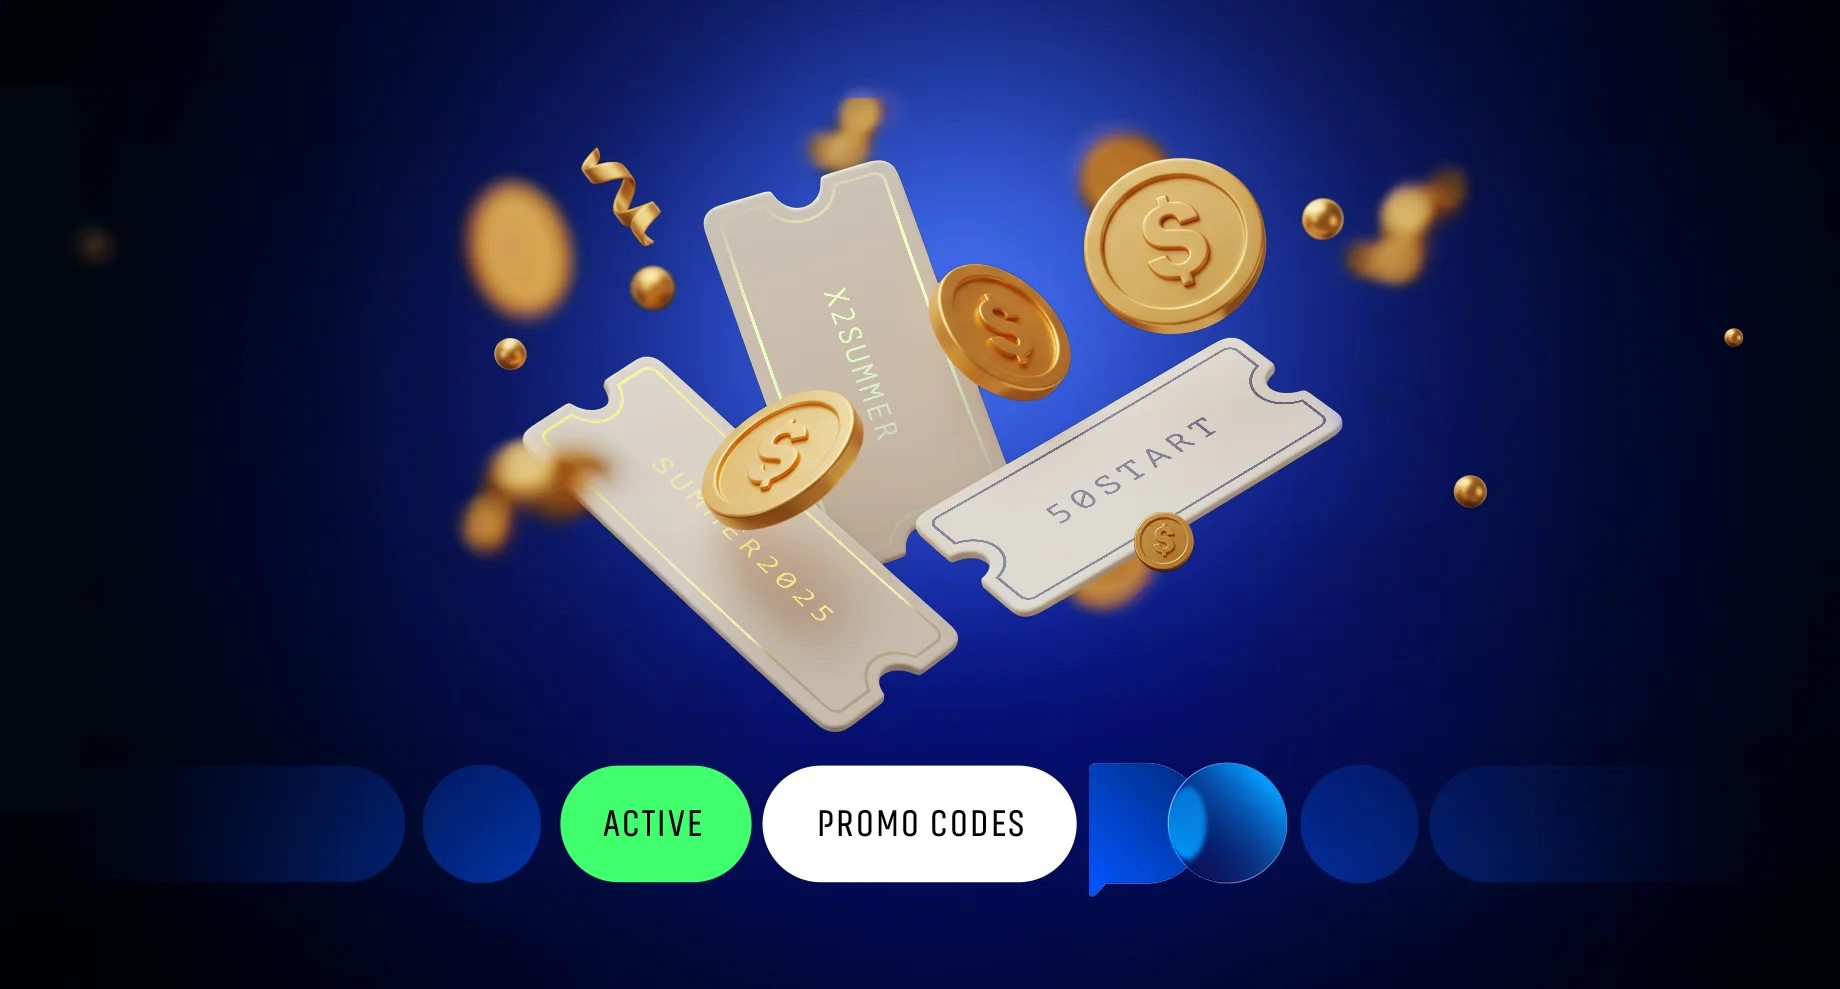
 Unlock 88% Bonus with Promo Code MEMEJUL88If you’ve been waiting for the perfect moment to top up your trading account, now’s your chance! Use a fresh a certified promo code — MEMEJUL88. Don't hesitate, it’s only


Top Assets Payout
Updated at 09:53 UTC+2
Stock
Currency
Commodity
Stock
Cryptocurrency
Index
Asset Name
Payout
50%
50%
50%
50%
50%
50%
50%
50%
45%
45%
Today's Top Traders
Statistics for the last 24 hours
-
 Andrei P. #1Trading turnover: $47,000Average trade: $58Profit. trades: 56%
 -
 Dmitriy F.Trading turnover: $34,206Average trade: $19Profit. trades: 47%
 -
 Tetjana K.Trading turnover: $17,617Average trade: $20Profit. trades: 52%
 -
Michael S.Trading turnover: $9,607Average trade: $86Profit. trades: 60%
-
 Aleksandr S.Trading turnover: $9,055Average trade: $8Profit. trades: 51%
 -
S M.Trading turnover: $8,754Average trade: $4Profit. trades: 50%
-

 How Much Would I Have If I Invested $10,000 in Bitcoin in 2010?A $10,000 Bitcoin investment in 2010 could be worth $6.25 billion in 2025. Learn about Bitcoin’s rise and how to trade it on Pocket Option.Learning
 -

 Trading API EssentialsIn today’s fast-moving markets, trading APIs are game-changing tools, enabling automated strategies, real-time data, and seamless platform integration.Trading
 -
 AI Investment Opportunities: Exploring the $3 AI Stock PhenomenonThe $3 AI stock trend is capturing investors’ attention. This article explores real-world cases, strategies, and results behind this intriguing investment opportunity.Markets
 -
 Will gold rate go up or decrease in сoming days?Gold price fluctuations can lead to huge profits or losses, making it a critical asset for experienced investors. We know how to help you analyze the market and make theMarkets
 -
How Much Would I Have If I Invested $10,000 in Bitcoin in 2010?A $10,000 Bitcoin investment in 2010 could be worth $6.25 billion in 2025. Learn about Bitcoin’s rise and how to trade it on Pocket Option.Learning
-
Trading API EssentialsIn today’s fast-moving markets, trading APIs are game-changing tools, enabling automated strategies, real-time data, and seamless platform integration.Trading
-
AI Investment Opportunities: Exploring the $3 AI Stock PhenomenonThe $3 AI stock trend is capturing investors’ attention. This article explores real-world cases, strategies, and results behind this intriguing investment opportunity.Markets
-
Will gold rate go up or decrease in сoming days?Gold price fluctuations can lead to huge profits or losses, making it a critical asset for experienced investors. We know how to help you analyze the market and make theMarkets
-
How Much Would I Have If I Invested $10,000 in Bitcoin in 2010?A $10,000 Bitcoin investment in 2010 could be worth $6.25 billion in 2025. Learn about Bitcoin’s rise and how to trade it on Pocket Option.Learning
-
Trading API EssentialsIn today’s fast-moving markets, trading APIs are game-changing tools, enabling automated strategies, real-time data, and seamless platform integration.Trading