Takashi Kotegawa, better known as BNF, is one of Japan’s most famous traders. Starting with just $15,000, he grew his fortune to $150 million through disciplined, high-volume stock trading.

Why Takashi Kotegawa Inspires Traders
Starting with capital of just 1.6 million yen (approximately $13,600) in 2000, he managed to grow it into over 15.3 billion yen (about $153 million) in just eight years. His approach, known as the Takashi Kotegawa trading strategy, combines deep market analysis, strict discipline, and the ability to exploit short-term market anomalies.
This article is your comprehensive guide to the Takashi Kotegawa strategy, designed to help both beginners and professionals master his methods and apply them on the Pocket Option platform to achieve consistent results in trading.
Is Takashi Kotegawa a billionaire?Takashi Kotegawa is an enigmatic figure in the world of trading. Unlike many well-known traders, he avoided publicity, never gave interviews, and did not maintain social media profiles. His pseudonym, BNF, originates from the name of a Japanese internet forum where he anonymously shared his trades, sparking both admiration and skepticism from the community.
Kotegawa did not come from a wealthy family, had no connections in the financial world, and possessed no insider information. His success is the result of exceptional discipline, analytical thinking, and the patience to wait for the perfect trade setup.

This article is a comprehensive manual on Takashi Kotegawa’s methods, created for traders of all levels. You will learn:
For beginner traders, we’ll explain fundamental terms such as Japanese candlesticks, trends, stop-losses, and take-profits with simple examples and visual elements.
For advanced traders — in-depth techniques, real-world case studies, and interviews with traders who have successfully applied Kotegawa’s approach.
At the end of the article, you’ll find a 10-step checklist to start trading like Kotegawa Takashi, along with a downloadable PDF trade journal template to help analyze your own trades.
Takashi Kotegawa, known as Kotegawa Takashi, is a name that has become a symbol of success in the trading world.
This Japanese trader turned a modest 1.7 million yen into a staggering 153 million in just a few years.
His legendary J-Com stock trade in 2005, which earned him $20 million in a single day, made him an icon for traders across the globe.
The Takashi Kotegawa strategy is a minimalist yet powerful approach based on:
This strategy not only proved effective in the past but also remains highly relevant in today’s markets.
In 2025, forex, cryptocurrencies, and stocks are experiencing a period of high volatility.
Central bank decisions, Bitcoin ETF announcements, and earnings reports from companies like Tesla and Nvidia are creating market anomalies — exactly the kind of conditions Kotegawa would have exploited with precision.
His Takashi Kotegawa trading strategy is perfectly suited for trading currency pairs like USD/JPY and EUR/USD, due to their liquidity and news sensitivity.
The Pocket Option platform makes this strategy accessible to traders of all experience levels.

Takashi Kotegawa stands out not only for his financial achievements but also for the philosophy that underpins his success. Here are four key principles that made him a legend:
These principles are universal and applicable to any market — from the Japanese stocks that made Kotegawa wealthy, to modern cryptocurrencies and quick trading. In the following chapters, we will dive deeper into how to apply these principles in practice.
The Pocket Option platform is a powerful tool for implementing the Takashi Kotegawa trading strategy. It offers everything needed for successful trading:
Setting up indicators like SMA 50 and RSI on Pocket Option takes just 5 minutes. Traders can test the Takashi Kotegawa strategy on a demo account, honing their skills in trend analysis and risk management.
Takashi Kotegawa proved that success in trading isn’t about luck — it’s the result of discipline and analysis. His approach doesn’t rely on complex algorithms or insider information. Instead, it is built on:
Kotegawa Takashi is a prime example of how discipline, analytical thinking, and patience can lead to outstanding trading results. His Takashi Kotegawa trading strategy is not just a set of rules — it’s a philosophy that continues to inspire traders worldwide.
In the upcoming chapters, we’ll delve into his biography, break down his strategy, explore his psychological principles, and examine how to apply his methods on the Pocket Option platform.
Are you ready to become the next successful trader? Keep reading to discover how to replicate Kotegawa’s success and apply his methods in 2025.
Takashi Kotegawa was not a financial tycoon or an heir to a fortune. In 2000, he began trading with just $13,000, working from a computer in his room in Japan. He didn’t have an MBA degree or any connections in the financial world. His success was built on perseverance, discipline, and a unique approach to market analysis.
Takashi Kotegawa was born in 1978 in Ichikawa, Chiba Prefecture, Japan. Little is known about his early life, as he avoided the spotlight and rarely shared personal details. According to sources such as Skilling, Kotegawa enrolled at the University of Tokyo — one of Japan’s most prestigious universities. However, instead of following a traditional career path in a large corporation, he became fascinated with trading. In his early twenties, he began trading on the Japanese stock market using modest capital of 1.6 million yen (around $13,600 at the time).
Kotegawa had no wealthy relatives or financial industry contacts. His starting capital came from personal savings, possibly from part-time work or a student stipend. This makes his story especially inspiring for beginner traders who often believe success requires a large deposit. Instead, Kotegawa relied on self-education, learning technical analysis, and observing market trends. He spent hours analyzing charts, focusing on Japanese candlesticks and trading volumes — the foundation of his Takashi Kotegawa trading strategy.
In his early years, Kotegawa faced typical beginner challenges: losing trades, emotional decisions, and lack of experience. However, he quickly realized that the key to success was discipline and a systematic approach. He began keeping a trading journal, recording every trade, analyzing his mistakes, and refining his strategy. This process became the core of his philosophy, which eventually helped him turn a small amount of capital into millions.
| Year | Event | Capital | Key Trade |
| 2000 | Started trading | $13,000 | Small trades on Japanese stocks |
| 2005 | J-Com trade | ~$20M (in one day) | Breakout from ¥200,000 → ¥580,000 |
| 2008 | Capital peak | $153M | Multiple trades on volatility |
Kotegawa’s most famous trade occurred in December 2005 with shares of J-Com, a company that had just gone public. This operation cemented his reputation as a trading genius and earned him about $20 million in a single day. How did it happen? Let’s break it down step by step.
That day, Mizuho Securities, a brokerage firm, made a trading error: instead of placing a sell order for 1 share of J-Com at ¥650,000, they mistakenly placed an order to sell 650,000 shares at ¥1. This caused panic in the market, and J-Com’s stock price plummeted by 59% within minutes.
While most traders panicked, Kotegawa Takashi saw a unique opportunity. He quickly analyzed the situation, understood that the drop was due to a technical error, and predicted the price would soon recover. Using his capital, he bought 7,100 shares at an extremely low price (around ¥570,000 per share) and sold them on the rebound when the market realized the mistake and the price returned to normal levels.
This trade brought Kotegawa about ¥2 billion (roughly $20 million). It exemplified his “sniper” approach: instead of trading frequently, he waited for rare but highly profitable opportunities.
The J-Com trade illustrates key elements of the Takashi Kotegawa strategy:
Kotegawa’s philosophy is the heart of his success. He didn’t chase every opportunity or try to predict the market. Instead, he focused on discipline, patience, and data analysis. Here are the key aspects of his philosophy:
Kotegawa compared trading to sniping: “The market is a sniper rifle, not a machine gun.”
Rather than opening many trades, he waited for ideal conditions — moments when the market presented clear entry signals. These could be anomalies, like the J-Com incident, or strong trends confirmed by technical indicators. His patience allowed him to avoid losing trades and concentrate on those with optimal risk/reward ratios.
Kotegawa kept a detailed trade journal, recording every trade: the asset, entry and exit points, indicators, reasons behind the decision, and the outcome.
This helped him analyze mistakes and refine his strategy. For beginner traders, this is one of the most important lessons: without analysis, you can’t improve your results.
Kotegawa never risked more than 1–2% of his capital per trade.
This rule allowed him to survive losing streaks without significant losses.
For example, with a $1,000 account, he would risk no more than $20 per trade, setting stop-losses to limit damage.
This approach is especially important for beginners, who often lose their entire deposits due to excessive risk.
Kotegawa ignored fundamental analysis, such as company financial reports or macroeconomic news. Instead, he relied on technical analysis, especially Japanese candlesticks and trading volumes. He believed that charts contained all the necessary information about market behavior.
On the Pocket Option platform, you can configure Japanese candlesticks to follow his method.
From 2000 to 2008, Kotegawa grew his capital from $13,600 to $153 million. This was no accident. His success was built on:
According to TradingView, his average annual return was about 140%, an extraordinary figure even among professional traders.
However, Kotegawa emphasized that his success wasn’t magic — it was the result of discipline and hard work.
Kotegawa’s story remains highly relevant today, especially for users of the Pocket Option platform. Here are the key takeaways:
The story of Kotegawa Takashi inspires traders because it proves that discipline and analytical thinking can lead to success even with small capital.
To replicate his method in 2025, you must adopt his philosophy and adapt the Takashi Kotegawa strategy to modern markets like currency pairs, which are accessible on the Pocket Option platform.
Below, we break down an example of how to apply his strategy to trading the EUR/USD pair, along with tailored tips for both beginner and experienced traders.
Let’s imagine you’re trading on the Pocket Option platform on May 22, 2025, using a $50,000 demo account.
Your goal is to apply the Takashi Kotegawa strategy to the EUR/USD currency pair, known for its volatility — especially during the London trading session (10:00–14:00 CEST).
Here’s a step-by-step process based on Kotegawa’s principles:
Trend Analysis (Japanese Candlesticks and Moving Averages):
This matches Kotegawa’s approach, where he looked for strong trends confirmed by volume.

Entry Point Identification (Candlestick Patterns):
You decide to open a Buy trade with a 15-minute expiration, in line with the Takashi Kotegawa trading strategy, which focuses on short-term price movements.
This supports your entry signal.
This is a clear example of how the Takashi Kotegawa strategy helps identify high-probability setups with minimal risk.

This example illustrates Kotegawa’s core principles:
On a real account, this trade could have earned $180 profit with a $100 risk.
Kotegawa frequently capitalized on such short-term opportunities, especially during periods of high volatility, such as the London session.

Tips for Experienced Traders

Takashi Kotegawa trading strategy is a powerful approach built on technical analysis, discipline, and risk management. This method is especially well-suited for the forex market, where volatility creates numerous opportunities for short-term trading. In this chapter, we’ll explore the core rules of the Takashi Kotegawa strategy, the indicators used (Japanese candlesticks, moving averages, RSI, volume), preferred timeframes, and provide a trading example on the GBP/USD currency pair using the Pocket Option platform.
For beginners, we’ll explain basic terms, and for experienced traders, we’ll present advanced techniques and tips for adapting the strategy to modern markets.
Kotegawa developed a clear set of rules that helped him identify high-probability trades and minimize risks. These rules are universal and perfectly applicable to trading currency pairs like GBP/USD on Pocket Option. Here are the key principles:

Kotegawa used a minimalist set of tools that are easily accessible on the Pocket Option platform. These tools are perfectly suited for analyzing currency pairs like GBP/USD due to their simplicity and effectiveness.

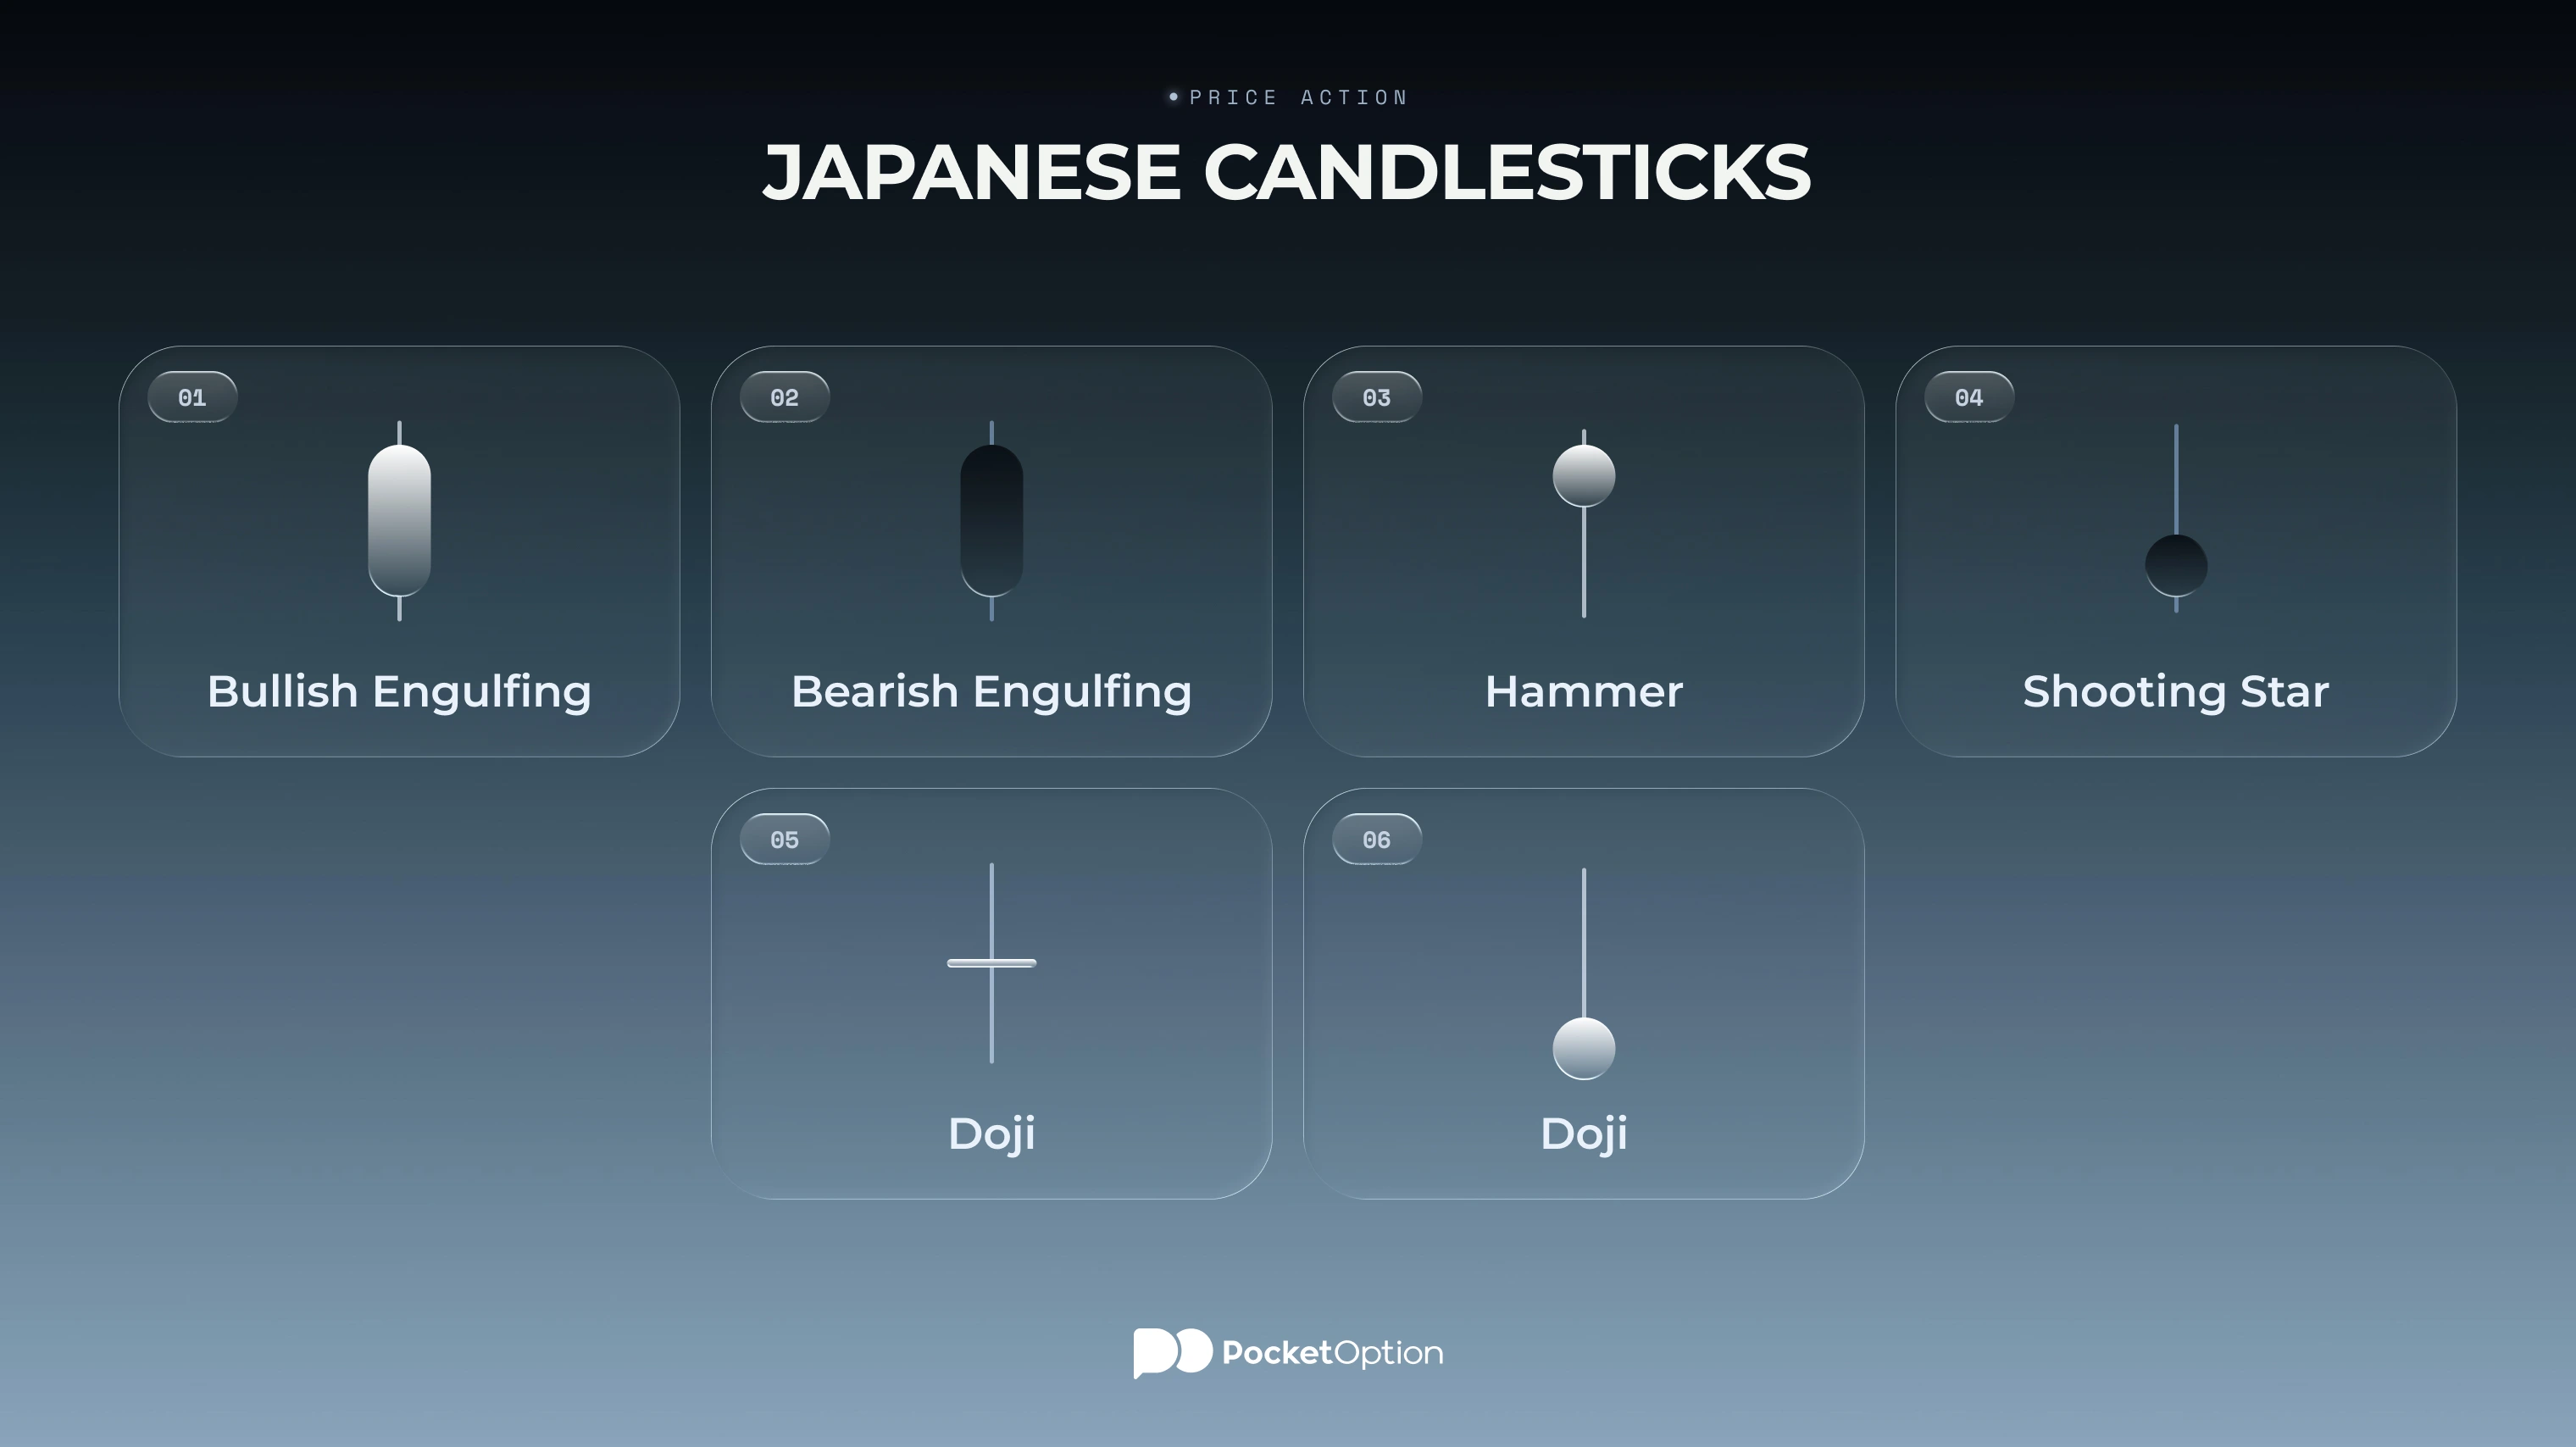
Japanese candlesticks are the cornerstone of the Takashi Kotegawa strategy. Kotegawa looked for patterns indicating trend reversals or continuations. On the forex market, due to its high liquidity, these patterns are particularly reliable.
Key Patterns:
Candlestick Pattern Table
| Pattern | Description | Signal |
| Bullish Engulfing | Bullish candle engulfs bearish candle | Potential rise |
| Bearish Engulfing | Bearish candle engulfs bullish candle | Potential decline |
| Hammer | Small body, long lower shadow | Upward reversal |
| Shooting Star | Small body, long upper shadow | Downward reversal |
| Doji | Open and close at same level | Indecision, reversal |
Kotegawa used the 50-period Exponential Moving Average (EMA) to determine trend direction.
If the price is above the 50 EMA, it signals a bullish trend; if below, a bearish trend.
He also applied the 200-period EMA to confirm long-term trends.
Volume was a critical component of the Takashi Kotegawa strategy.
Kotegawa only entered trades when there was a volume spike of at least 50% above average, confirming the strength of a breakout.
How to analyze volume:
RSI helped Kotegawa identify overbought (above 70) and oversold (below 30) zones.
He used RSI to filter false signals, for example, avoiding buys when the market was already overbought.

Kotegawa used Bollinger Bands to assess market volatility.
Band expansion indicates a strong movement, while band contraction signals a pause before a potential breakout.
This is especially useful for currency pairs like GBP/USD, which often exhibit sharp price spikes.

| Indicator | Setting | Purpose |
| SMA 50 | Period 50, 1H / 4H | Trend identification |
| RSI (14) | Levels 30 / 70 | Detect overbought/oversold conditions |
| Volume | +50% above average | Breakout confirmation |

Kotegawa combined short-term and medium-term timeframes to improve signal accuracy.
His approach is ideal for the forex market, where price movements happen quickly.
On the Pocket Option platform, you can easily switch between timeframes, making it perfect for applying the Takashi Kotegawa strategy.
Kotegawa looked for key levels where the price often pauses or reverses. These zones form the foundation for identifying breakouts.
How to identify levels:
To demonstrate how the Takashi Kotegawa trading strategy works on the forex market, let’s break down a hypothetical trade on GBP/USD on May 22, 2025, at 10:30 CEST (London session).
You’re using a Pocket Option demo account with $50,000 in virtual funds.
Step 1: Trend Analysis
On the 1-hour GBP/USD chart, you notice that the price is above the 50-period EMA (1.3450), indicating a bullish trend.
High volume confirms the strength of the move following UK inflation data.
On the 5-minute chart, the price is testing the 1.3500 support level, forming a hammer pattern — a classic buy signal often used by Kotegawa.

Step 2: Signal Confirmation
The RSI (14) on the 5-minute chart reads 52, indicating the market is not overbought.
Bollinger Bands are expanding, signaling increasing volatility.
On the 15-minute chart, the price is moving within an ascending channel, which further confirms the bullish signal.

Step 3: Risk Management
Following Kotegawa’s rule, you risk 1% of your capital ($100 with a $50,000 account).
You open a BUY trade with a 10-minute expiration, setting a take-profit at the 1.35100 resistance level and a stop-loss at 1.34900.
The risk/reward ratio is 1:2, aligning with Kotegawa’s approach.
Step 4: Trade Execution
You open a BUY trade on GBP/USD with an entry price of 1.35000 and a stake of $100.
After 10 minutes, the price reaches 1.35150, and the trade closes in profit.
The Pocket Option payout is 85%, earning you $185 ($85 profit).
Step 5: Trade Journal Analysis
Just like Kotegawa, you log the trade in your journal:
Asset (GBP/USD), timeframe (5 minutes), indicators (50 EMA, RSI, Bollinger Bands), entry, exit, and result (+$85).
This helps track and analyze the effectiveness of your strategy.
The Takashi Kotegawa trading strategy is highly versatile and easily adaptable to different markets.
This guide focuses primarily on forex, but we also include examples for cryptocurrencies and stocks.
Forex
Currency pairs like USD/JPY and EUR/USD react to economic data and central bank decisions.
Kotegawa would look for breakouts of key levels, confirmed by a 50%+ volume spike and candlestick patterns.
Example: Breakout of 150.00 on USD/JPY with a bullish engulfing pattern and RSI < 70.
Cryptocurrencies
Bitcoin and Solana often move on ETF news or network upgrades.
Kotegawa’s strategy is effective for volume-driven breakouts.
Example: Breakout of $60,000 on Bitcoin after an ETF announcement with +70% volume.
Stocks
Quarterly earnings from Tesla or Nvidia cause sharp price movements.
Kotegawa would look for breakouts confirmed by volume spikes.
Example: Breakout of $305 on Tesla stock after a strong earnings report.
Visual Element: Strategy Application Across Markets
| Market | Asset | Signal Example | Confirmation |
| Forex | USD/JPY | Breakout of 150.00, bullish engulfing | +60% volume, RSI < 70 |
| Cryptocurrencies | Bitcoin | Breakout of $60,000, hammer pattern | +70% volume, RSI < 70 |
| Stocks | Tesla | Breakout of $305, bullish engulfing | +50% volume, RSI < 70 |
For maximum efficiency, trade during periods of high volatility:

Trading psychology is one of the key factors behind Takashi Kotegawa’s success.
His Takashi Kotegawa trading strategy was based not only on technical analysis and risk management but also on exceptional mental discipline.
Kotegawa avoided emotional traps such as greed, fear, and impulsive decisions—mistakes that wipe out most traders’ accounts.
In this chapter, we’ll explore how Kotegawa Takashi developed psychological resilience, the techniques he used to stay composed, and how you can apply his approach when trading the USD/JPY currency pair on the Pocket Option platform.
We’ll also walk through a trade example to show how Kotegawa’s psychological principles apply in real market conditions.
Trading—especially with volatile pairs like USD/JPY—is not only about analyzing charts, but also about managing your emotions.
According to statistics, nearly 90% of beginner traders lose their deposits within the first year due to emotional mistakes:
Takashi Kotegawa avoided these traps through strict discipline and a systematic approach.
His “sniper” philosophy meant he waited for ideal conditions and ignored emotional urges.
This is especially important when trading USD/JPY, where sharp moves triggered by Japanese or U.S. news can lead to panic.
Visual element: Infographic showing four emotional traps (greed, fear, impulsiveness, revenge) with Kotegawa’s methods of overcoming them.
Caption: "Emotional traps and how to avoid them with the Takashi Kotegawa strategy."
Alt tag: "Infographic of emotional trading traps in the Takashi Kotegawa trading strategy."
Kotegawa developed several key principles that helped him maintain mental resilience:
Kotegawa believed that discipline is more important than intuition or luck.
He strictly followed his trading plan, even when the market was unpredictable.
For example, he never increased his position size after a loss to try and “win it back.”
Instead, he analyzed the mistake in his trade journal and resumed trading only with confirmed signals.
His “sniper” approach meant he could wait hours or even days for the perfect trade.
He didn’t trade unless he saw a clear signal confirmed by candlesticks, volume, and indicators like RSI.
This helped him avoid impulsive decisions—especially on volatile pairs like USD/JPY.
Kotegawa didn’t set unrealistic goals, like doubling his account in a week.
He focused on consistent profits (1–2% per trade), which allowed him to stay calm even after losses.
This is especially crucial in forex, where rapid movements can cause stress.
Kotegawa approached trading as a process, not a gamble.
He didn’t celebrate big wins or get upset over losses—as long as they were within his risk parameters.
This emotional neutrality helped him make rational decisions.
Kotegawa used several practical techniques to remain calm and focused:
These techniques are especially valuable when trading USD/JPY, where unexpected news (like decisions from the Bank of Japan) can cause rapid movements and emotional reactions.
To demonstrate how Kotegawa’s psychological principles apply in real trading, let’s break down a hypothetical USD/JPY trade on the Pocket Option platform on June 3, 2025, at 11:00 CEST (London session).
You’re using a demo account with $50,000 in virtual funds.
Scenario
At 10:30 CEST, news breaks about a U.S. Federal Reserve interest rate hike, causing a sharp surge in USD/JPY.
You decide to apply the Takashi Kotegawa trading strategy while maintaining psychological composure.
Step 1: Trend Analysis and Patience
On the 1-hour USD/JPY chart, the price breaks above the 143.00 resistance level and remains above the 50-period EMA, confirming a bullish trend.
High trading volumes further validate the strength of the move.
However, instead of jumping into the trade impulsively, you wait for confirmation, as Kotegawa taught.
On the 5-minute chart, a bullish engulfing pattern forms near the 143.00 level, providing a clear buy signal.

Step 2: Confirm the signal
The RSI (14) on the 5-minute chart shows a value of 65, which indicates that the trade is not overbought. The Bollinger Bands are widening, signaling high volatility. On the 15-minute chart, the price is in an ascending channel, which confirms the bullish signal. You avoid impulsive entry, following the Kotegawa principle of patience.

Step 3: Risk Management and Discipline
You risk 1% of your capital ($100 on a $50,000 account), as Kotegawa recommended.
You open a BUY trade on USD/JPY at an entry price of 143.100 with a 10-minute expiration.
Your take-profit is set at 143.20 and your stop-loss at 143.000, providing a 1:2 risk/reward ratio.
Despite confidence in the signal, you don’t increase your stake, avoiding greed.
Step 4: Emotional Neutrality
After 5 minutes, the price drops to 143.020, causing slight anxiety.
Instead of closing the trade early out of fear, you follow Kotegawa’s plan — trust your analysis and wait for expiration.
After 10 minutes, the price reaches 143.20, and the trade closes in profit with a payout of $185 (85% on Pocket Option).
Step 5: Trade Journal Analysis
You log the trade in your journal:
Asset (USD/JPY), timeframe (5 minutes), indicators (50 EMA, RSI, Bollinger Bands), entry (143.100), exit (143.20), result (+$85).
You also note that you successfully avoided fear during the temporary price dip by following Kotegawa’s emotional neutrality principle.
The USD/JPY currency pair is known for its volatility, especially after news from the U.S. or Japan.
Kotegawa’s psychological principles help you:
To follow Kotegawa Takashi’s approach, use these techniques:
Trading psychology is what set Kotegawa Takashi apart from other traders.
His ability to avoid greed, fear, and impulsive decisions was central to his long-term success.
This USD/JPY example showed how discipline, patience, and emotional neutrality improve performance in forex trading on Pocket Option.
In the next chapters, we’ll explore the pros and cons of the Takashi Kotegawa strategy, provide a step-by-step trading guide for 2025, and share case studies from traders using his method.
Keep reading to develop Kotegawa’s mindset and become a confident, consistent trader.

In 2025, quick trading on the Pocket Option platform offers traders the opportunity to earn fixed profits on currency pairs like USD/JPY, EUR/USD, and assets like Bitcoin, especially during periods of high volatility driven by central bank decisions and economic news.
Quick trading differs from traditional forex by offering fixed risk and fixed profit, which requires adapting the Takashi Kotegawa trading strategy to short-term contracts and precise expiration selection.
This chapter explains how to apply Kotegawa’s approach to quick trading, including expiration timing, strategies for short-term trades, and working with fixed payouts.
Quick trading is a financial instrument where the trader forecasts the price direction of an asset (up or down) over a chosen expiration period, earning a fixed payout (up to 90% on Pocket Option) or losing their stake.
The Takashi Kotegawa strategy is perfectly suited for this type of trading, as its focus on breakouts and candlestick patterns enables accurate predictions of short-term price moves.
Why Kotegawa’s approach works:
Example: In July 2025, USD/JPY breaks above the 151.00 level after a Bank of Japan rate decision.
The trader opens a BUY trade with a 5-minute expiration and earns 85% profit.
Kotegawa sought fast, explosive moves, making his strategy ideal for quick trading (1–15 minutes).
The choice of expiration depends on timeframe and volatility.
Expiration Recommendations:
How to choose expiration:
Example: EUR/USD breaks below 1.0750 after inflation data.
The trader selects a BUY trade with a 5-minute expiration, anticipating movement over the next 1–2 candles.
The Takashi Kotegawa strategy for quick trading focuses on breakouts confirmed by volume and candlestick signals.
Core strategies:
Example: USD/JPY breaks 151.00 with a bullish engulfing pattern and +60% volume spike.
The trader enters a SELL trade with a 5-minute expiration, earning 85% profit.
Indicators help filter signals for quick trading.
Kotegawa used a minimalist setup to avoid overloading his charts.
Settings:
How to set up:

3. Include RSI (14) with levels 30/70.

Example: On EUR/USD, the SMA 50 shows a downtrend, RSI = 32, and volume is +55% on the breakout below 1.0750. This is a signal for a Buy trade with a 5-minute expiration.
Visual Element: Indicator Settings Table
| Indicator | Setting | Purpose |
| SMA 50 | Period 50, 5M/15M | Trend identification |
| RSI (14) | Levels 30 / 70 | Check for overbought/oversold conditions |
| Volume | +50% above average | Breakout confirmation |
Scenario: July 15, 2025, 8:00 GMT, London session. The Bank of Japan raises rates, USD/JPY breaks through the 151.00 resistance level.
Step-by-step:
Scenario: June 10, 2025, 13:00 GMT, New York session. The Fed releases higher-than-expected inflation data, causing a breakout below 1.0750 on EUR/USD.
Step-by-step:
Visual Element: Trade Summary Table
| Asset | Date | Trade Type | Level | Investment | Profit | Expiration |
| USD/JPY | 15.07.2025 | BUY | 151.00 | $50 | $42.50 | 5 minutes |
| EUR/USD | 10.06.2025 | SELL | 1.0750 | $50 | $40 | 5 minutes |
To successfully apply the Takashi Kotegawa strategy for quick trading, follow this checklist:
✅ Identify the trend using SMA 50 on a 5M or 15M chart.
✅ Find support/resistance levels (highs/lows from the past 5–10 days).
✅ Confirm the breakout with a candlestick pattern (bullish/bearish engulfing, hammer).
✅ Make sure volume is at least +50% above the 20-candle average.
✅ Check RSI: under 70 for SELL, over 30 for BUY.
✅ Choose expiration (1–15 minutes) based on volatility and timeframe.
✅ Invest no more than 1% of your capital per trade.
✅ Trade during active sessions: 8:00–17:00 GMT (London) or 13:00–22:00 GMT (New York).
✅ Keep a trade journal, logging asset, trade type, expiration, and result.
✅ Practice on the Pocket Option demo account before going live.
In 2025, despite changes in the financial markets, Kotegawa’s method remains highly relevant—especially for trading volatile currency pairs like AUD/USD.
Markets in 2025 remain volatile due to economic uncertainty, monetary policy shifts, and a growing focus on currency pairs.
AUD/USD, which reflects both the Australian and U.S. economies, often moves 20–50 pips, making it ideal for short-term trading in Kotegawa’s style.
Pocket Option makes it easier to apply the Takashi Kotegawa strategy thanks to:
This guide will help you configure the strategy and begin trading while minimizing risk and maximizing the benefits of Kotegawa Takashi’s approach.
Follow these steps to implement the Takashi Kotegawa trading strategy on Pocket Option.
Each step includes guidance tailored to the AUD/USD pair, with visual elements for clarity.
Step 1: Registration and Setup on Pocket Option
1. Create an account. Register on Pocket Option and open a demo account with $50,000 virtual funds.


Step 2: Configure Indicators
Kotegawa used a minimalist set of tools, all easily customizable on Pocket Option:
Step 3: Choose Your Trading Time

Kotegawa traded during periods of high volatility.
Check the economic calendar on Pocket Option to avoid major announcements like Reserve Bank of Australia rate decisions, which can disrupt technical signals.
Step 4: Trend Analysis
Step 5: Signal Confirmation
Kotegawa used multi-timeframe analysis to filter false signals:
Step 6: Risk Management
Step 7: Trade Entry
After signal confirmation, open a BUY or SELL trade on Pocket Option with an expiration of 5–15 minutes, depending on AUD/USD volatility.
Step 8: Trade Analysis and Journal
Log each trade in your journal:
Asset (AUD/USD), timeframe, indicators, entry/exit points, result, and emotions.
This will help you analyze mistakes and improve your strategy, as Kotegawa did.
Let’s break down a hypothetical trade on AUD/USD on May 22, 2025, at 11:00 CEST (London session), using the Takashi Kotegawa trading strategy.
You're trading with a Pocket Option demo account and $50,000 in virtual funds.
Scenario
AUD/USD is showing volatility after the release of Australian export data.
You follow Kotegawa’s step-by-step approach.
Step 1: Trend Analysis
On the 1-hour AUD/USD chart, price is above the 50 EMA (0.6650), indicating a bullish trend.
A volume spike confirms the strength of the move.
On the 5-minute chart, price tests the 0.6670 support level, forming a hammer pattern — a buy signal.
Step 2: Signal Confirmation
Step 3: Risk Management
Step 4: Trade Execution
You open a BUY trade with a fixed stake of $100.
After 10 minutes, price reaches 0.6700 —
the trade closes in profit, earning a payout of $185 (85% on Pocket Option).
Step 5: Trade Journal Entry
You record:
Asset (AUD/USD), timeframe (5 minutes), indicators (50 EMA, RSI, Bollinger Bands),
entry (0.6670), exit (0.6700), result (+$85).
You also note that discipline and multi-timeframe confirmation helped avoid false signals.
Real-life examples help illustrate how the theoretical principles of the Takashi Kotegawa trading strategy are applied in practice. Every trader faces unique challenges — market volatility, emotional pressure, and time constraints. The USD/CAD currency pair, closely tied to the U.S. and Canadian economies, is ideal for demonstrating Kotegawa’s strategy, as it often exhibits sharp moves driven by news such as oil prices or Fed announcements. These interviews reveal how traders use Japanese candlesticks, indicators, and discipline to succeed on Pocket Option.
Profile: Anna, 28, a marketing specialist from Brazil, started trading on Pocket Option six months ago with a $500 deposit. She studied the Takashi Kotegawa strategy through blogs and forums, including Skilling.
Q: How did you start using the Takashi Kotegawa trading strategy?
Anna: I was looking for a strategy that didn’t require a large investment. Kotegawa’s story inspired me — he started small, just like me. I started with a Pocket Option demo account, practicing with USD/CAD. I also followed trading communities on Instagram, where I found posts breaking down the Kotegawa strategy with real chart examples.
Q: How did you adapt the strategy?
Anna: I set up a 5-minute chart with the 50-period EMA, RSI, and Bollinger Bands, just like Kotegawa recommended. At first, I overtraded, but then I realized I needed to wait for “sniper” signals — like a hammer pattern near a support level. I also risk only 1% of my deposit ($5), which protects me from large losses.
Q: What was your best result?
Anna: My best trade was on USD/CAD in February 2025. I spotted a bullish engulfing pattern on the 5-minute chart at the 1.3550 level after news of rising oil prices. RSI was at 45, and volume increased. I opened a Buy trade with 10-minute expiration and earned $8.50 (85% payout). It’s a small profit, but for me, it was a breakthrough because I followed the plan and avoided emotional trading.
Q: What challenges did you face?
Anna: The hardest part is patience. Sometimes I wait for hours for a signal, which is exhausting. Also, news like Canadian employment data can disrupt my signals. Now I always check the economic calendar before trading.
Takeaway from Anna: For beginners, the Takashi Kotegawa strategy teaches discipline and patience. Start with a demo account and never increase risk, even if the signal looks perfect.
Profile: Marcus, 35, an IT specialist from Vietnam, has been trading for two years with a $5,000 deposit. He adapted the Takashi Kotegawa strategy for scalping USD/CAD.
Q: Why did you choose Kotegawa’s strategy?
Marcus: I tried various approaches, but most were too complicated. The Takashi Kotegawa strategy appealed to me because of its simplicity and focus on technical analysis. I trade USD/CAD because it’s volatile, especially after Fed news, and suits short-term trades.
Q: How do you apply the strategy?
Marcus: I use 1-minute and 5-minute charts for signal entries, and the 15-minute chart to confirm the trend. My indicators are the 50-period EMA, RSI, volume, and support/resistance levels. I also added MACD to filter false signals — not strictly Kotegawa, but helpful. I risk 2% of my deposit ($100) per trade.
Q: Tell us about a recent trade.
Marcus: In March 2025, I traded USD/CAD during the New York session. On the 5-minute chart, a bearish engulfing pattern formed at resistance around 1.3600. RSI was at 70, and Bollinger Bands began to contract. I opened a Sell trade with a 5-minute expiration. The price dropped to 1.3570, and I earned $85. The key was discipline: I didn’t enter until I had confirmation on the 1-minute chart.
Q: What were the challenges?
Marcus: False signals on lower timeframes are a big issue. I’ve lost $100 by rushing in. Now I wait for MACD and volume confirmation. Also, oil news heavily affects USD/CAD, so I avoid trading during major releases.
Takeaway from Marcus: Combine the Takashi Kotegawa strategy with extra indicators to reduce false signals. Always confirm trades across multiple timeframes.
Profile: Lisa, 42, a former bank analyst from Chile, has been trading for five years with a $50,000 deposit. She uses the Takashi Kotegawa strategy for both scalping and swing trades on USD/CAD.
Q: How have you integrated Kotegawa’s strategy?
Lisa: I value the strategy for its discipline and risk control. I trade USD/CAD on Pocket Option using 5-minute and 1-hour charts. My indicators: 50- and 200-period EMA, RSI, Bollinger Bands, and volume. I also use Fibonacci levels for precise entries. I risk 1% of my deposit ($500) per trade.
Q: Tell us about your best trade.
Lisa: In February 2025, I earned $1,700 on USD/CAD in one session. On the 1-hour chart, the price broke above the 200 EMA (1.3500) with strong volume, signaling a bullish trend. On the 5-minute chart, a hammer formed at the 61.8% Fibonacci level (1.3520). RSI was 55, and Bollinger Bands were expanding. I opened a BUY trade with 15-minute expiration, and the price rose to 1.3560. It was a classic sniper entry, Kotegawa style.
Q: What limitations have you found?
Lisa: The strategy requires significant time for analysis, which is hard for busy traders. It’s also less effective during low-volatility periods when USD/CAD moves sideways. I solve this by trading only during London and New York sessions and setting candlestick alerts.
Takeaway from Lisa: Use the Takashi Kotegawa strategy during high-activity market hours and enhance precision with Fibonacci levels. Alerts help save time.
The lessons from Anna, Marcus, and Lisa show how the Takashi Kotegawa strategy remains worth 2025 for traders seeking disciplined, high-precision trading methods.
To demonstrate how the Takashi Kotegawa strategy applies in real-world conditions, here’s a simulated trade on USD/CAD from May 22, 2025, at 15:00 CEST (New York session). You’re using a Pocket Option demo account with $50,000.
Scenario:
USD/CAD reacts to newly released inflation data from Canada. You follow Kotegawa’s principles, applying his indicators and discipline.
Step 1: Trend Analysis
On the 1-hour chart, USD/CAD is trading below the 50-period EMA (1.3650), indicating a bearish trend. Volume is increasing, confirming momentum. On the 5-minute chart, the price tests resistance at 1.3630 and forms a bearish engulfing pattern — a Sell signal.
Step 2: Signal Confirmation
RSI (14) on the 5-minute chart reads 68 — near overbought but not extreme. Bollinger Bands are expanding, signaling volatility. On the 15-minute chart, the price is within a downward channel, reinforcing the bearish bias. The 1-minute chart shows an additional bearish candle, increasing conviction.
Step 3: Risk Management
You risk 1% of capital ($100). You open a Sell trade on USD/CAD at 1.3630 with 10-minute expiration. Take-profit is set at the 1.3590 support level (40 pips), and stop-loss at 1.3650 (20 pips), ensuring a 1:2 risk-reward ratio.
Step 4: Trade Execution
You place the SELL trade with a fixed $100 stake. After 10 minutes, the price drops to 1.3600. The trade closes in profit with an $85 payout (85% on Pocket Option).
Step 5: Trade Journal Analysis
You record: asset (USD/CAD), timeframe (5 min), indicators (50 EMA, RSI, Bollinger Bands), entry (1.3630), exit (1.3600), result (+$85). You note that patience and multi-timeframe analysis helped avoid a false signal.
The stories of Anna, Marcus, and Lisa show how the Takashi Kotegawa strategy can be adapted to different experience levels:
This chapter provides a 10-step checklist to help you start trading like Kotegawa Takashi, avoiding common mistakes. We’ll also explore a trade example using NZD/USD to demonstrate how to apply the checklist in real conditions. For beginners, the checklist serves as a step-by-step guide, while experienced traders can use it to sharpen their strategy.
Trading requires a structured approach, and the Takashi Kotegawa strategy is built on clear rules. A checklist helps organize the process, reduce emotional decisions, and focus on key aspects: analysis, discipline, and risk management. The NZD/USD pair, linked to the economies of New Zealand and the U.S., is ideal for Kotegawa’s strategy due to its volatility during the London and New York sessions. By following these 10 steps, you can implement the Takashi Kotegawa trading strategy on Pocket Option and get closer to Kotegawa-level consistency.
Follow these steps to master the Takashi Kotegawa strategy and begin trading NZD/USD on the Pocket Option platform. Each step includes recommendations and visual cues for clarity.
Step 1: Open a Demo Account on Pocket Option
Create an account on Pocket Option and start with a demo balance of $50,000 in virtual funds. This lets you practice the Takashi Kotegawa trading strategy risk-free. Select NZD/USD in the “Trade” section and set up a 5-minute chart with Japanese candlesticks.
Tip: Practice for at least 2–4 weeks to get familiar with the interface and test the strategy.
Step 2: Set Up Your Indicators
Kotegawa used a minimalist toolset, all available on Pocket Option:
Step 3: Choose Your Trading Time
Kotegawa traded during high-volatility periods. For NZD/USD, optimal times include:
Step 4: Learn Candlestick Patterns
Master key patterns Kotegawa used for signal detection:
Step 5: Perform Multi-Timeframe Analysis
Kotegawa confirmed signals across timeframes:
Step 6: Set Risk Management Rules
Step 7: Create a Trading Plan
Before each session, define:
Step 8: Wait for a "Sniper" Signal
Kotegawa only entered trades on clear signals:
Step 9: Keep a Trading Journal
Document every NZD/USD trade:
Tip: Save chart screenshots from Pocket Option for post-trade analysis.
Step 10: Review and Improve
Review your trading journal weekly to:
Tip: Focus on the process, not just profits — just like Kotegawa emphasized.
To demonstrate how the checklist works, let’s walk through a hypothetical trade on NZD/USD on May 22, 2025, at 14:30 CEST (New York session). You’re using a Pocket Option demo account with $50,000.
Scenario
NZD/USD is reacting to New Zealand export data. You apply Kotegawa’s checklist.
Steps 1–2: Demo Account and Indicators
You’ve opened a demo account and set up the NZD/USD 5-minute chart with a 50-period EMA, RSI (14), Bollinger Bands, and volume.
Step 3: Trading Time
You’re trading at 14:30 CEST during the New York session when NZD/USD is active. The economic calendar shows no major news releases.
Steps 4–5: Trend Analysis and Patterns
On the 1-hour chart, price is above the 50-period EMA (0.6150), indicating a bullish trend. On the 5-minute chart, the price tests support at 0.6170, forming a bullish engulfing pattern. The 15-minute chart shows a rising channel, confirming the signal.
Step 6: Risk Management
You risk 1% of your capital ($100). You open a BUY trade at 0.6170 with a 10-minute expiry.
Steps 7–8: Plan and Signal
Your plan: only enter on bullish engulfing, RSI between 30–70, high volume.
Step 9: Trade Execution and Logging
You open a BUY trade with a fixed $100 stake. Price reaches 0.6200 and the trade closes in profit ($185, 85% payout).
You record:
Step 10: Analysis
In your journal, you note that success came from patience and confirmation across three timeframes. No mistakes occurred because you followed your plan precisely.
We’ve compiled 10 frequently asked questions based on what traders typically want to know about the Takashi Kotegawa strategy. Each answer includes a EUR/USD recommendation and practical trading tips.
Q1: Is the Takashi Kotegawa strategy suitable for beginners?
A: Yes, the strategy is beginner-friendly thanks to its simplicity and rule-based structure. Kotegawa used a minimalist setup (50-period EMA, RSI, Bollinger Bands, and volume), all of which are easy to configure on Pocket Option. His 1–2% risk rule protects traders from major losses, which is ideal for new traders. However, beginners must develop patience, as the “sniper” approach requires waiting for ideal setups.
EUR/USD Tip:
Start with a demo account on Pocket Option and practice trading EUR/USD on the 5-minute chart. Look for simple setups like a hammer at support, and risk no more than 1% ($10 on a $1,000 account).
Advice: Practice for 1–2 months to master Kotegawa’s discipline.
Q2: What indicators work best with the Takashi Kotegawa strategy?
A: Kotegawa relied on:
These indicators work especially well for EUR/USD, as the pair often forms clean trends and reversal patterns.
EUR/USD Tip:
Apply the indicators to the 5-minute chart. For example, enter a BUY if price is above the EMA, RSI is below 70, and Bollinger Bands are expanding.
Advice: Save this indicator setup on Pocket Option for quick access.
Q3: How do I adapt the strategy to low-volatility pairs like EUR/USD?
A: While EUR/USD is less volatile than GBP/JPY or USD/JPY, the Takashi Kotegawa strategy still works if you:
Use the 5-minute chart for entries and 15-minute chart for trend confirmation.
EUR/USD Tip:
Trade between 10:00–14:00 CEST, when EUR/USD moves 20–40 pips. Look for candlestick patterns like doji at support, with confirmation from RSI and volume.
Advice: Shorten trade expiry to 5–10 minutes to match the pair’s lower volatility.
Q4: How to deal with false signals?
A: False signals are common, especially on lower timeframes. Kotegawa reduced them through multi-timeframe analysis and waiting for volume confirmation. For instance, a hammer on the 5-minute chart should be accompanied by a volume spike and RSI in the neutral zone (30–70).
EUR/USD Tip:
Confirm entries using both the 1-hour and 15-minute charts. If the 1-hour chart shows sideways movement, skip the trade.
Advice: Add MACD to filter signals — e.g., a MACD crossover can confirm trend direction.
Q5: Can I combine the Takashi Kotegawa strategy with fundamental analysis?
A: Kotegawa ignored news events and relied solely on technical analysis. However, in 2025, fundamentals like ECB rate decisions heavily impact EUR/USD. You can adapt the strategy by checking the economic calendar and avoiding trades during major news releases.
EUR/USD Tip: Avoid trading 30 minutes before and after EU GDP or ECB rate announcements. Use news for context — for example, weak euro data may strengthen a bearish signal.
Advice: Set Pocket Option alerts for key economic events.
Q6: How long should I wait for signals using the Takashi Kotegawa strategy?
A: Kotegawa’s “sniper” approach demands patience. Signals may only appear once every 1–2 hours or even less often, especially on EUR/USD. Focus on quality over quantity — wait for clear patterns confirmed by indicators.
EUR/USD Tip: Analyze charts every 15–30 minutes during the London session. If no signal appears, take a break to avoid impulsive trades.
Advice: Use candlestick pattern alerts on Pocket Option to reduce idle screen time.
Q7: How should I manage risk with the Takashi Kotegawa strategy?
A: Kotegawa risked 1–2% of his capital per trade and followed a 1:2 risk/reward ratio. This protects your account from major losses, especially on volatile pairs like EUR/USD.
EUR/USD Tip: With a $50,000 account, risk $100 per trade. Set your stop-loss just beyond support/resistance (e.g., 20 pips) and take-profit at 40 pips.
Advice: Use fixed-stake mode on Pocket Option to enforce 1% risk discipline.
Q8: What are the best timeframes to use?
A: Kotegawa used multi-timeframe analysis:
This works well with EUR/USD, which often forms more subtle trends than pairs like GBP/JPY.
EUR/USD Tip: Start with the 1-hour chart to define the trend, then refine entries on the 5-minute chart.
Advice: For scalping, try the 1-minute chart — but always use extra filters like MACD.
Q9: How can I develop psychological discipline like Kotegawa?
A: Kotegawa stayed emotionally neutral, avoiding greed and fear. He maintained a trading journal to log emotional patterns and took breaks after losses.
EUR/USD Tip: After a losing trade, step away from the screen for 30–60 minutes. Record your emotions in your journal to recognize impulsive behavior.
Advice: Practice breathing exercises before each session to stay calm and focused.
Q10: How should I trade during sideways (range-bound) markets?
A: This strategy doesn’t work well in flat markets. Best conditions include:
Test: If ATR(14) is less than 1% of price, it’s best to avoid trading.
See more:strategybeginnerInterestingReviews
Comments 0