Free Cash Flow Yield
Profits show a certain perspective. Cash is the reality. Free cash flow yield takes the latter into account and lets you see how much of it you're getting for the cost of the shares. This text will walk you through a practical example using a publicly-traded firm, differentiate the calculable version from the institutional one, and explain why the number tells you more about the price than about the business.

What Is Free Cash Flow Yield
So, what is free cash flow yield? It is the free cash produced in the course of a year, shown as a percentage of the market value assigned to the company.
Free cash flow itself is the cash left after the company has paid to run and maintain its operations. It is the cash the business can pay to its owners, use to pay down debt, or spend acquiring other businesses, without borrowing additional money.
The free cash flow yield definition is intentionally similar to a bond yield, and that similarity is the whole point. A 5% yield means that for every $100 of share price you are buying $5 of annual free cash. Whether that is generous or not depends on the alternatives.
Why a High FCF Yield Signals Self-Sufficiency
A company that generates high free cash flow has options, whereas a company that does not generate such cash flow lacks options.
Self-sufficiency is exactly that. A company that relies solely on its cash flows does not require any additional financing.
This company does not issue stocks (diluting your position) and it does not have to borrow money.
During times of tightening of credit conditions and weakening of markets, such a company will be able to survive by using its cash flow generated by its own operations.
In case, the firm does not generate sufficient cash flow, then it will be forced to return to the market under the circumstances available to it at that time, which will be the most unfriendly precisely at that time.
That is why cash-generating firms often trade at higher multiples. That is also why a high FCF yield is intriguing but not always good: a relatively low multiple of cash indicates the market's expectation of decreasing cash flows.
The Free Cash Flow Yield Formula
There are two possible formulas describing the same thing, and both are used in practice.
Per share: FCF Yield = Free cash flow per share divided by the share price.
For the whole company: FCF Yield = Free cash flow divided by market capitalization.
Both methods provide the same result, so use whichever you have at hand. Learning how to calculate free cash flow yield therefore boils down to calculating free cash flow, which is not a reported financial number.
Calculate it from the cash flow statement: subtract the purchase of property and equipment from the net cash provided by operating activities. This subtraction is the core of the fcf yield formula, and in annual reports these two numbers are usually placed very close to each other.
Unlevered vs Levered FCF Yield: Which One Retail Traders Use
This may sound technical, but it's easily settled.
Levered free cash flow is the free cash left after covering the interest payments to lenders. When you divide it by the share price or market capitalization, you get the levered yield, which describes the amount of cash available to shareholders. This is the version we've described above and it's the version that you should use.
Unlevered free cash flow is calculated without regard to financing expenses, meaning that it belongs to both the lenders and the shareholders. It is measured relative to the enterprise value rather than the market capitalization, because enterprise value includes debt.
Analysts prefer the unlevered version for the sake of comparing firms with different levels of debt, because it excludes the effect of how a business is financed. For a retail trader who asks how much cash each share produces, the levered per-share version answers that question using readily available information.
Share CFDs on the platform
Get StartedA Worked Example Using a Stock on Pocket Option
Cisco is one of the share CFDs traded on the platform, and its fiscal year 2026 ended on July 25, 2026, so the full-year figures are publicly available.
Input | Figure |
|---|---|
Net cash from operating activities, FY2026 | $14,177 million |
Purchases of property and equipment | $1,410 million |
Free cash flow | $12,767 million |
Shares outstanding | 3.94 billion |
Share price, close 7 October 2026 | $117.39 |
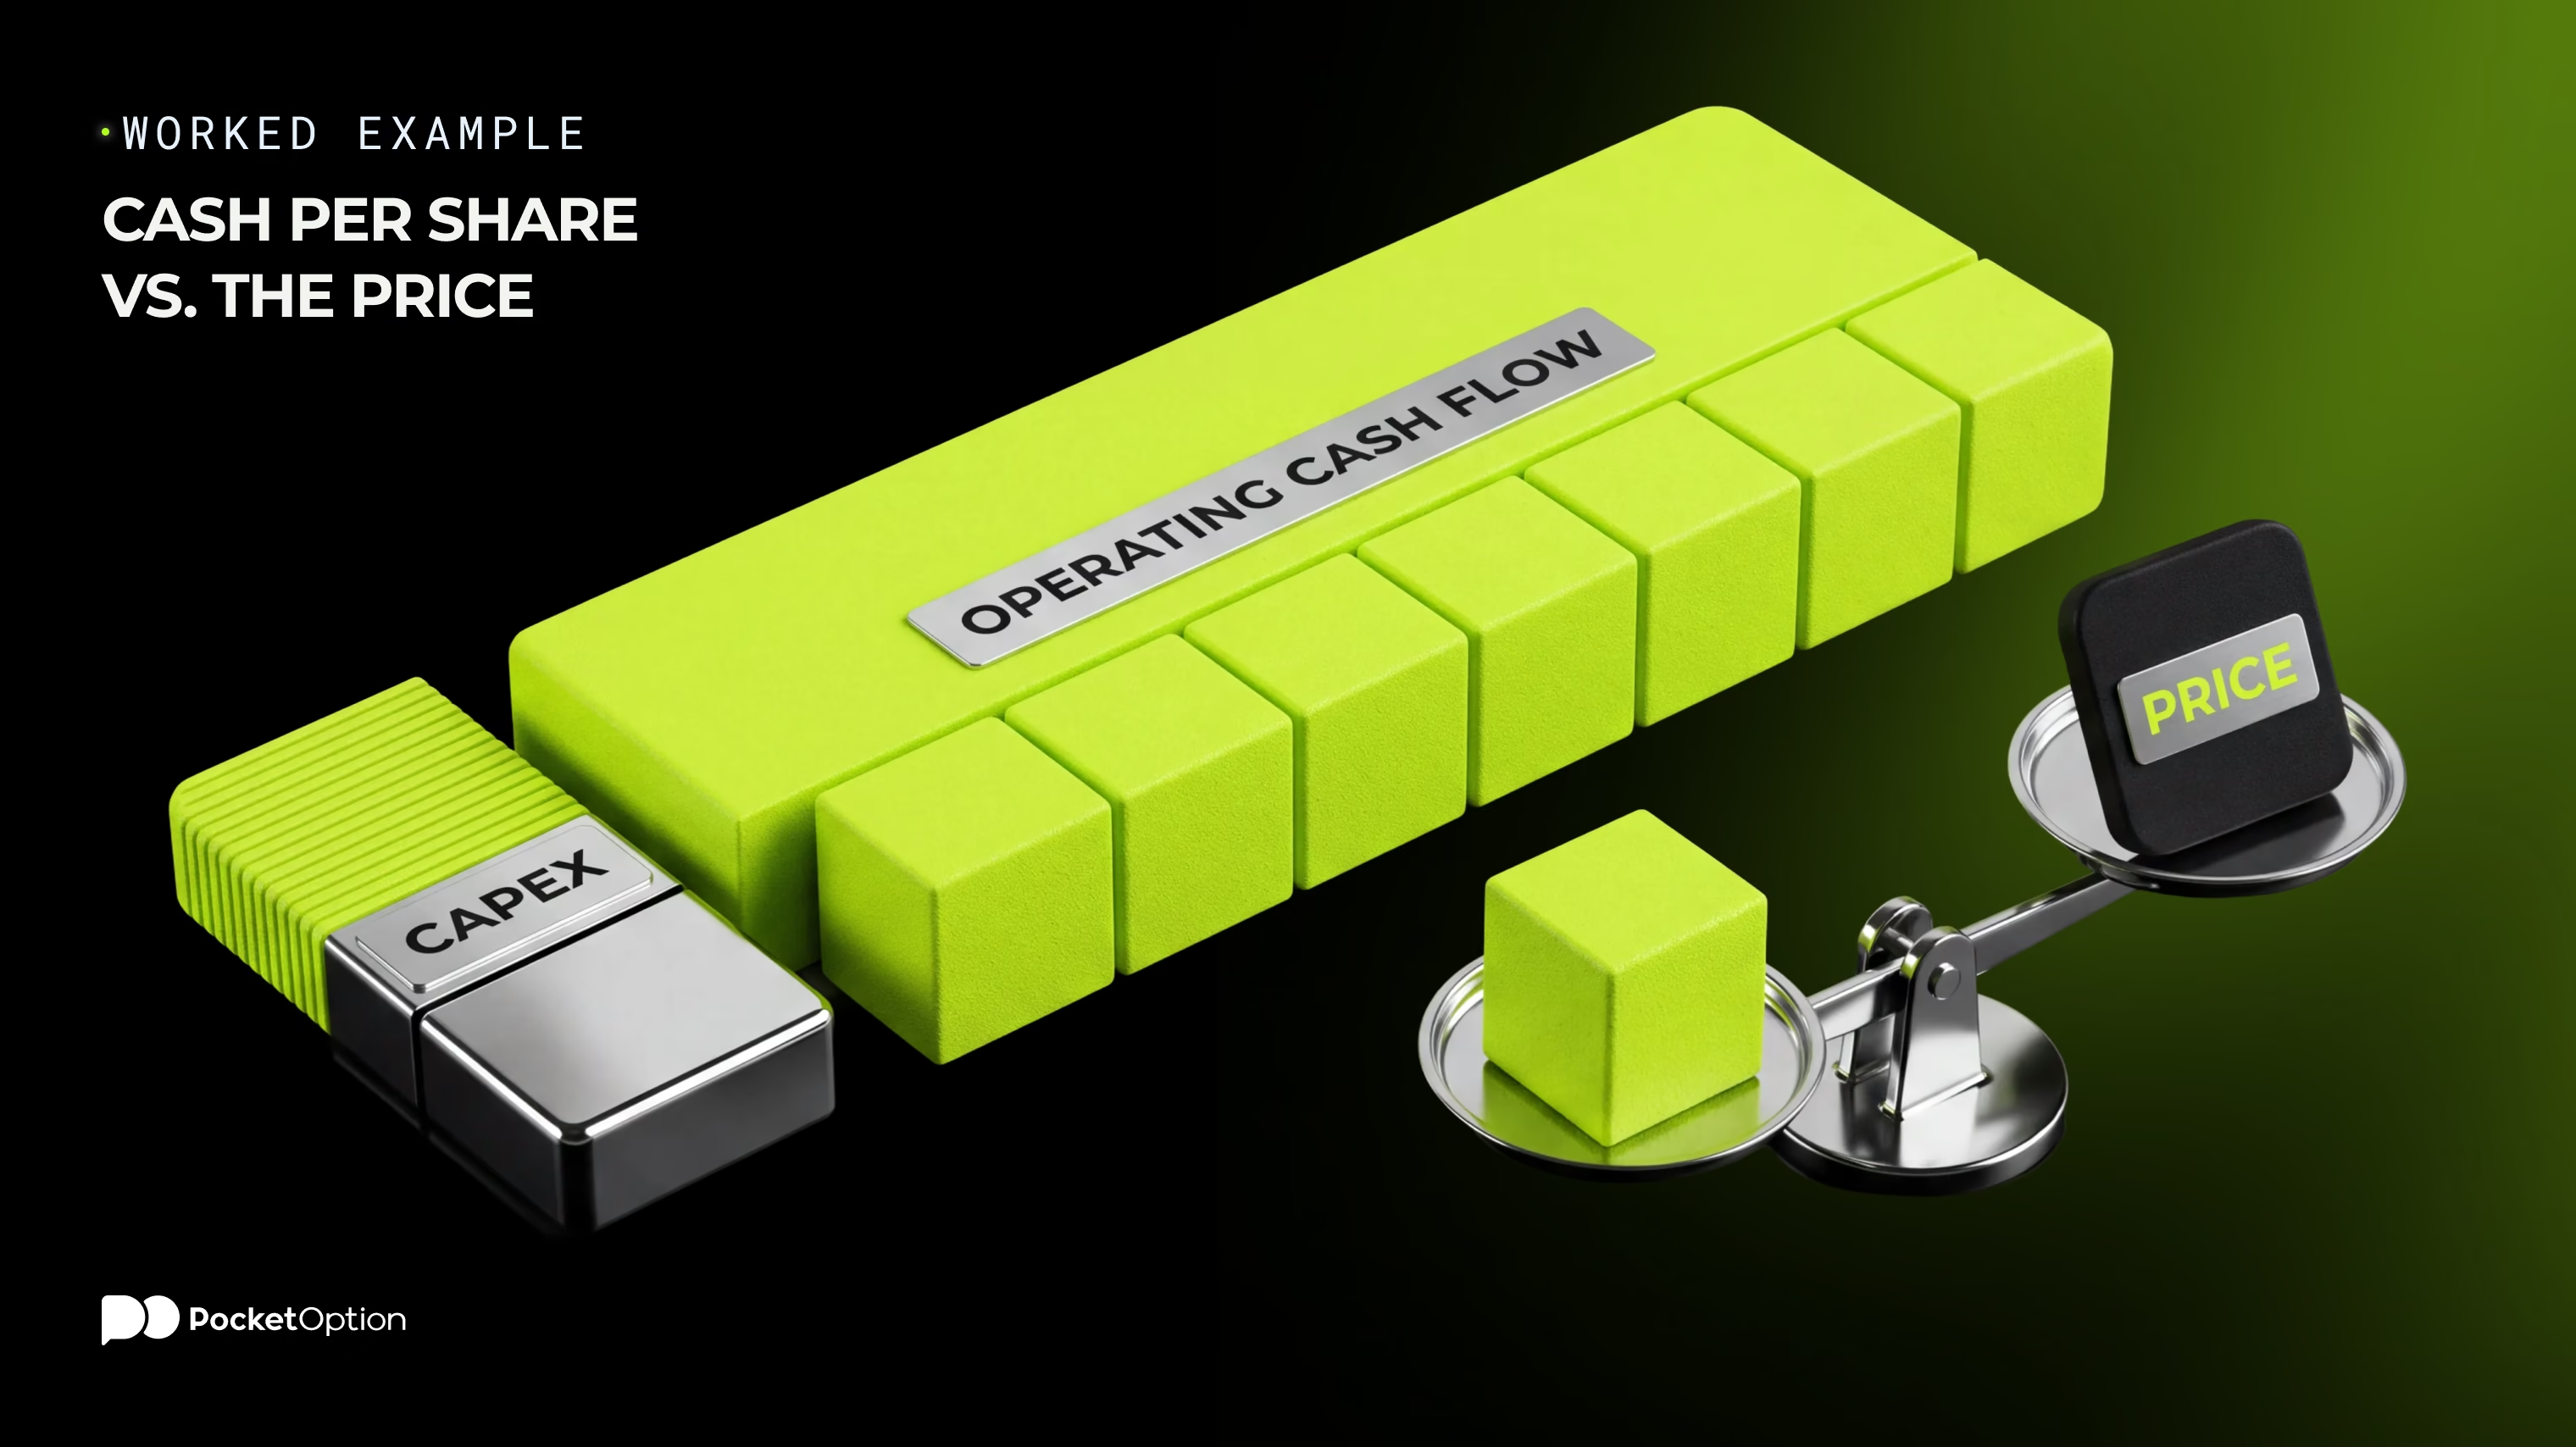
Do the free cash flow yield calculation in two steps. First, let's estimate free cash flow per share: $12,767 million divided by 3.94 billion shares makes $3.24. Then divide that by the price: $3.24 against $117.39 makes 2.76%.
Check it the other way to be sure. Free cash flow of $12,767 million against $463 billion in market capitalization also gives you 2.76%, which confirms the calculation.
One figure in the table above is worth noting: capex is less than 10% of the operating cash flow. Cisco keeps most of the cash generated by its operations, which is what a capital-light business looks like on a cash flow statement. A utility firm or an automaker would consume a far larger share before anything reached free cash flow.
Also notice what fluctuates. Free cash flow is updated quarterly, while the share price is updated every second. That 2.76% was true at one closing price and is already somewhat different. If you don't know how the price side operates, there's a brief explanation of how the stock market works worth reading alongside this.
What Counts as a Good Free Cash Flow Yield
Many people wonder what is a good free cash flow yield, and the question is properly answered by comparison rather than by absolute figures.
Compare it to the government bond yield at the time when you're evaluating the company. Bonds are far less risky than equities, so if your company has a lower yield than the government bond, you're receiving less annual cash in exchange for taking equity risk. That can still be justified if you expect the cash to grow substantially. It is not justified by accident.
As a general rule of thumb, value screens often look for figures above 4% or 5%, and treat anything under about 2% as expensive on this measure. Cisco's 2.76% stands between those two, which suggests the market pays a premium for a business producing cash reliably.
Just remember this: it's a valuation metric, not a quality score. A low figure can mean an excellent company at a full price, while a very high one often indicates an expectation of falling cash flows. Determining which case you're dealing with is the role of fundamental analysis of stocks.
Why the Trend Matters More Than the Single Number
One year of free cash flow tells you very little, as it can be affected by factors that will not repeat.
A deferred capital expenditure program can make a year look abundant with cash, with the spending shifting to the future.
Working capital fluctuations move cash between periods without affecting the business.
The sale of an asset or an unusual settlement can make operating cash flow spike once.
One large project can depress free cash flow in a year when everything is normal.
Use five years of operating cash flow and capex, calculate free cash flow for each year, and observe the direction. Growing free cash flow with a steady yield is quite a different story from the situation where the cash flow stays flat and the yield only rose because the share price has fallen.
The latter is the case to be careful with. A rising yield driven by a falling stock price is not a bargain becoming available; it's a signal that the market disagrees with your view, and you need to know why before considering yourself correct.
Free Cash Flow Yield vs Dividend Yield
Dividend yield shows the amount of money that the company decided to pay you, while free cash flow yield shows how much it could pay you.
The discrepancy between them says a lot. When the free cash flow yield is higher than the dividend yield, it means that the income pays off dividends and leaves something on the side for buybacks, debt repayment, or growth. If the dividend yield is higher than the free cash flow yield or is equal to it, it means that companies pay out more than they produce and cannot do it forever.
It is extremely helpful when it comes to dividend-oriented industries like property trusts whose main purpose is distributing income. Coverage becomes really important here. For those who are just starting, there is a brief guide about REITs and trading related stocks.
Conclusion
Calculate the 5-year average and compare it to the government bonds.
These methods convert free cash flow yield from a metric to an assessment. 5 years will tell if the cash flow is consistent or a one-off event. Bond comparison will tell if the company is generating sufficient cash per share in order to compensate the shareholders for the equity risk. The 2.76% that Cisco posted above is neither a buying opportunity nor a red flag, but just means that market pays extra money for dependable cash, with the most important thing being its growth.
Disclaimer: This article is for informational purposes only and does not constitute any investment advice. An example of the company presented in this article is illustrative in nature. Numbers mentioned in this article were taken from published reports as of the specified date and are subject to change. Yield depends on the stock price, which fluctuates constantly. Trading involves high level of risks and may not be suitable for all investors.
See more:Knowledge baseTrading