
Comprehensive EMA Day Trading Analysis
The exponential moving average remains one of the most adaptable technical indicators for short-term traders who focus on price action analysis.

What is Exponential Moving Average (EMA) and Why Day Traders Use Moving Averages
The Exponential Moving Average (EMA) is a refined type of moving average that assigns more significance to recent price data compared to the simple moving average (SMA). This technical indicator makes it ideal for day trading, where reaction speed to price action is critical.
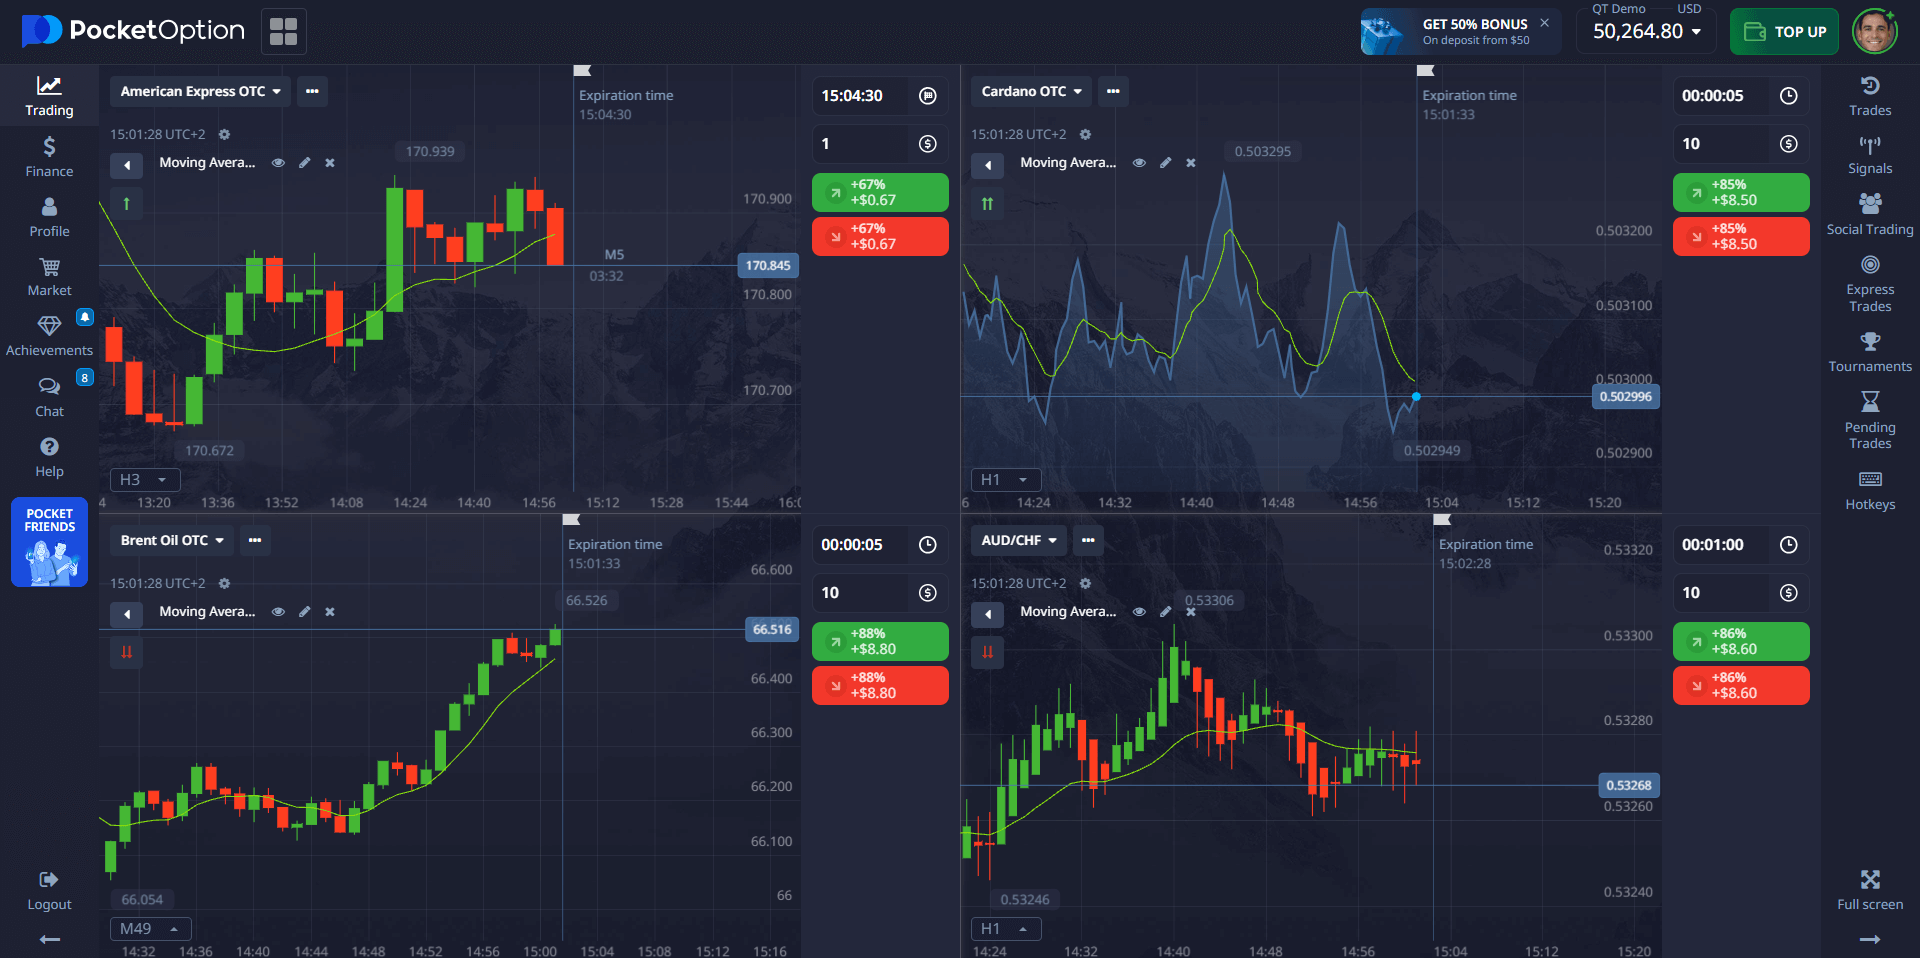
Day traders use moving averages, particularly EMAs, to:
- Identify market trends and price movement direction
- Determine entry and exit points with precision
- Filter out market noise and focus on significant price moves
- Establish support and resistance levels dynamically
- Generate buy and sell signals through crossover strategies
Unlike SMAs, exponential moving averages better reflect real-time price changes, allowing traders to respond more quickly to rapid market trends. This reduced lag makes EMA a superior lagging indicator for active trading strategies.
💬 "In fast-moving markets, a properly tuned EMA gives you a visual edge in spotting trend exhaustion before the price flips. It's not predictive—but it's anticipatory."
Dr. Leo Andersen, Quantitative Analyst, Tokyo Asset Group
Best EMA Settings and Moving Averages Configuration for Day Trading
There's no universal standard for what EMA to use for day trading, but experienced traders consistently return to proven moving averages combinations across different time frames.
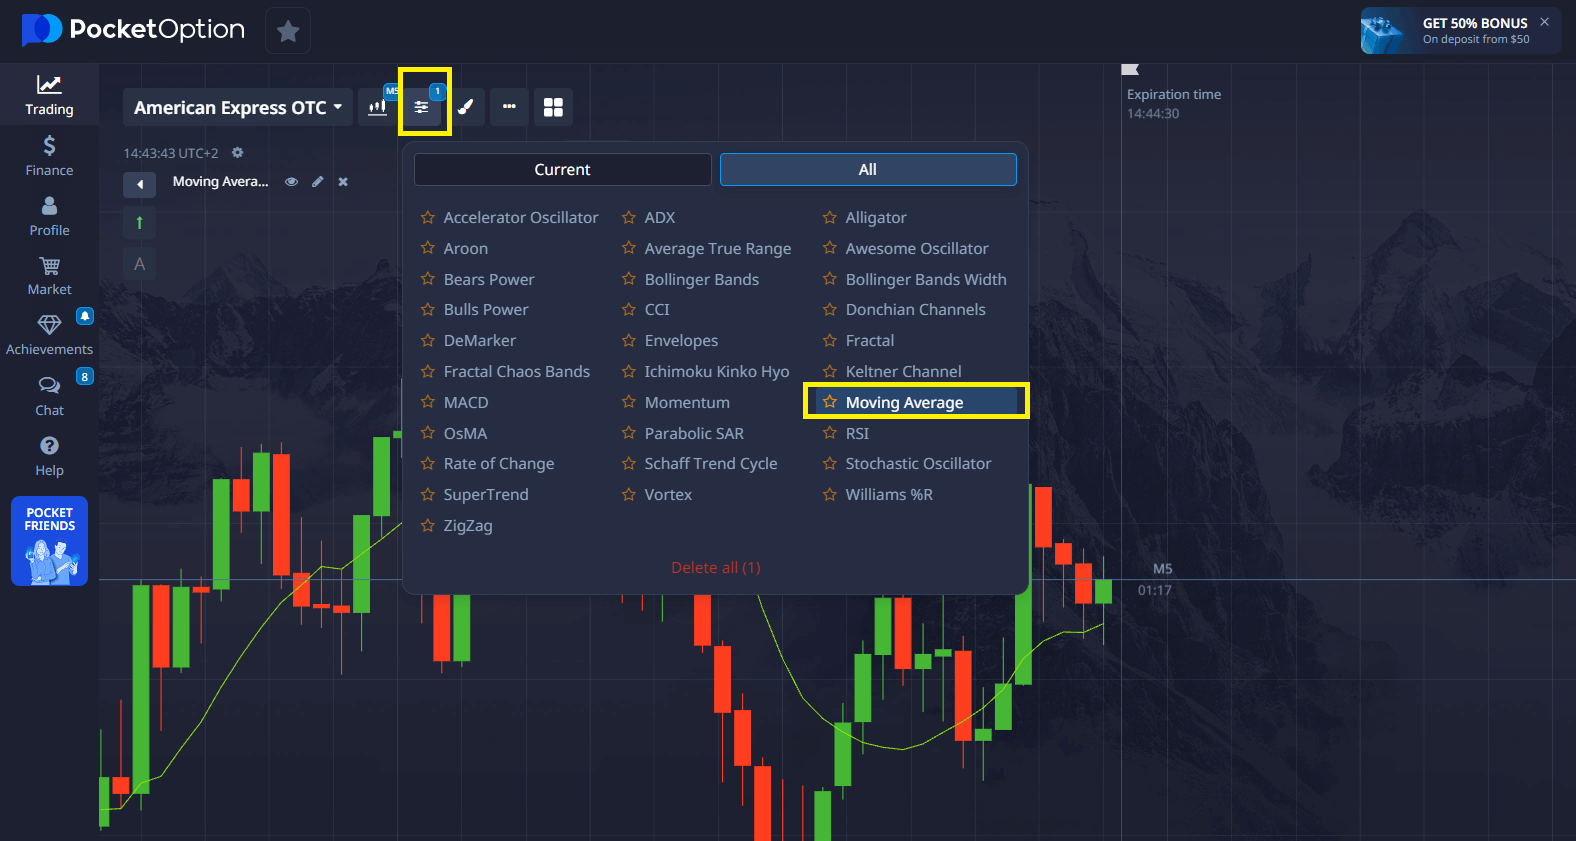
💡 Insight 1: Trend intensity matters more than crossovers. A sharp angle on a 21 EMA often provides more reliable signals than simple crossover patterns.
Common EMA Settings for Different Trading Strategies
| EMA Length | Use Case | Time Frames | Trading Style |
|---|---|---|---|
| 9 EMA | Fast momentum detection for scalping | 1m–5m charts | Scalping, rapid entry/exit |
| 21 EMA | Short-term trend confirmation | 5m–15m charts | Intraday swing trading |
| 50 EMA | Directional bias filter, dynamic support/resistance | 15m–1h charts | Position filtering |
| 200 EMA | Long-term trend filter, psychological anchor | All time frames | Trend alignment |
Expert Perspective on Moving Averages Combinations
📌 "The 9/21 EMA crossover remains a staple because it reflects short-term consensus without overfitting. Pair it with volume analysis and you've got complete price action confirmation."
Hyejin Lee, Market Technician, Quantsense Research
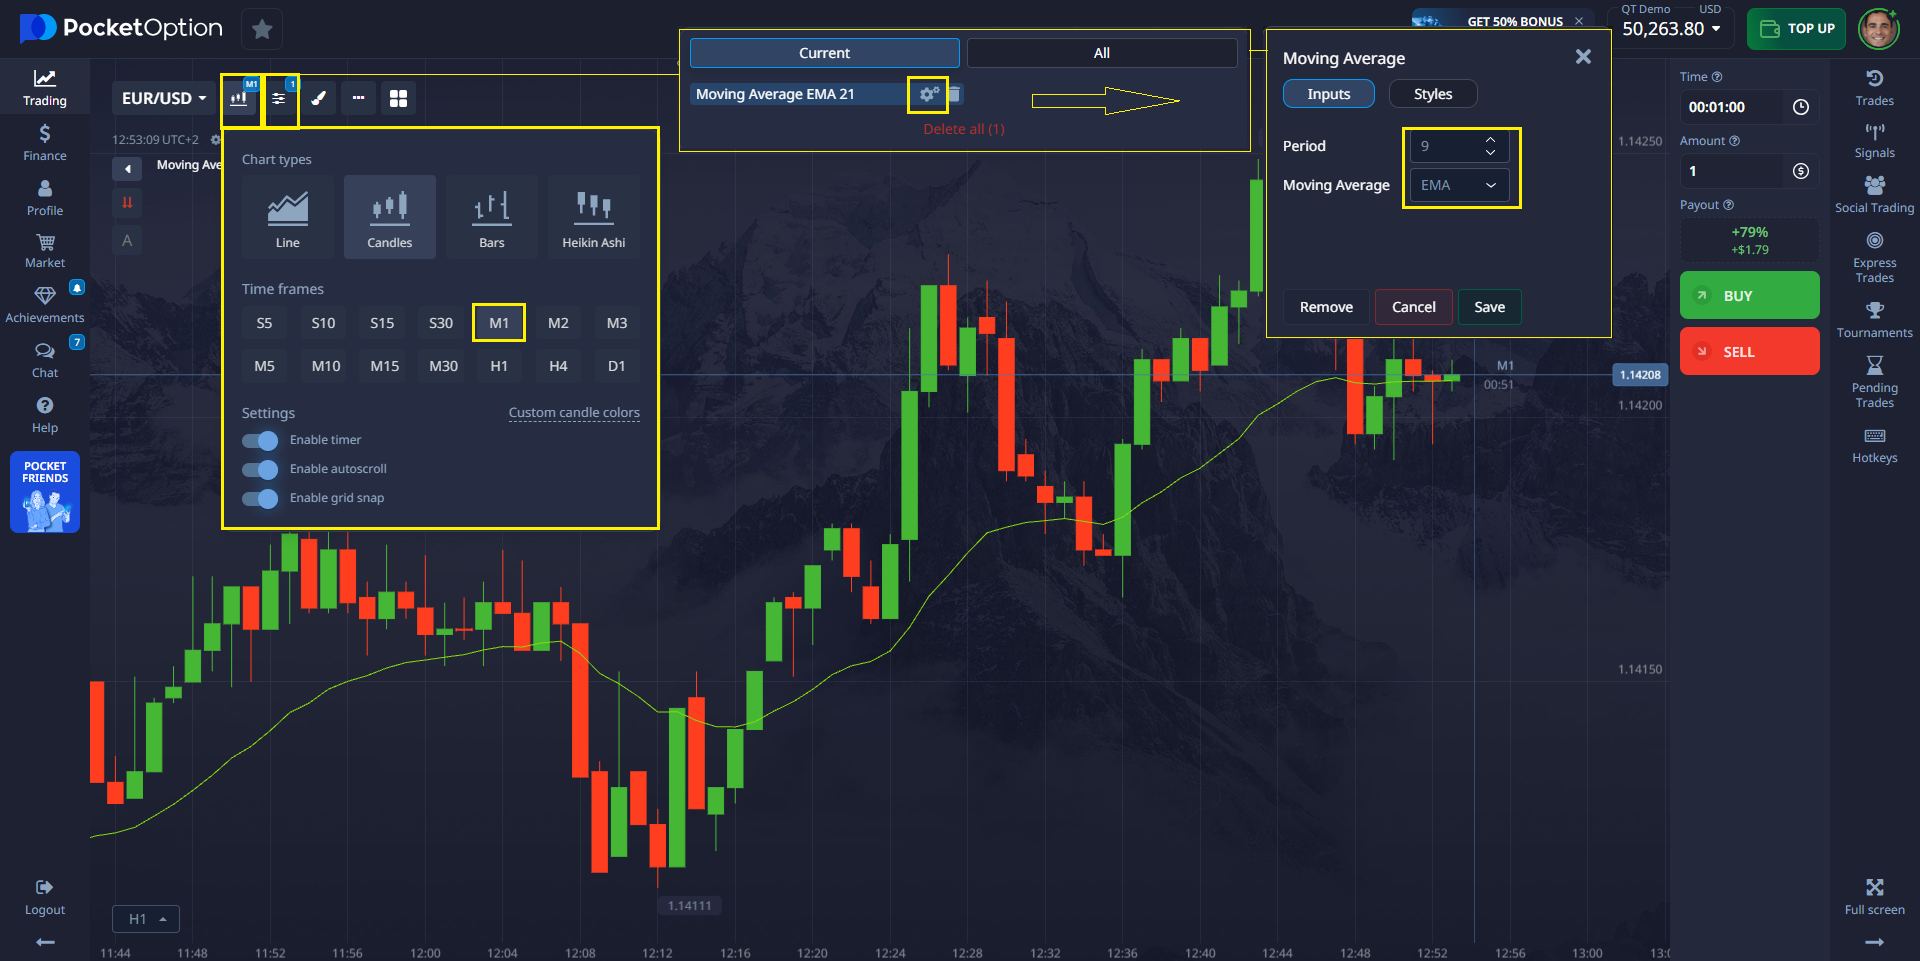
Day trading EMA settings on Pocket Option Platform
Pocket Option provides an intuitive interface where traders can manually configure any moving averages settings. The platform supports all standard exponential moving average configurations for comprehensive technical analysis.
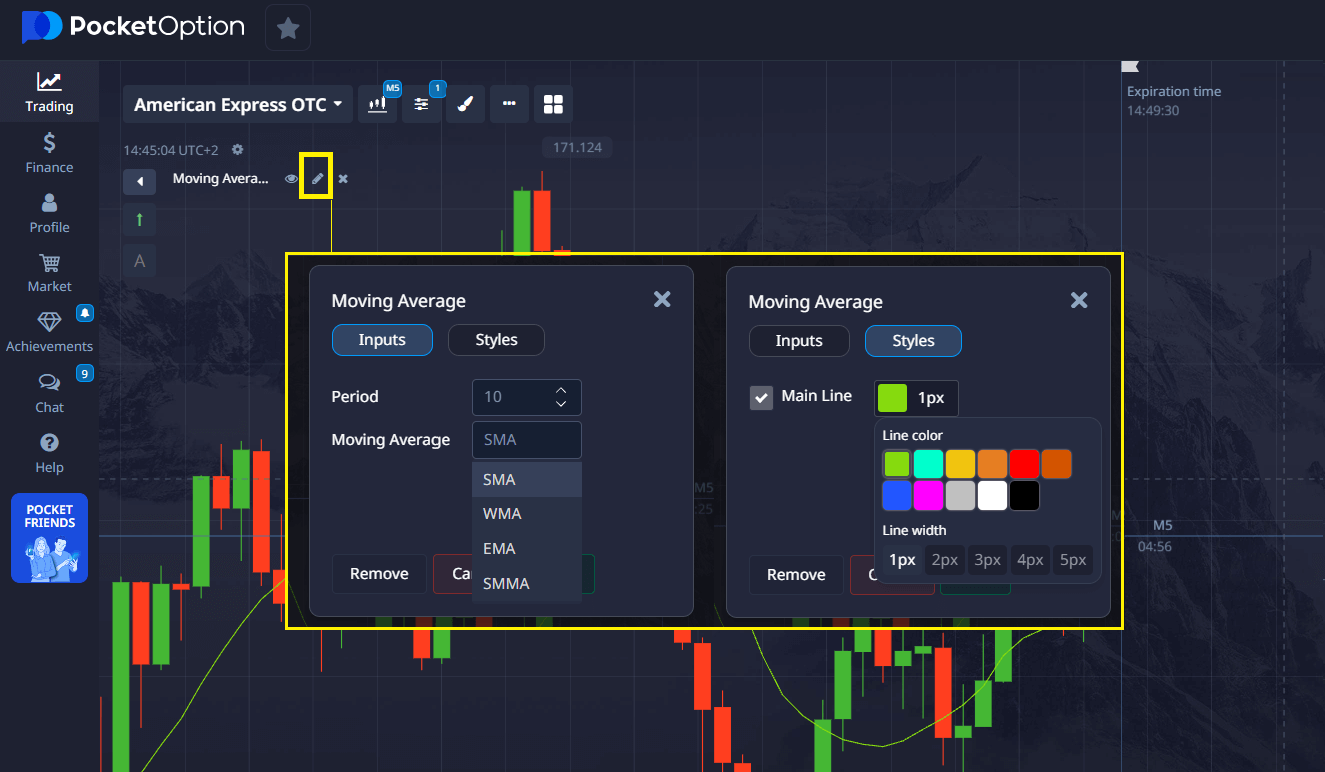
Recommended EMA combinations for different trading approaches:
- 9 EMA + 21 EMA — Perfect for momentum breakouts on 1m–5m time frames, ideal for scalping strategies
- 21 EMA + 50 EMA — Excellent for filtering choppy price action from genuine market trends
- 200 EMA — Essential for avoiding trades that counter the long-term price movement direction
💬 "In Asia-Pacific equity pairs, we noticed that 50 EMA with Bollinger Band constraints leads to lower variance entries. It's subtle but statistically significant."
Marco Alvarez, Systems Developer at TradeSolvers
Benefits and Risks of EMA Day Trading Strategies
Advantages of Using Moving Averages in Day Trading
- Rapid Response: EMAs adjust quickly to new price data, providing timely signals
- Enhanced Timing: Improves precision for entry and exit points identification
- Versatile Application: Works effectively across different asset classes including stocks, forex, and crypto
- Dynamic Support/Resistance: Creates adaptive support and resistance levels based on recent price action
- Trend Confirmation: Helps traders use technical indicators to confirm market trends
💡 Insight 2: Session-specific moving averages work better. Use separate EMA settings for London and New York sessions due to differing volatility characteristics and price moves patterns.
Drawbacks and Risk Management
- Whipsaw Susceptibility: Can generate false signals during sideways price movement
- Context Dependency: May mislead if used without volume confirmation or broader market analysis
- Over-optimization Risk: Requires disciplined backtesting to avoid curve-fitting
- False Breakouts: May trigger premature entries during fake reversals
🧠 "A single technical indicator won't preserve your capital. Real skill lies in combining market structure, fundamental narrative, and mathematical precision. EMAs just help traders identify that structure more clearly."
Enrique V., Full-Time Trader
Real User Experiences: How Traders Use EMA on Pocket Option
- 🔹 "I primarily trade crypto pairs and the 9 EMA keeps me grounded during high volatility periods. Pocket Option ema and charting tools make switching between time frames seamless for my trading strategies." — Natalia P.
- 🔹 "I lost too many trades using 200 EMA on short time frames. After switching to 21/50 combination on Pocket Option's 5-minute charts, I've achieved more consistent entry and exit points." — Luca M.
- 🔹 "Moving averages work when you're disciplined about technical analysis. I backtest every setup with real volume data to avoid emotion-driven decisions. Pocket Option's interface accelerates my testing process." — Kwame J.
EMA vs Other Technical Indicators: Comparative Analysis
| Indicator | Reactivity to Price Changes | Trend Clarity | Suitability for Scalping | Lag Characteristics |
|---|---|---|---|---|
| EMA | High | Medium to High | High | Low lag |
| SMA | Low | Low | Low | High lag |
| VWAP | Medium | High | Medium | Medium lag |
| MACD | Medium | High | Low | Lagging indicator |
🔎 Most day traders prefer exponential moving averages for fast-paced markets due to reduced lag. VWAP may be superior for institutional flow analysis, while MACD suits longer-term swing trading strategies.
💡 Insight 3: Don't chase crossover signals blindly. Wait for complete candle close beyond the fast EMA before executing trades to avoid false breakouts.
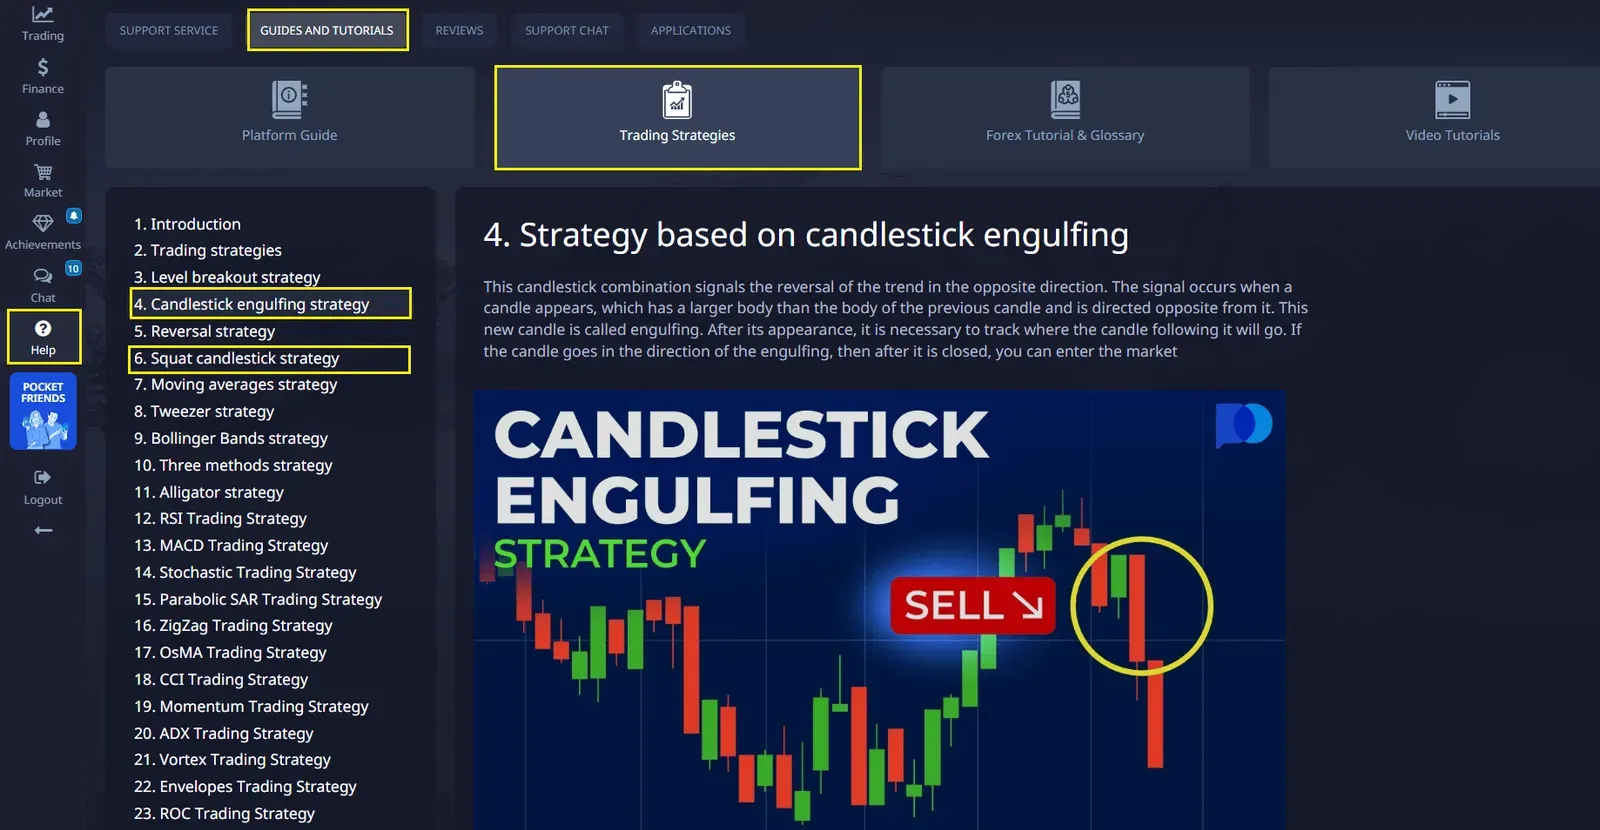
Advanced Moving Averages Strategies for Day Trading Success
Multi-Timeframe EMA Analysis
- 1-minute charts: 9 EMA for immediate price action
- 5-minute charts: 21 EMA for short-term trend confirmation
- 15-minute charts: 50 EMA for broader market context
Volume-Weighted EMA Signals
- Combine exponential moving averages with volume analysis to validate:
- High volume EMA breakouts (stronger signals)
- Low volume crossovers (potential false signals)
- Divergence patterns between volume and price movement
Risk Management with Moving Averages
- Set stop-losses below/above key EMA levels
- Use EMA slopes to gauge trend strength
- Implement position sizing based on EMA volatility
Technical Analysis Best Practices for EMA Day Trading
- Backtesting Requirements: Test all moving averages settings on historical price data
- Market Condition Adaptation: Adjust EMA parameters for trending vs. ranging markets
- Multiple Confirmation: Never rely solely on one technical indicator
- Session Awareness: Consider different volatility patterns across trading sessions
- Documentation: Maintain detailed trading journals for strategy refinement
Conclusion: Mastering EMA for Successful Day Trading
While EMAs don't predict future price movement, they respond effectively to recent price data, providing traders with statistically sound foundations for making entry and exit decisions.
Key Success Factors:
- Combine moving averages with structured risk management
- Conduct thorough backtesting across different market conditions
- Maintain detailed performance tracking and analysis
- Adapt EMA settings to specific assets and time frames
- Never rely exclusively on single technical indicator signals