Trailing P/E vs Forward P/E: What Is the Difference?
The price to earnings ratio comes in two common versions. Trailing P/E uses the profit a company has already earned, while forward P/E uses the profit analysts expect it to earn. Reading forward P/E vs trailing P/E side by side shows how much growth the market is pricing in.

Trailing P/E and Forward P/E in Brief
Both ratios divide the share price by earnings per share (EPS); only the earnings period changes. The P/E ratio formula in each case is:
Trailing P/E = share price ÷ EPS of the past 12 months
Forward P/E = share price ÷ estimated EPS of the next 12 months
The trailing version is often labelled TTM P/E, for trailing twelve months, and it rests on reported figures. Forward earnings are consensus estimates. How the multiple is read in practice is covered in this guide to the P/E ratio in stock analysis, and the same logic applies to both versions.
A Worked Example
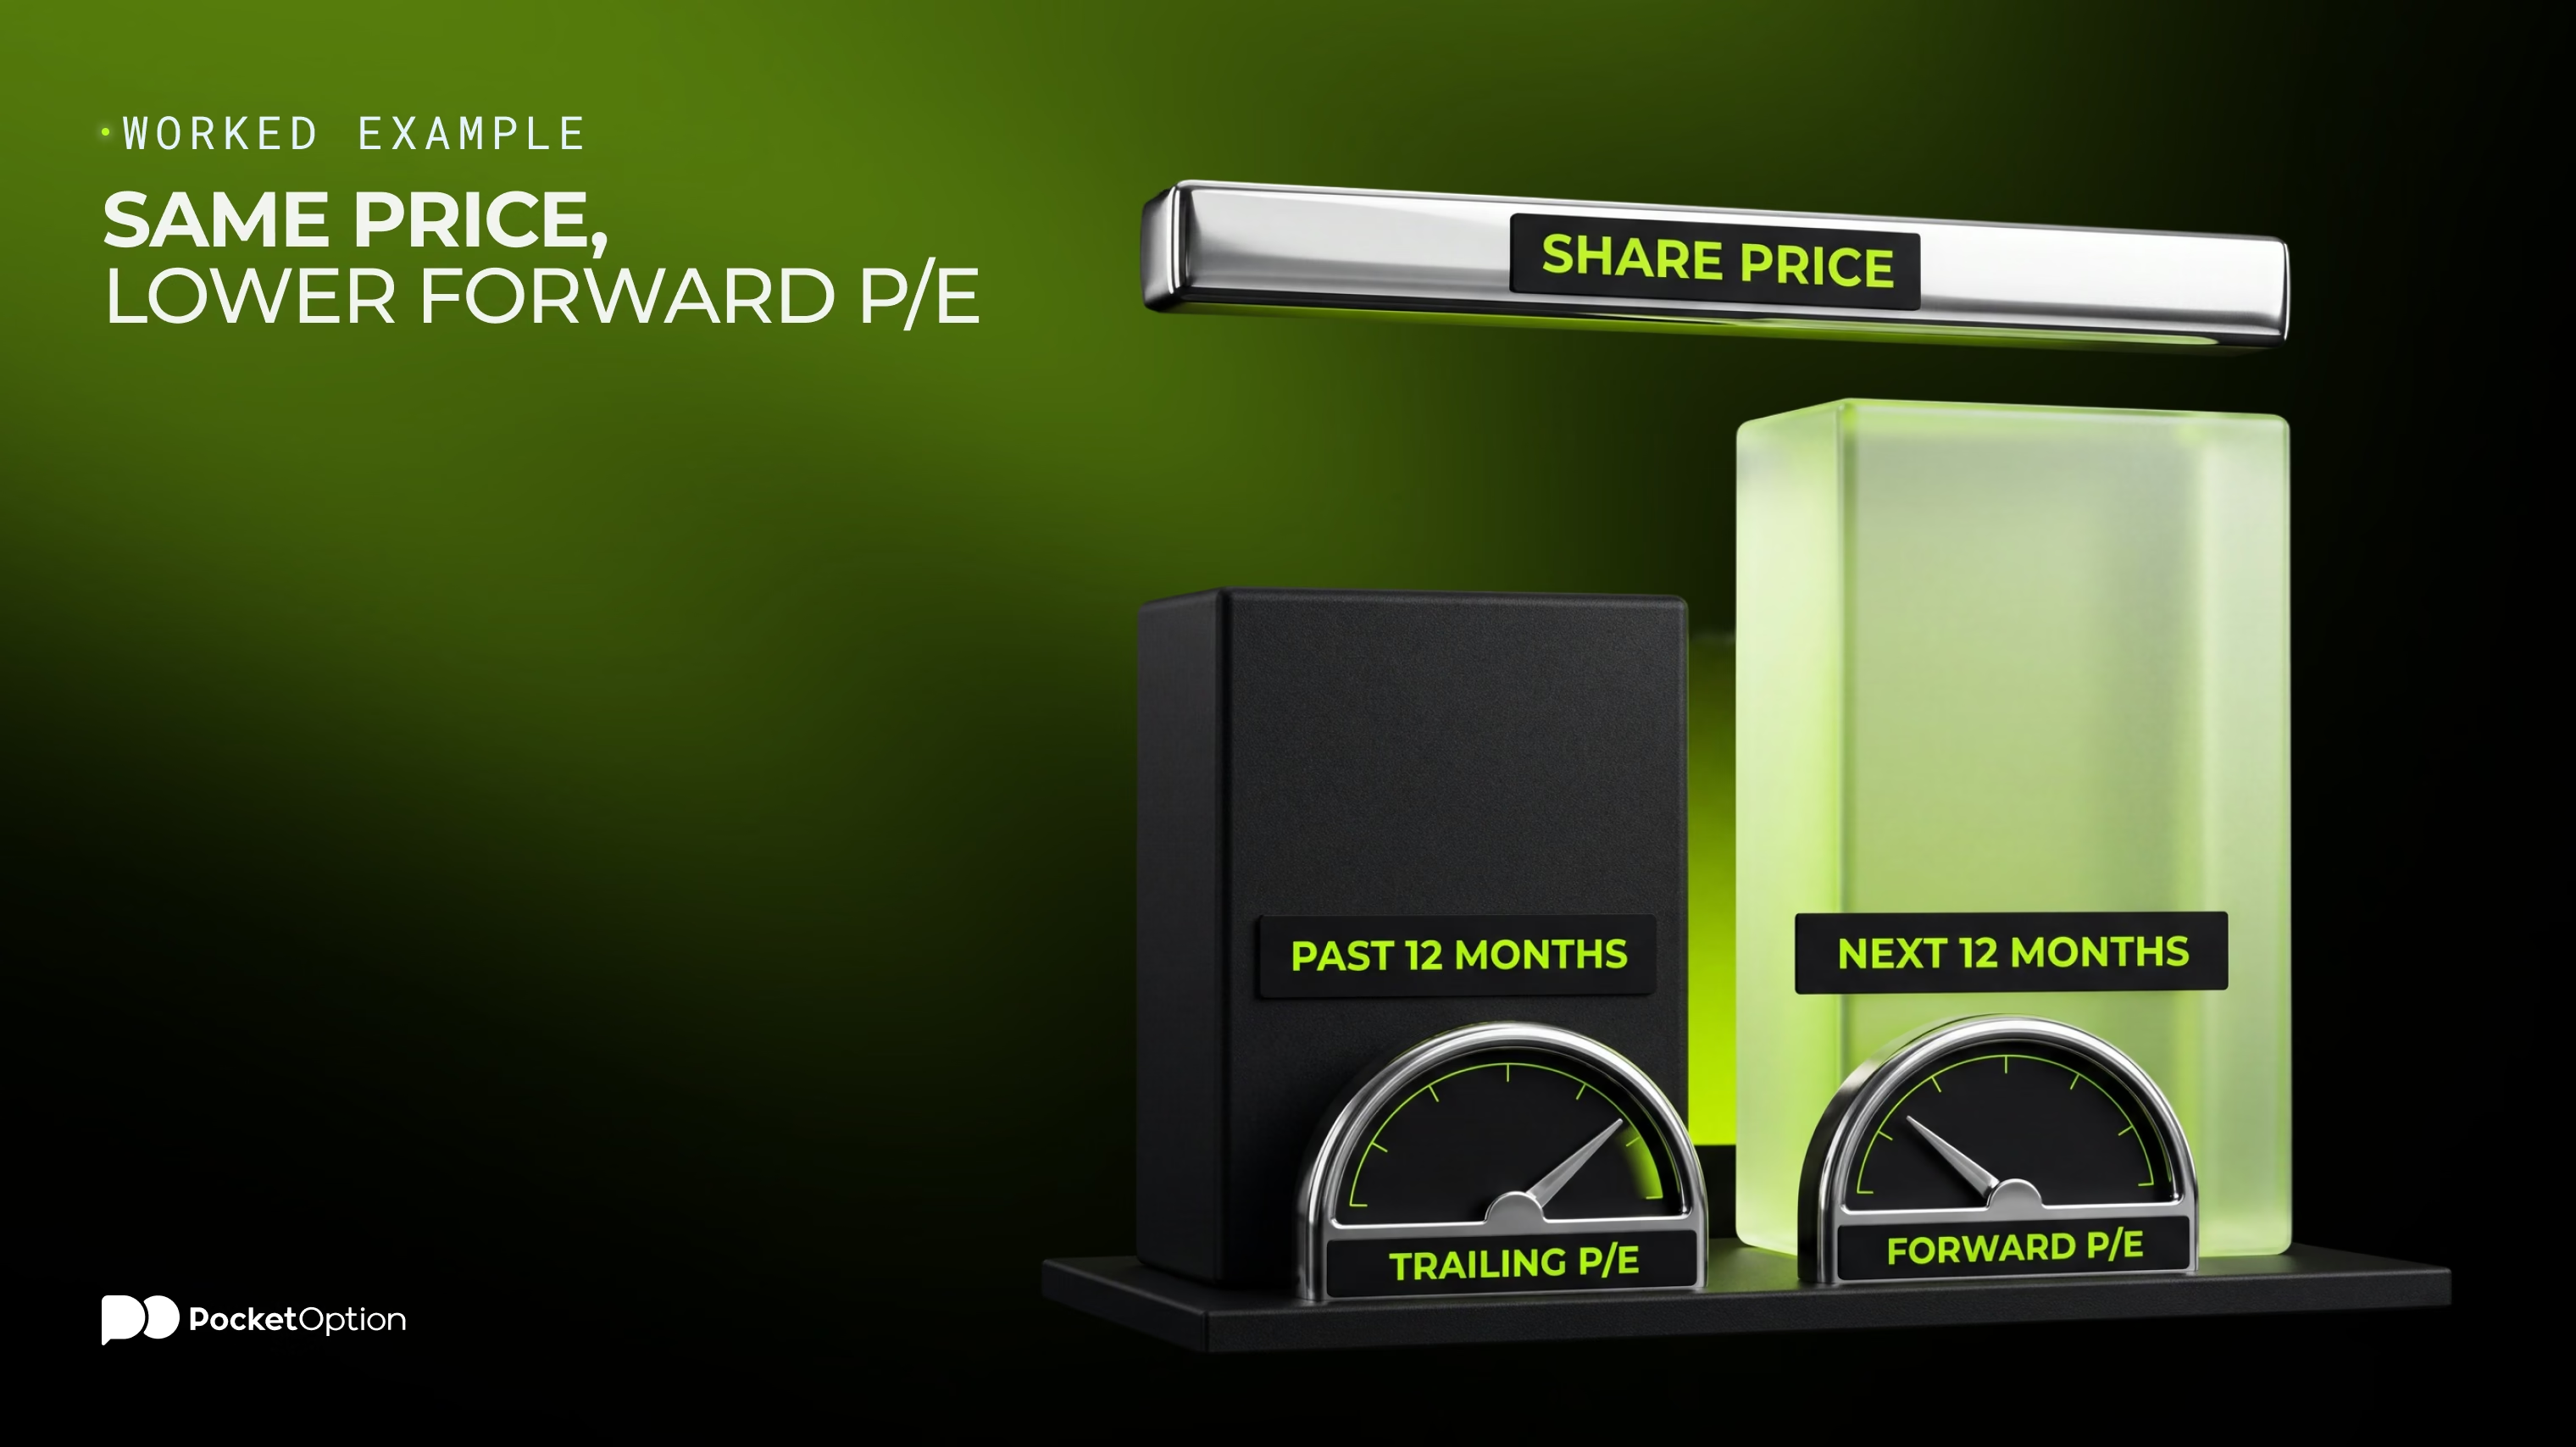
Take a stock trading at $60. Over the past four quarters the company earned $3.00 per share, and analysts expect $4.00 over the next 12 months.
Measure | EPS used | Calculation | Result |
|---|---|---|---|
Trailing P/E | $3.00, past 12 months | 60 ÷ 3.00 | 20 |
Forward P/E | $4.00, next 12 months (estimate) | 60 ÷ 4.00 | 15 |
The same share, at the same moment, looks cheaper on forward earnings because profit is expected to rise by a third.
Key Differences
The forward P/E vs trailing P/E contrast comes down to what each one rests on. Trailing P/E is based on reported results, so the number can be checked, but it looks backward. Forward P/E looks ahead but relies on estimates that can be revised or simply missed. Trailing figures change once a quarter, when a new result replaces the oldest one; forward figures can move whenever analysts update their forecasts.
What the Gap Between the Two Tells You
Dividing one ratio by the other gives the earnings growth that the estimates imply: implied EPS growth = trailing P/E ÷ forward P/E - 1. In the example, 20 ÷ 15 - 1 = 0.333, or about 33%.
A forward P/E below the trailing figure means analysts expect higher earnings, and a forward P/E above it means they expect earnings to fall. The gap describes expectations only. Whether the growth actually arrives is a separate question.
When to Use Each
The question of which P/E is better has no single answer. Trailing P/E suits stable, mature businesses whose profits change little from year to year, since past earnings are a fair guide to the next ones. Forward P/E is more informative for companies whose earnings are changing fast, and the P/E ratio for growth stocks is usually read on forward numbers because trailing profit may be small or recently negative. Reading both, with a grasp of how the stock market works, gives a fuller picture than either one alone.
Limits and Cautions
Trailing P/E can be distorted by one-off items such as an asset sale or a large write-down, which inflate or shrink a single year's profit. Forward P/E depends on analyst estimates, and these differ by data provider, by the number of analysts polled and by whether adjusted or reported earnings are used. Estimates also tend to move after each results date, which is why any stock earnings analysis compares the reported figure with the forecast that came before it. Neither ratio is meaningful when earnings are negative.
Conclusion
Trailing P/E prices a share against profit already earned and forward P/E against profit still expected, so the gap between them shows the growth the market assumes. Check which earnings period and source a quoted ratio uses, strip out one-off items before comparing companies, compare P/E only within the same sector, and treat forward figures as estimates that can be revised.
Start with a demo account.
Get StartedDisclaimer: This article is for informational purposes only and does not constitute financial advice. Trading involves risk, and losses can exceed initial deposits.
See more:Glossary