Mean Reversion Indicators: How to Combine Bollinger Bands, RSI and Moving Averages
Mean reversion trading rests on a simple idea: price that has stretched too far from its average tends to snap back. Combining a few mean reversion indicators into one setup filters out far more false signals than relying on any single tool alone.

What Each Indicator Contributes
Reversion to the mean setups usually lean on three tools, each covering a different part of the decision.
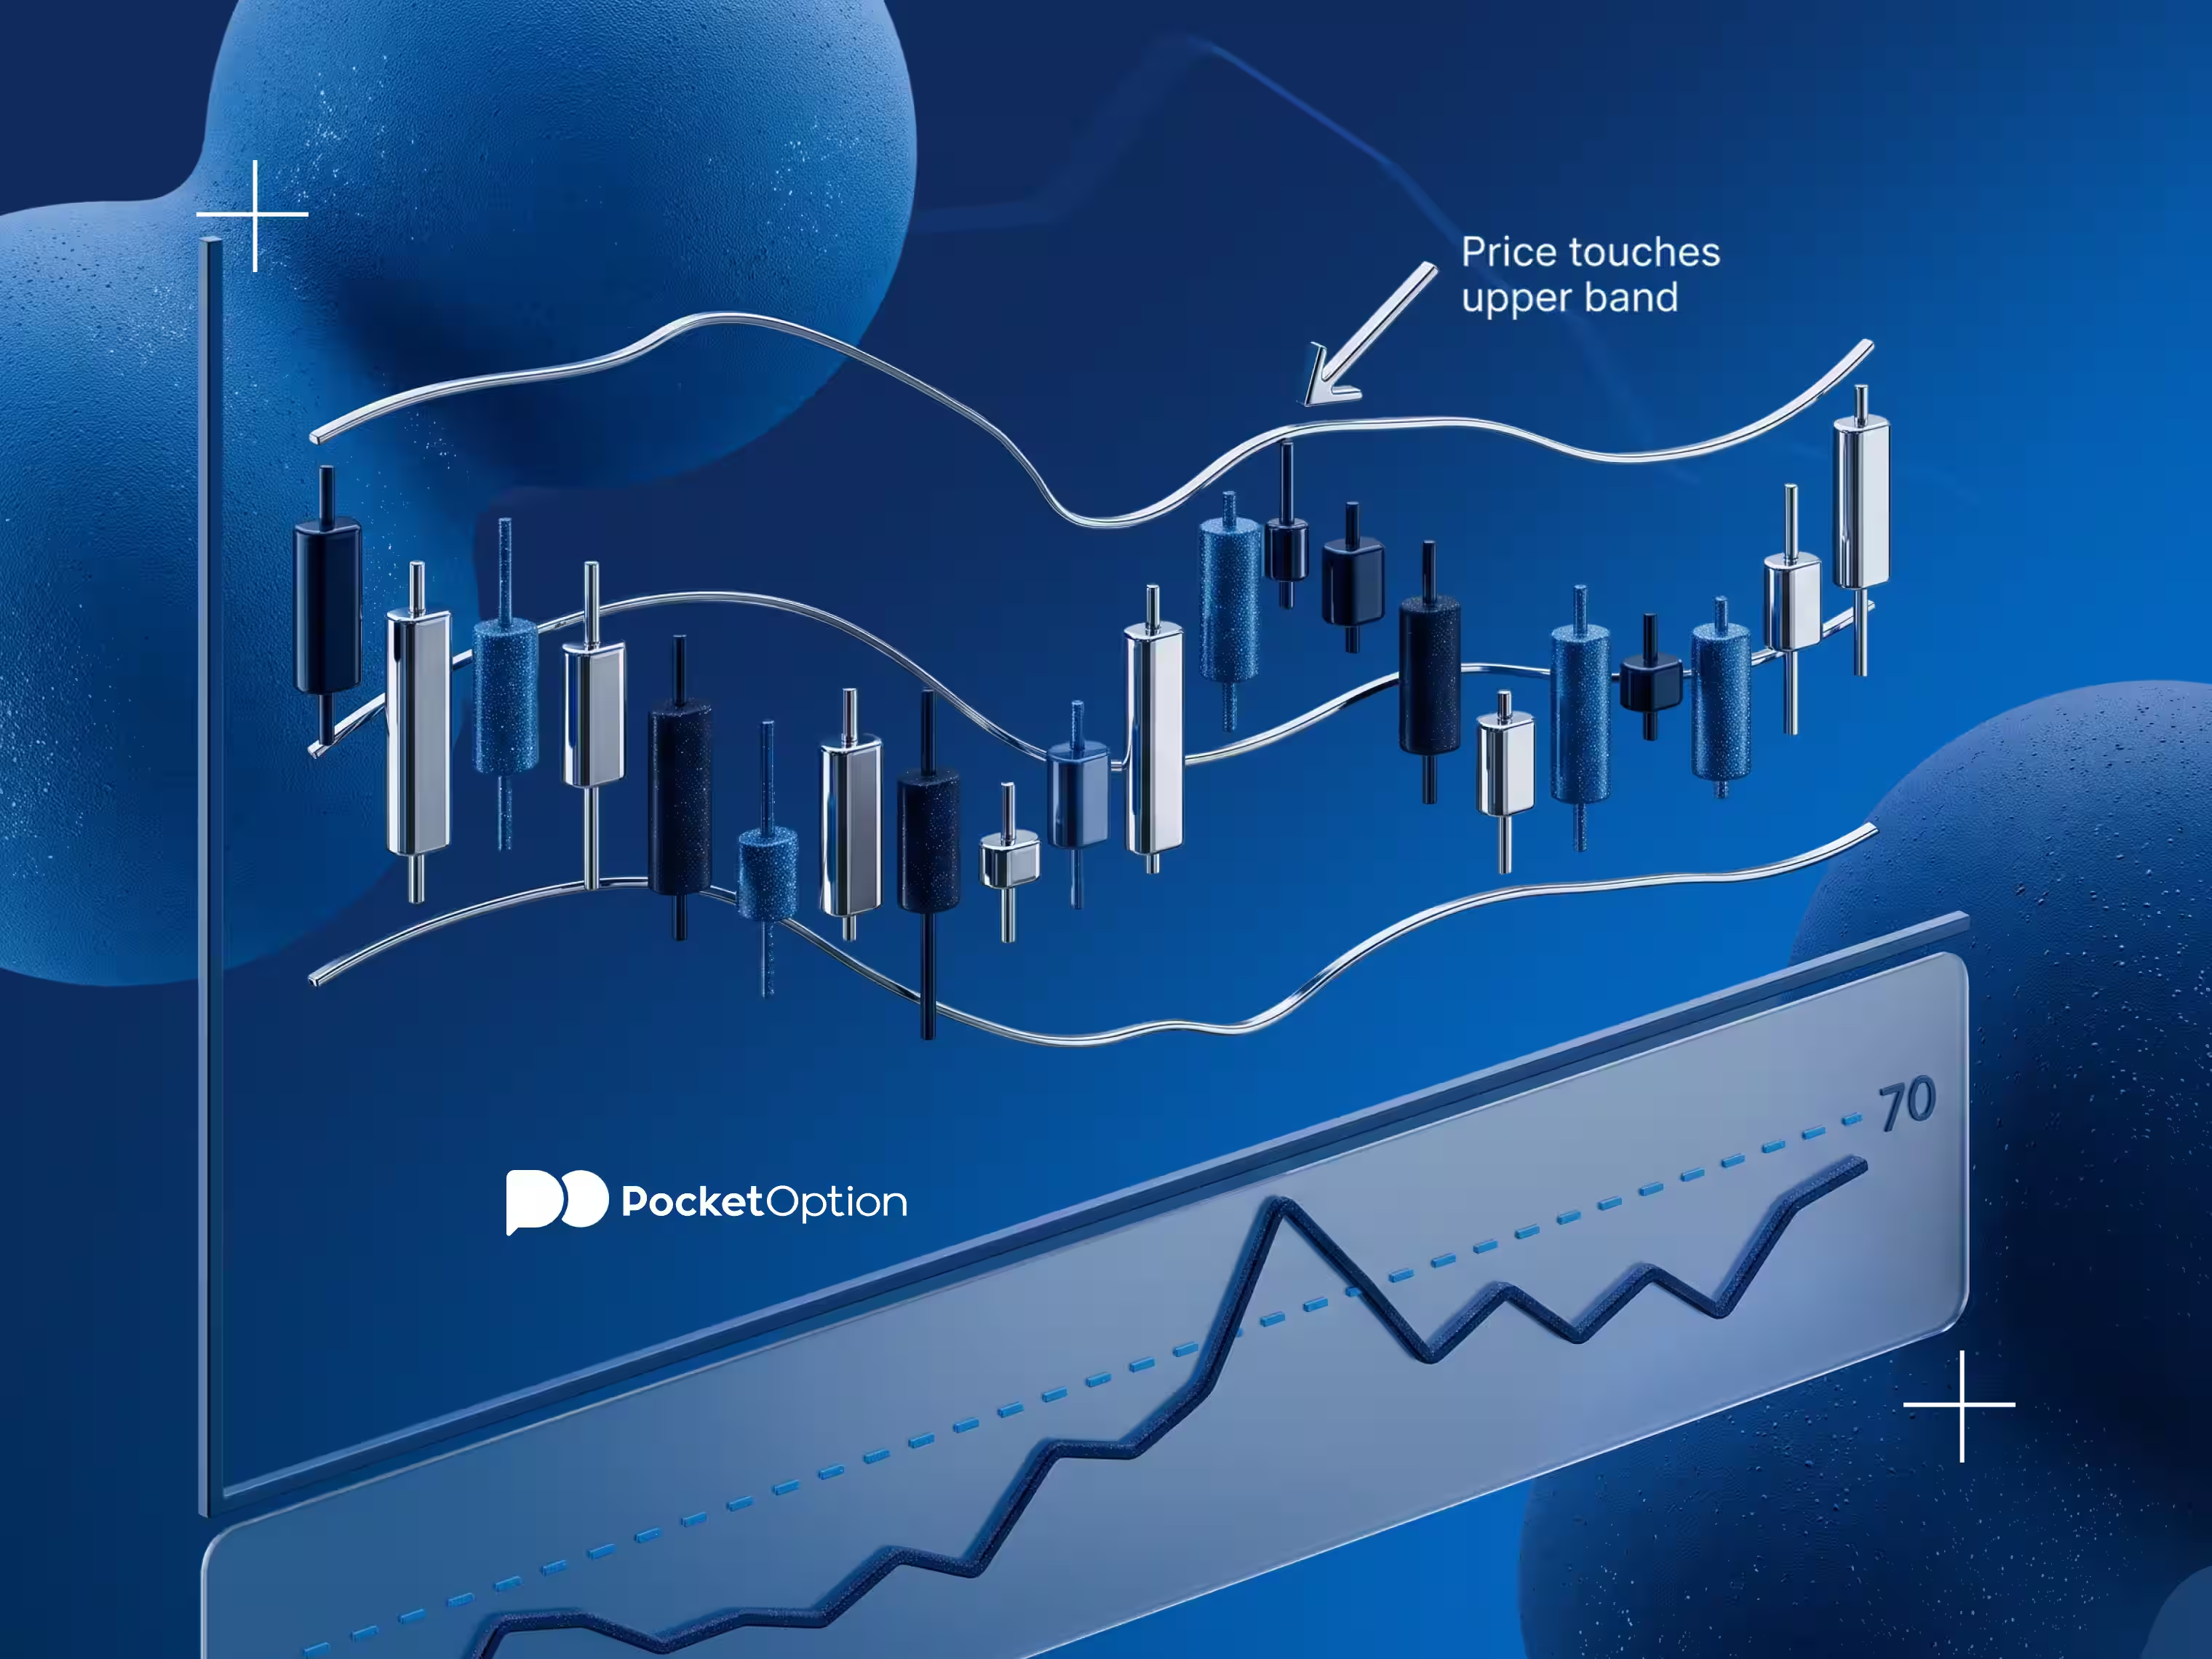
Bollinger Bands: spot price extremes. A touch of the upper or lower band flags a price that has stretched further than its recent volatility typically allows.
RSI: confirms overbought or oversold conditions. A band touch paired with RSI above 70 or below 30 adds independent evidence the move is stretched, not just visually.
Moving average: acts as the reversion target. Price is expected to drift back toward this line, giving the setup a concrete level to aim for.
Why Combining Them Filters Out False Signals
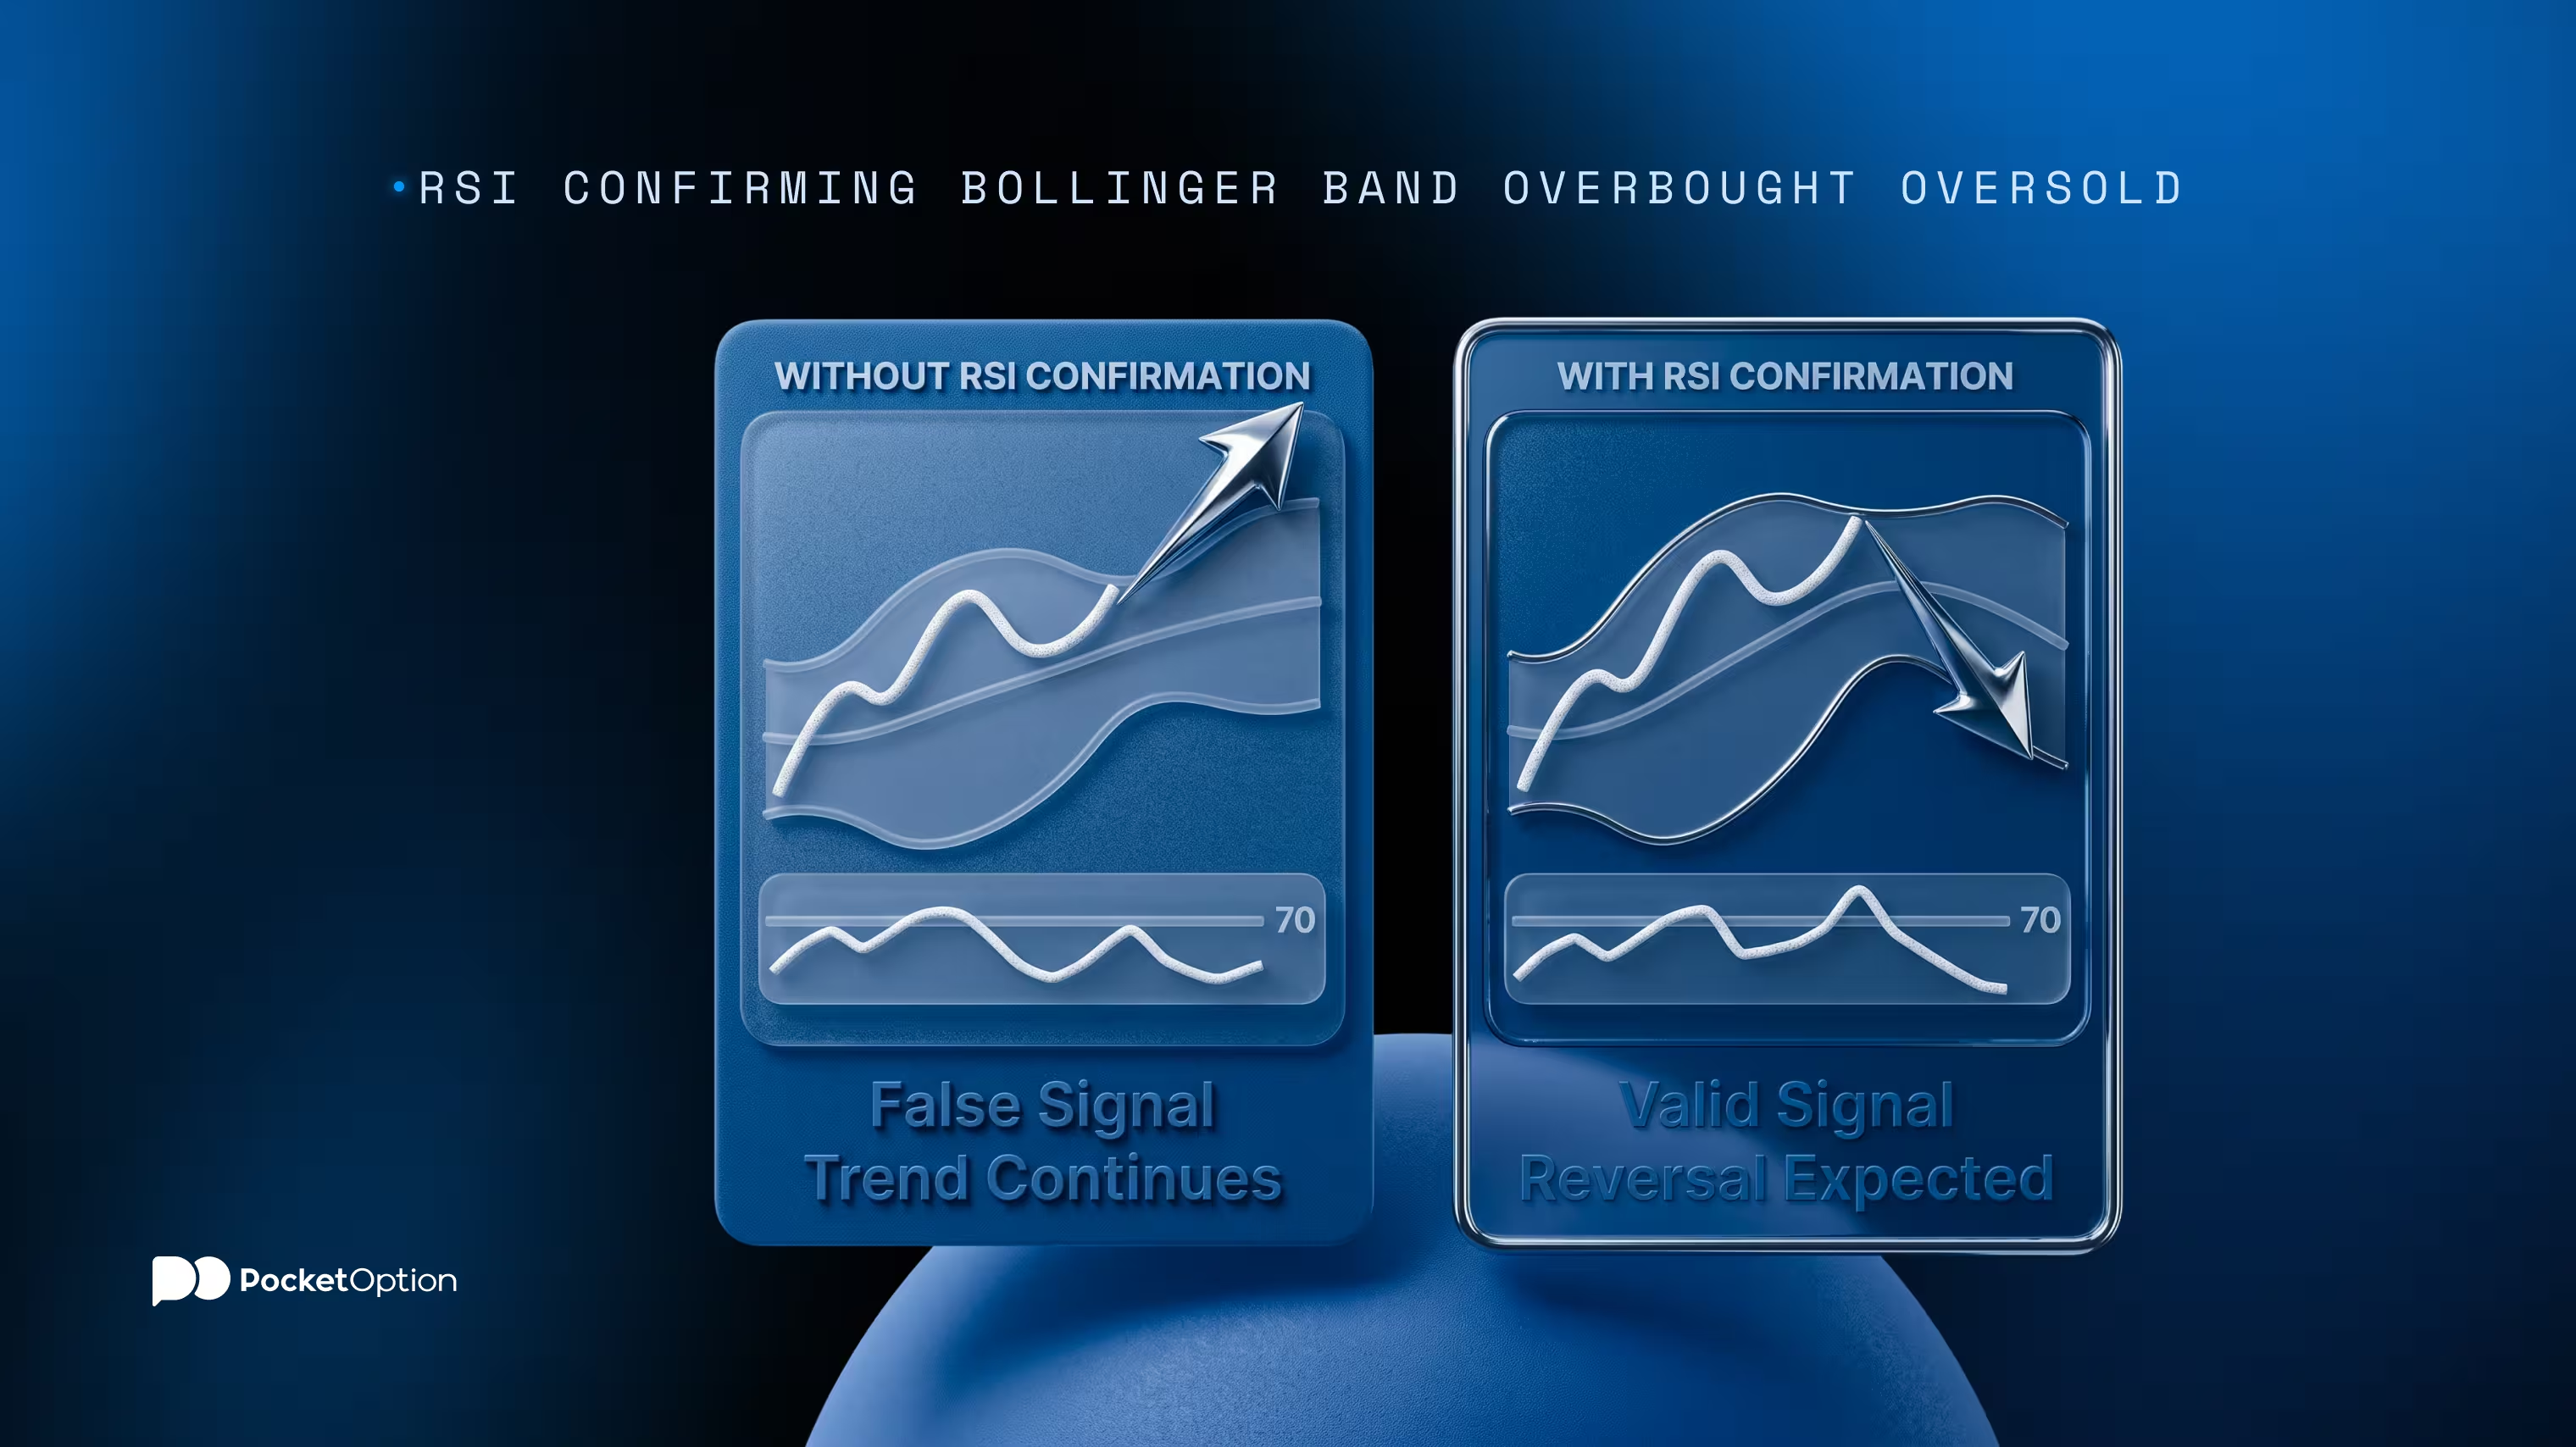
A Bollinger Band touch on its own happens often, and plenty of those touches simply continue rather than reverse. What is mean reversion in trading without confirmation? Mostly guesswork. Requiring RSI to also confirm overbought or oversold conditions cuts out a meaningful share of touches where price is stretched on the chart but momentum hasn't actually weakened yet. Reviewing how Bollinger Bands work makes clear the bands react purely to volatility, which is exactly why a second, momentum-based confirmation matters.
A Simple Combined Entry Setup
Wait for price to touch or pierce the upper or lower Bollinger Band.
Check RSI at the same moment: above 70 for a short near the upper band, below 30 for a long near the lower band.
Confirm the moving average is reasonably close by, not miles away, so the reversion target is realistic.
Enter once both the band touch and the RSI reading align on the same candle or the one right after.
Adjusting the best Bollinger Band settings and RSI settings for swing trading to match the timeframe being traded keeps both tools reacting on a similar rhythm, rather than one lagging the other.
Setting the Exit at the Moving Average
The moving average itself, commonly the same 20-period line used as the middle Bollinger Band, becomes the profit target. Once price reaches it, the reversion this setup was built around has largely played out, and the mean reversion strategies covered here call for closing or trimming the position rather than assuming the move continues to the opposite band. Some traders also reference EMA settings for day trading to fine-tune which moving average length best matches their chosen timeframe.
practice mean reversion trades on Pocket Option
Try DemoThe Main Risk: Strong Trends Override Mean Reversion
This entire approach assumes price is ranging around a stable average. During a genuinely strong trend, price can ride along the upper or lower Bollinger Band for many candles in a row without ever reverting, and RSI can stay overbought or oversold for extended stretches too. Mean reversion indicators are not built to detect this condition themselves; a basic trend filter, such as checking whether price sits clearly above or below a longer moving average, helps avoid fading a strong trend by mistake.
Conclusion
No single mean reversion indicator is reliable enough on its own. Bollinger Bands flag the stretch, RSI confirms it, and the moving average gives the setup a concrete target to aim for. The approach works best in ranging conditions and needs a trend filter to avoid fighting a market that simply keeps moving in one direction.
Disclaimer: Trading involves significant risk of capital loss and may not be suitable for all investors. Past performance does not guarantee future results.
See more:Glossary