Bart Simpson Trading Pattern
In the world of financial markets, traders are always on the lookout for unique patterns that can provide insights into price movements. One such intriguing pattern is the "Bart Simpson trading pattern". This peculiar chart formation has gained attention among traders for its distinctive shape and potential implications for market trends.

Understanding the Bart Simpson Trading Pattern
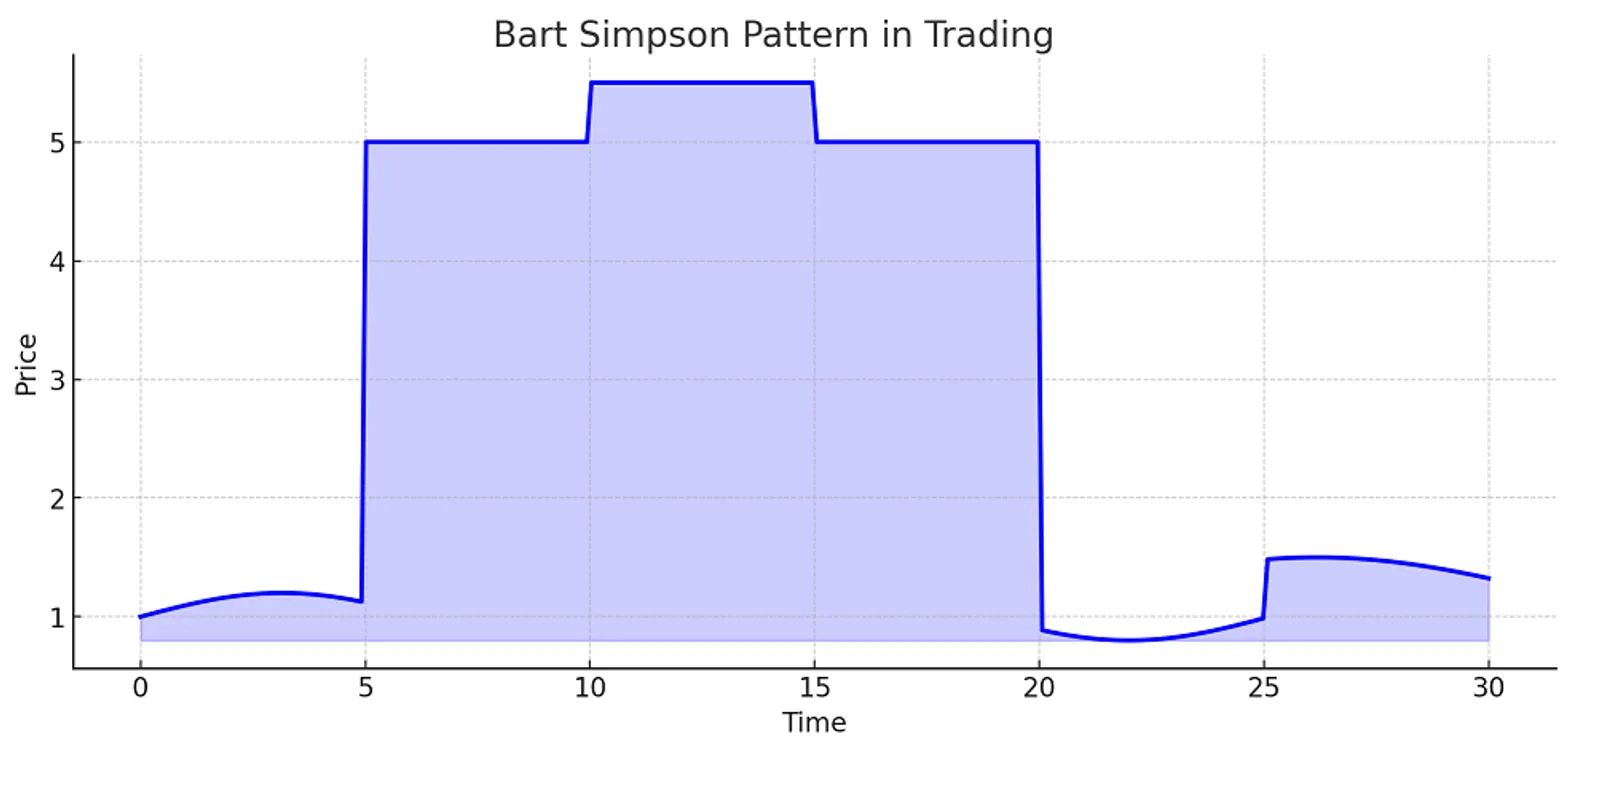
The Bart Simpson trading pattern, named after the iconic cartoon character's hairstyle, is a chart formation that resembles Bart Simpson's head. This pattern is characterized by a sudden price spike followed by a period of sideways movement, and then a sharp decline back to the original price level. The Bart Simpson trading pattern is often observed in cryptocurrency markets but can occur in other financial instruments as well.
Key Components of the Bart Simpson Pattern
- Sudden price spike (Bart's hair)
- Sideways consolidation (Bart's head)
- Sharp decline (Back of Bart's head)
Identifying the Bart Simpson Trading Pattern
Recognizing the Bart Simpson trading pattern requires careful observation of price charts. Traders should look for the following characteristics:
| Component | Description |
|---|---|
| Initial Spike | A sudden, sharp increase in price over a short period |
| Consolidation | A period of sideways price movement with low volatility |
| Sharp Decline | A rapid drop in price, often returning to the pre-spike level |
It's important to note that the Bart Simpson trading pattern can vary in size and duration, but the overall shape remains consistent. Traders should be aware that this pattern can form in both bullish and bearish market conditions.
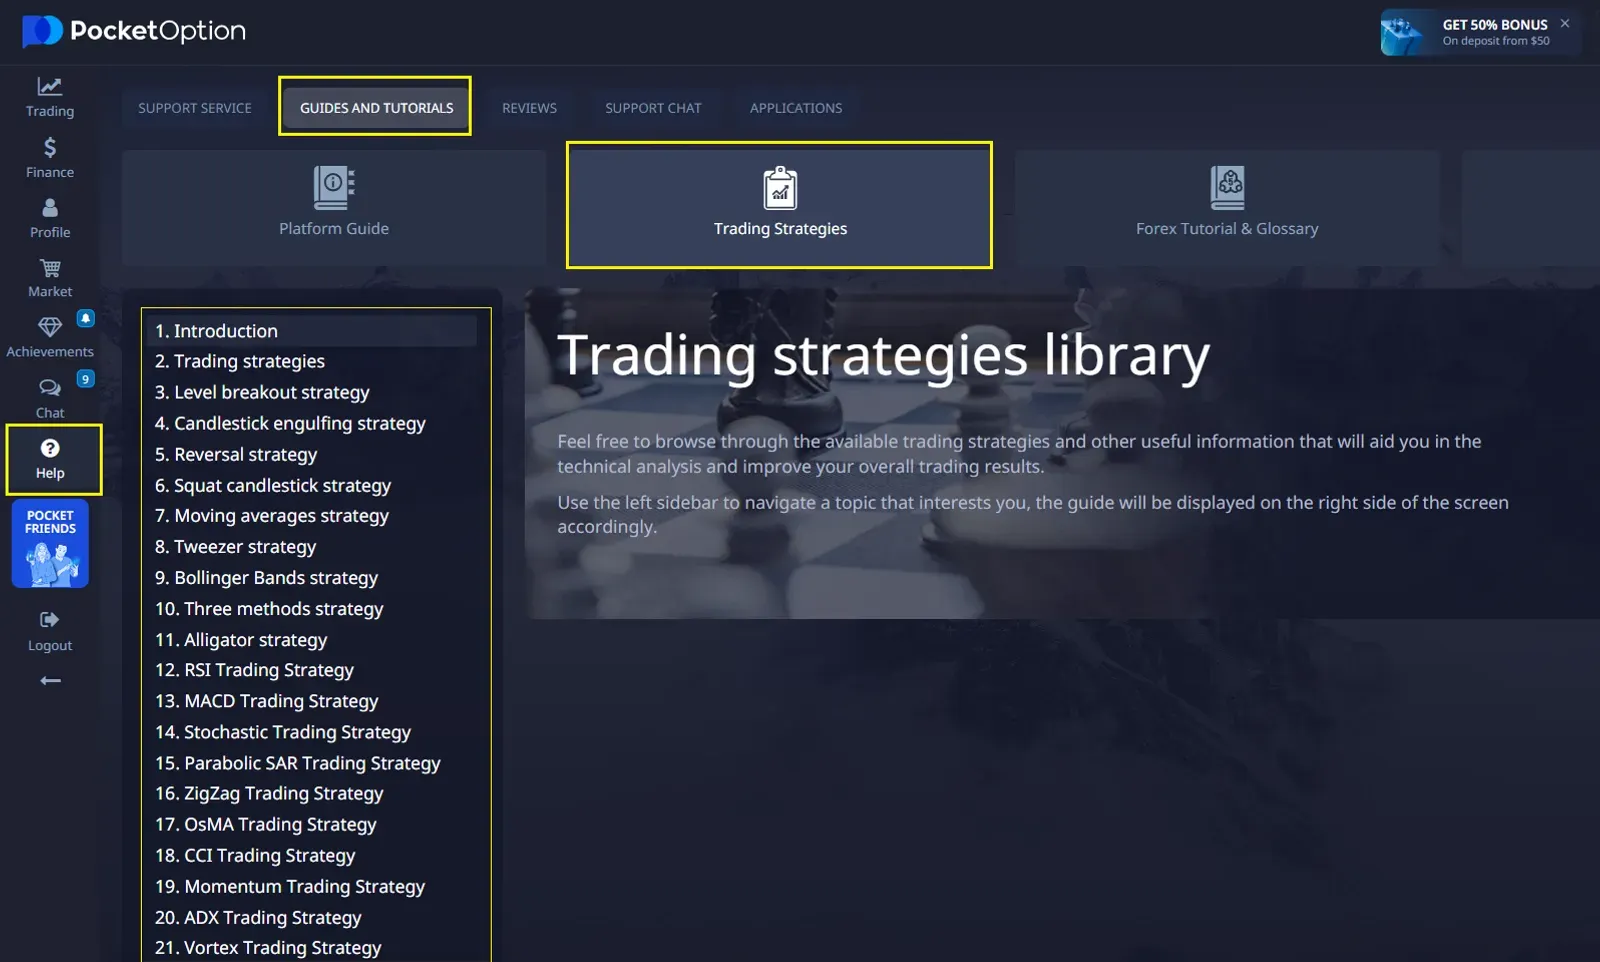
Pocket Option Features
Pocket Option offers a variety of tools and features that can help traders analyze and potentially identify patterns like the Bart Simpson trading pattern. It does offer the following features that can help in recognizing and trading based on patterns:
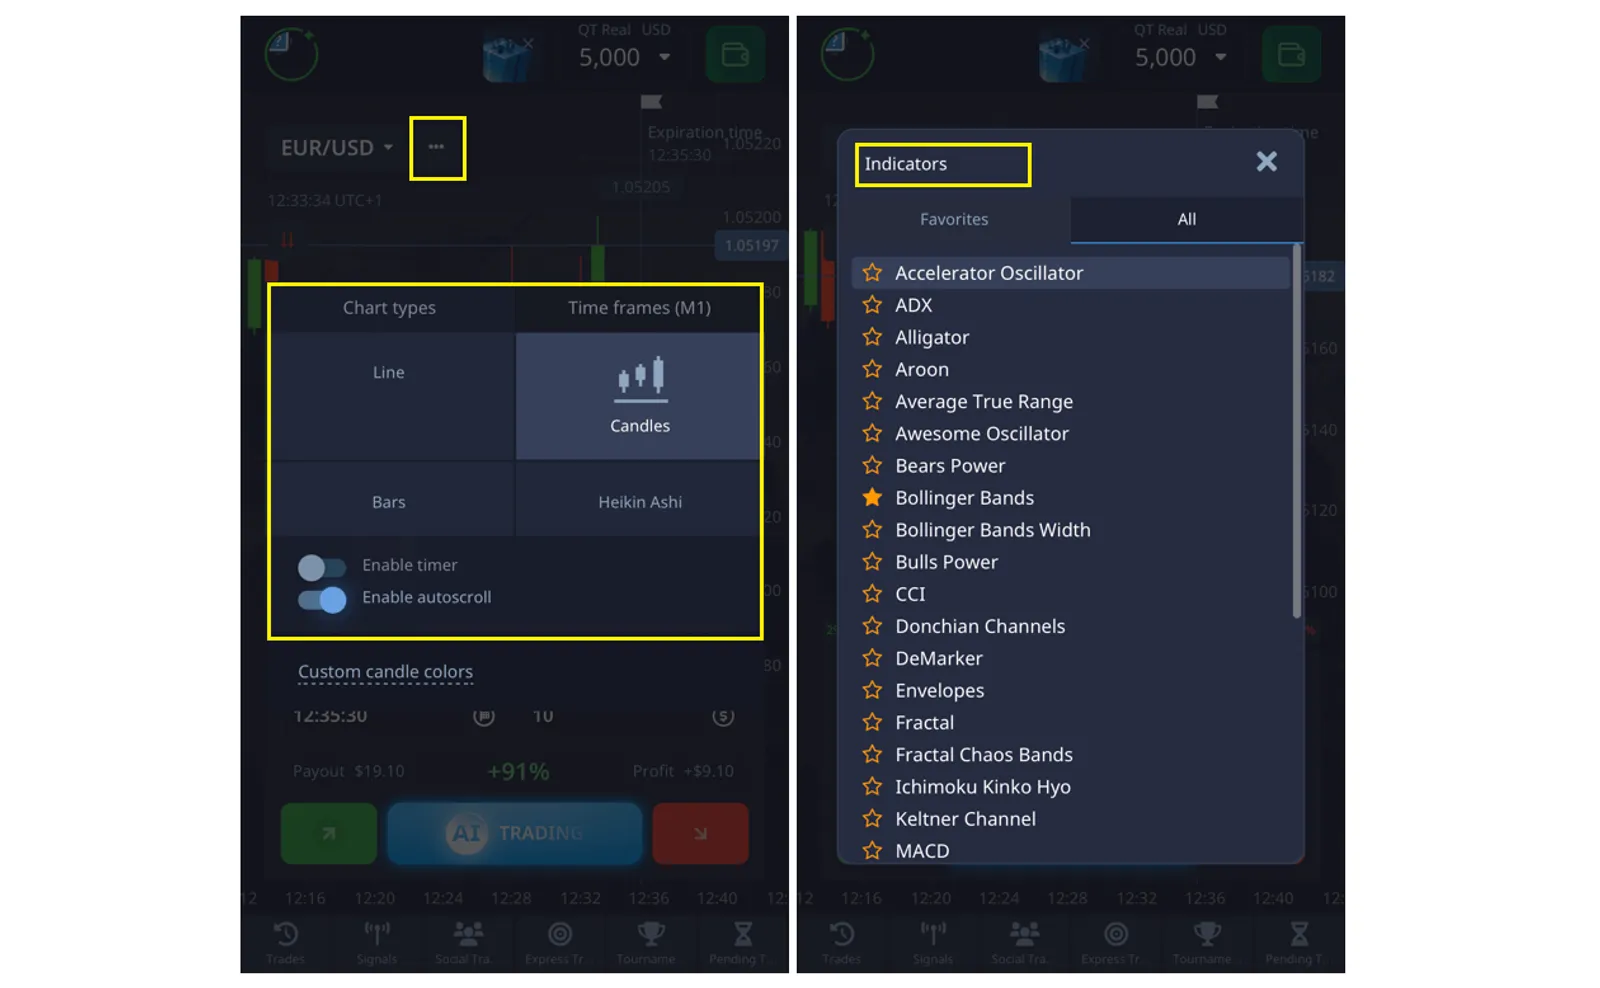
- Chart Types: Pocket Option provides several chart types, including candlestick charts, which are essential for identifying patterns like the Bart Simpson pattern.
- Time Frames: You can choose from a variety of time frames to analyze market movements in detail, which is crucial for identifying sharp increases and decreases in prices.
- Indicators: The platform offers a wide range of technical indicators such as moving averages, RSI, Bollinger Bands, and more to help analyze market trends and potential reversals.
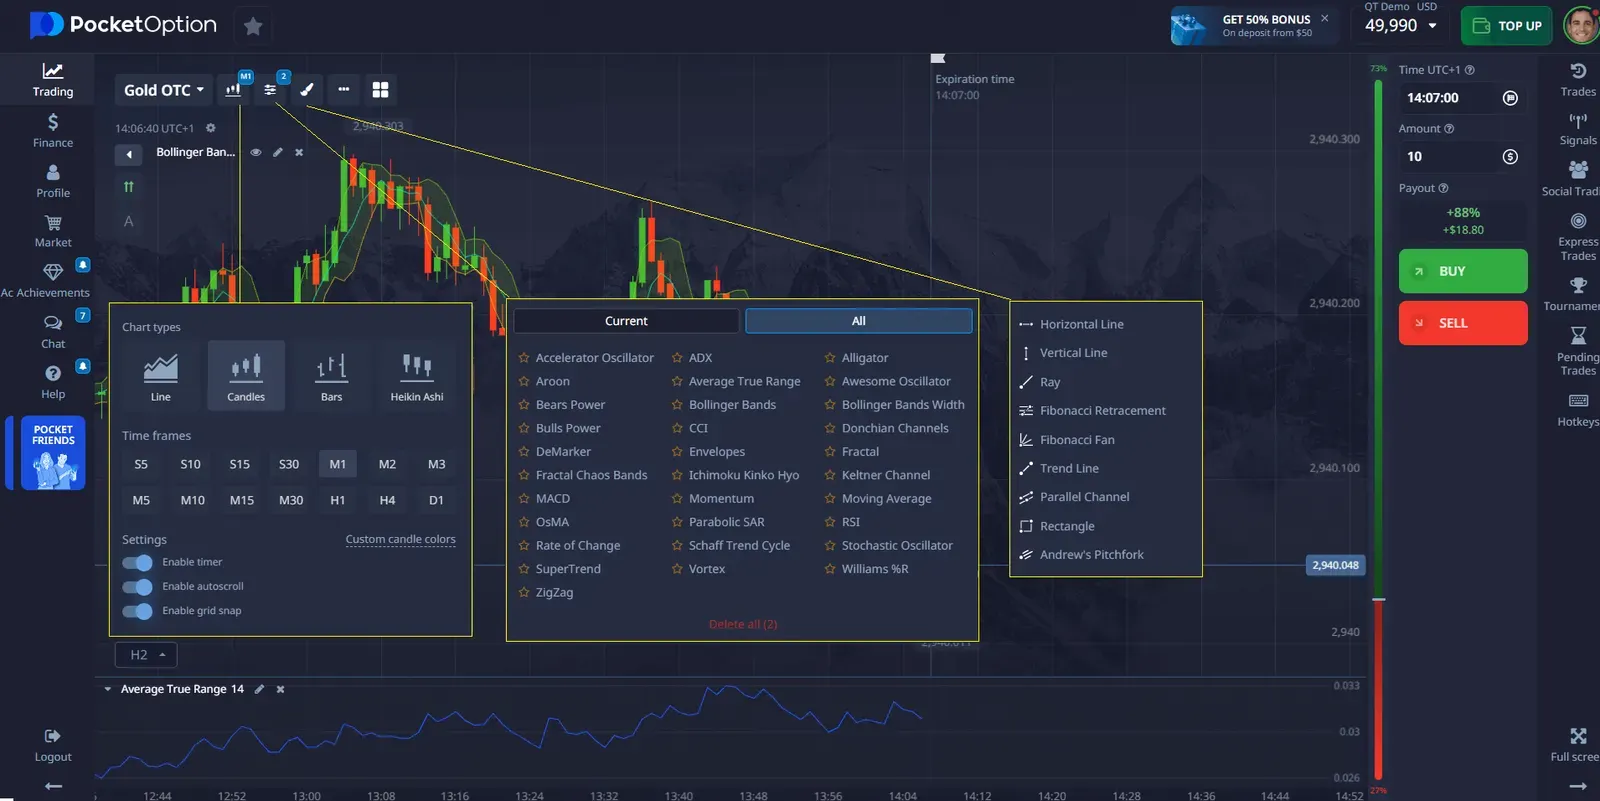
- Drawing Tools: Use drawing tools such as trend lines, horizontal lines, and Fibonacci levels to mark key levels and visualize patterns.
- Market Analysis: Get real-time market data and news to understand the factors that influence price movements.
- Demo Account: Practice identifying and trading patterns without the risk of losing real money using a demo account.
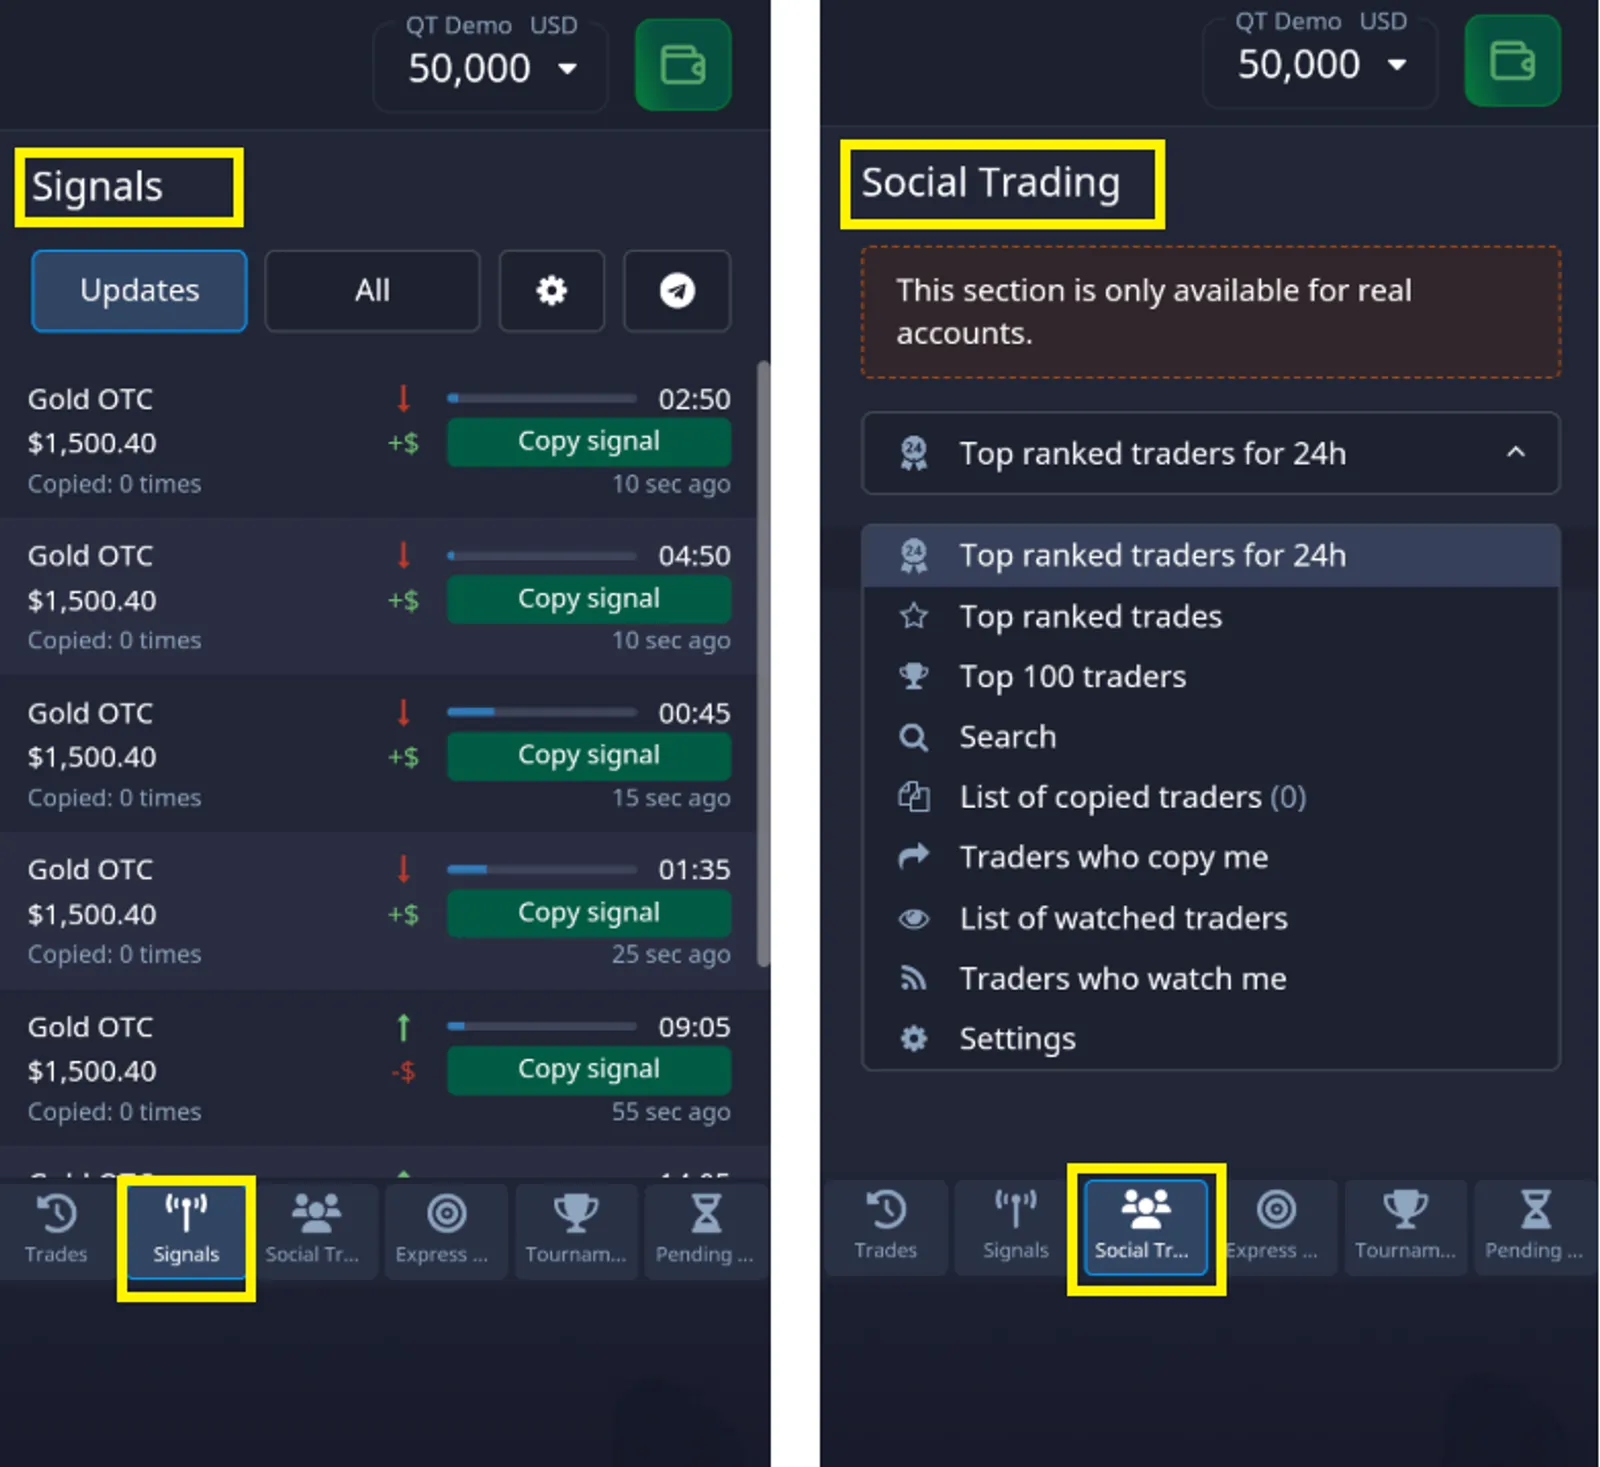
- Social Trading: Watch and copy the trades of experienced traders who may be using strategies to profit from such patterns.
This pattern often indicates market manipulation or sudden changes in market sentiment. While Pocket Option provides tools and features for analyzing market trends, it's essential to use proper risk management and trading strategies when identifying and acting on such patterns.
Get the updated platform for fast trading!
Significance of the Bart Simpson Pattern
The Bart Simpson trading pattern is often associated with market manipulation, particularly in less regulated markets like cryptocurrencies. However, it can also occur naturally due to various market forces. Understanding the implications of this pattern can help traders make more informed decisions.
- Potential market manipulation
- Sudden shifts in supply and demand
- Rapid changes in market sentiment
Trading Strategies for the Bart Simpson Pattern
While the Bart Simpson trading pattern can be challenging to trade, some strategies can be employed to potentially capitalize on this formation:
| Strategy | Description |
|---|---|
| Breakout Trading | Enter trades when price breaks out of the consolidation phase |
| Fade the Spike | Short the market after the initial price spike, anticipating a return to previous levels |
| Range Trading | Trade within the consolidation phase, buying at support and selling at resistance |
It's crucial to combine these strategies with proper risk management techniques and to consider other technical and fundamental factors before making trading decisions.
The Bart Pattern Trading in Different Markets
While the Bart Simpson trading pattern is commonly associated with cryptocurrency markets, it can also appear in other financial instruments. Let's explore how this pattern manifests in different markets:
- Cryptocurrency markets
- Forex markets
- Stock markets
- Commodity markets
The frequency and clarity of the Bart Simpson pattern may vary across these markets due to differences in liquidity, regulation, and market participants.
Risk Management for Bart Simpson Pattern Trading
Trading the Bart Simpson pattern comes with its own set of risks. Implementing proper risk management strategies is essential for protecting your capital:
| Risk Management Technique | Description |
|---|---|
| Stop Loss Orders | Place stop losses to limit potential losses if the pattern doesn't play out as expected |
| Position Sizing | Adjust your position size based on the volatility of the Bart Simpson pattern |
| Diversification | Don't rely solely on bart pattern trading; diversify your strategies and assets |
Tools and Indicators for Identifying the Bart Simpson Trading Pattern
Several technical analysis tools and indicators can help traders identify and confirm the Bart Simpson trading pattern:
- Volume indicators
- Volatility indicators
- Support and resistance levels
- Trend lines and channels
Combining these tools with price action analysis can improve the accuracy of bart pattern identification and trading decisions.
The Psychology Behind the Bart Simpson Pattern
Understanding the psychology of market participants can provide insights into why the Bart Simpson trading pattern occurs:
| Phase | Psychological Factor |
|---|---|
| Initial Spike | FOMO (Fear of Missing Out) and greed |
| Consolidation | Uncertainty and indecision |
| Sharp Decline | Fear and panic selling |
By recognizing these psychological factors, traders can better anticipate potential market movements and make more informed decisions.
Conclusion
The Bart Simpson trading pattern is a fascinating chart formation that has captured the attention of many traders. While it presents potential opportunities, it also comes with significant risks. Successful trading of this pattern requires a combination of technical analysis skills, risk management, and an understanding of market psychology. As with any trading strategy, it's essential to practice and refine your approach before committing real capital. Remember that the bart pattern trading is just one tool in a trader's arsenal and should be used in conjunction with other analysis methods for the best results.