
Advanced Algorithmic Trading Techniques: From Theory to Practice
In 2025, automated trading on the Pocket Option platform reached a new level thanks to advanced techniques that allow traders to develop complex and effective strategies. This article covers custom indicator creation, backtesting, forward testing, multi-timeframe analysis, and working with big data—giving traders the tools to improve the accuracy and profitability of their trading systems.

Advanced Trading Techniques
Creating Custom Indicators
Creating your own technical indicators allows traders to adapt strategies to unique market conditions. Popular tools for this include Python libraries such as TA-Lib and Pandas.TA-Lib provides a broad set of technical analysis functions, including indicators like RSI, MACD, Bollinger Bands, and others. It allows for fast calculation of standard indicators based on price data.Pandas is used for processing and analyzing time series, which simplifies the creation of complex indicators by combining data from multiple sources.
Example: Creating a Custom Indicator
A trader can create an indicator that combines RSI and MACD to generate buy or sell signals. For example, a buy signal could occur when RSI is in the oversold zone (below 30) and the MACD histogram is positive. Here's a sample Python code:
import pandas as pd

import talib

# Assume 'data' is a DataFrame with closing prices

rsi = talib.RSI(data['close'], timeperiod=14)

macd, signal, hist = talib.MACD(data['close'], fastperiod=12, slowperiod=26, signalperiod=9)

# Create a custom signal

custom_signal = (rsi < 30) & (hist > 0)

# Use the signal to generate buy orders
This signal can be integrated into a trading bot like MT2Trading or an open-source bot from GitHub, such as pocket_option_trading_bot.
Advanced Approaches
For more complex strategies, traders can use machine learning libraries such as scikit-learn to create predictive models. For example, a Random Forest model can be trained to predict price movement based on a set of indicators:
from sklearn.ensemble import RandomForestClassifier

from sklearn.model_selection import train_test_split

# Assume 'features' is a DataFrame with indicators, 'target' is 1 for up, 0 for down

X_train, X_test, y_train, y_test = train_test_split(features, target, test_size=0.2)

model = RandomForestClassifier()

model.fit(X_train, y_train)

predictions = model.predict(X_test)
Such models help adapt to changing market conditions, which is especially valuable in times of high volatility.
Backtesting: Parameter Optimization
Backtesting is the process of testing a trading strategy on historical data to assess its effectiveness. In 2025, traders use platforms like Backtrader and MetaTrader to optimize strategy parameters.
- Backtrader is a Python library that supports strategy development and testing. It allows parameter tuning and analysis of results like return and drawdown.
- MetaTrader (MT4/MT5) provides a built-in strategy tester where traders can create Expert Advisors (EAs) using MQL4/MQL5 and test them on historical data.
Example: Backtesting with Backtrader
A trader can create a strategy that buys when the price crosses above the 200-day moving average and sells when it crosses below:
from backtrader import Strategy

class MyStrategy(Strategy):

def __init__(self):

self.sma = self.indicators.SimpleMovingAverage(period=200)

def next(self):

if not self.position:

if self.data.close[0] > self.sma[0]:

self.buy()

elif self.data.close[0] < self.sma[0]:

self.sell()
This code can be run on historical data to assess strategy performance. Backtrader allows optimization of variables like the moving average period to maximize returns.
Backtesting in MetaTrader
In MetaTrader, traders use the strategy tester to launch EAs. For instance, an EA can be programmed to trade based on moving average crossovers. In 2025, AI integration makes backtesting more accurate by incorporating complex market scenarios.
Forward Testing on Demo Account
Forward testing evaluates a strategy on live market data using a demo account. Pocket Option provides a $50,000 demo account ideal for these tests.12-point checklist for forward testing:
- Define objectives (e.g., signal accuracy)
- Select a representative test period
- Track metrics: return, drawdown, win ratio
- Adjust parameters as needed
- Maintain a trading journal
- Avoid emotional trading
- Test different market conditions
- Account for slippage
- Apply risk management rules
- Set stop-loss and take-profit levels
- Analyze results post-test
- Be patient—let the data accumulate
Multi-Timeframe Analysis
This technique involves analyzing the market on several timeframes to gain a fuller picture of price direction and entry points. In 2025, this method is more accessible thanks to advanced tools on Pocket Option.Example:
- H1 (1 hour): Use a long-term 200 EMA to identify the trend.
- M15 (15 minutes): Use short EMAs (50 & 100) to spot entries.
- M5 (5 minutes): Use oscillators like RSI or Stochastic to refine timing.
This approach reduces false signals and boosts accuracy by up to 40% compared to single-timeframe analysis. A trade on M5 is only triggered with confirmation from H1 and M15.
Working with Big Data
Big data is becoming a key trading edge in 2025. Traders use data sources like Quandl and Yahoo Finance for historical and macroeconomic data.
- Quandl: Offers access to stock prices, commodities, and macro data.
- Yahoo Finance API: Fetches historical prices and financial metrics.
Example: Yahoo Finance
import yfinance as yf

data = yf.download('AAPL', start='2020-01-01', end='2025-01-01')
Example: Quandl
import quandl

data = quandl.get('YAHOO/INDEX_GSPC')
These datasets can be used for backtesting, training machine learning models, or market trend analysis. For example, Quandl data can help forecast volatility patterns.
How to Apply These Techniques
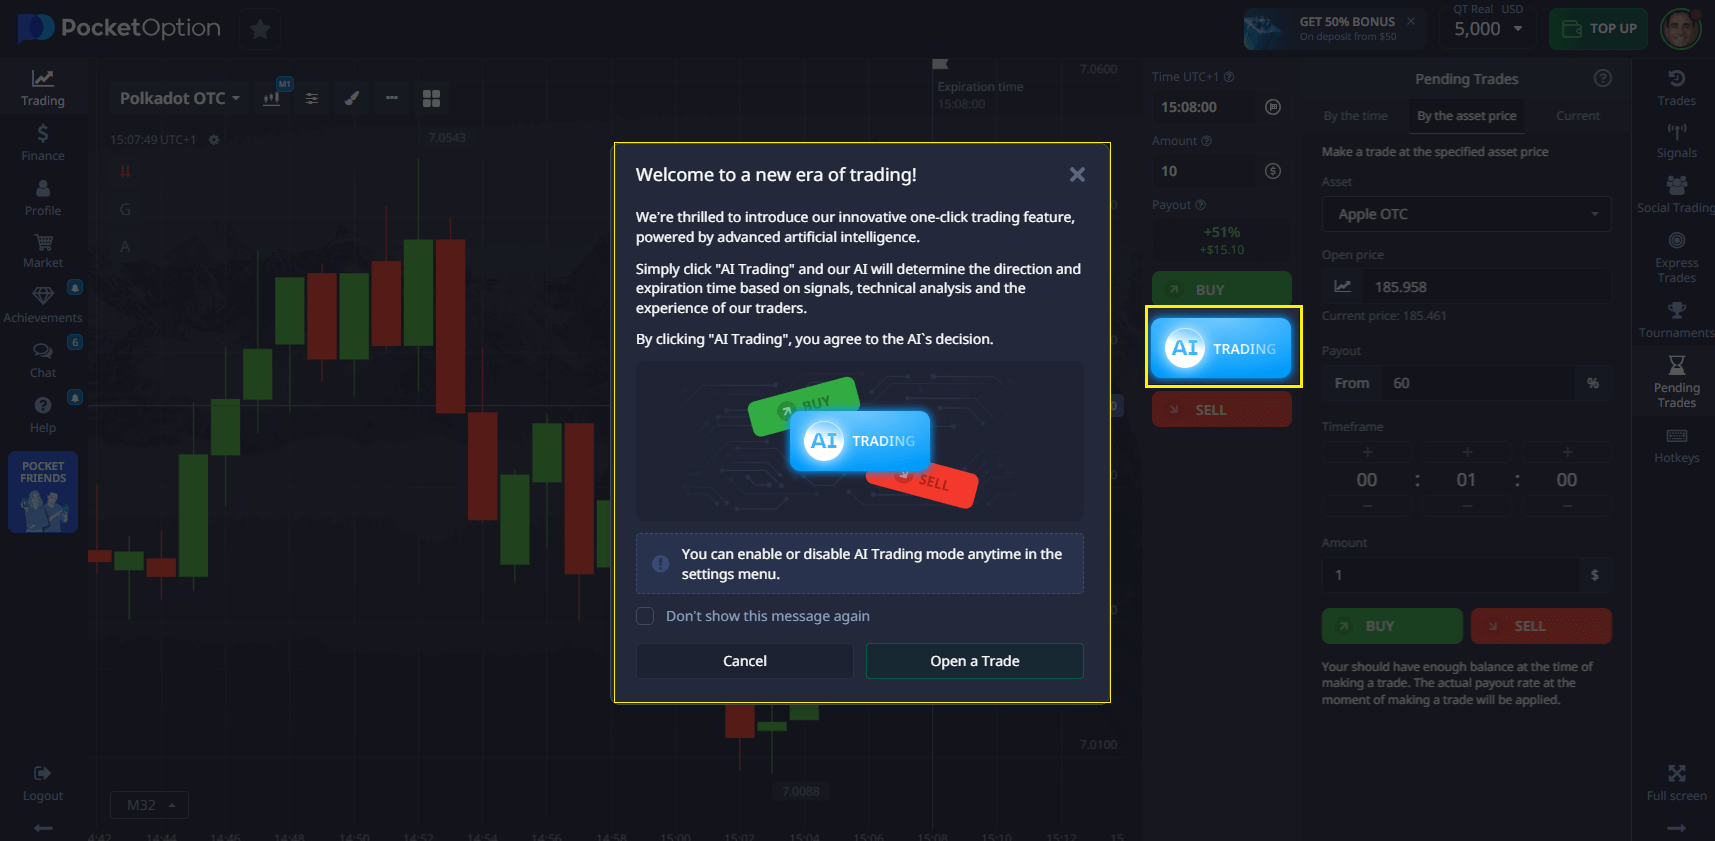
Beginners should start with simple tools like the built-in AI Trading Bot and gradually move to backtesting and multi-timeframe analysis. Experienced traders can build custom indicators and use big data to craft unique strategies. Always start on demo to reduce risk.
Recommendations
- Use Python libraries like TA-Lib and Pandas for indicator creation.
- Backtest strategies using Backtrader or MetaTrader.
- Apply multi-timeframe analysis to improve signal accuracy.
- Integrate data from Quandl or Yahoo Finance for deeper insights.