
Trading Journal Template Google Sheets: Essential Tool for Trade Analysis
Tracking your trading activity is essential for enhancing performance and making informed decisions. Using a Google Sheets trading journal template offers a customizable, cloud-based solution to help traders track their progress, recognize strengths and weaknesses, and refine their strategies.

Benefits of Using Google Sheets for Your Trading Journal
Creating a forex trading journal Google Sheets system offers several advantages over other tracking methods. It’s cloud-based, free, and packed with powerful features for comprehensive trade documentation.
- Accessibility from any device with an internet connection
- Automatic calculations and formulas
- Collaborative features for sharing with mentors
- Customizable layouts and formatting
Many traders prefer this approach because it eliminates the need for specialized software while offering robust analytical capabilities.
Essential Components of an Effective Trading Journal
A comprehensive trading journal template Google Sheets should include key sections to track all aspects of your trades. These include:
| Component | Description | Importance |
|---|---|---|
| Trade Details | Date, asset, position size, entry/exit prices | Core transaction data |
| Performance Metrics | Profit/loss, win rate, expectancy | Measures effectiveness |
| Strategy Notes | Setup type, indicators used, timeframe | Tracks methodology consistency |
| Psychology Notes | Emotional state, stress level, confidence | Identifies behavioral patterns |
| Screenshots | Chart images before/during/after trade | Visual reference for review |
Including these elements creates a comprehensive record that supports thorough analysis of trading performance over time.
Step-by-Step Setup Process
To set up your Google Sheets trading journal template:
- Start with a blank Google Sheet and create tabs for various timeframes.
- Design a main log with columns for essential metrics like date, asset, position size, and entry/exit prices.
- Use formulas to automatically calculate performance metrics like profit/loss, win rate, and expectancy.
- Add visualization charts to track your progress over time, helping you monitor growth and identify trends.
The flexibility of Google Sheets allows for continuous refinement of your journal as your trading needs evolve.
Advanced Features for Pocket Option Traders
Pocket Option offers several tools and features that traders can leverage to enhance their trading analysis and tracking. While there isn't a built-in trading journal template Google Sheets, you can manually export your trading history from the platform and use it to create a custom journal in Google Sheets.
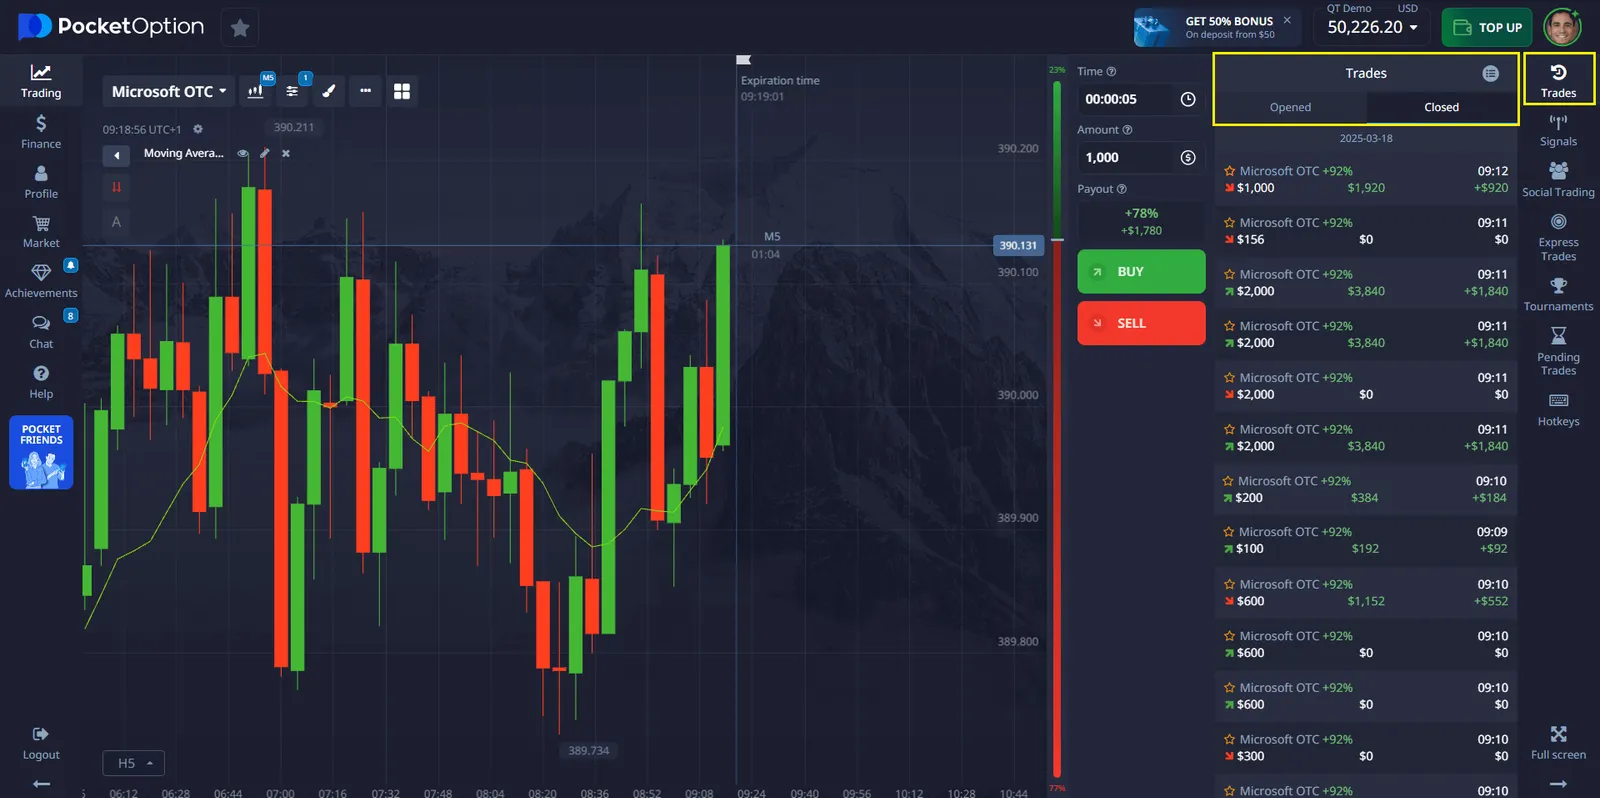
Trades History Section on Pocket Option
The Pocket Option platform provides a detailed trading history section where traders can analyze their trading activity, including order IDs, dates, times, and performance metrics. This section plays a crucial role in constructing your trading equity curve. By analyzing your trade history—tracking profits, losses, and overall performance—you can monitor the growth or decline of your trading account over time.
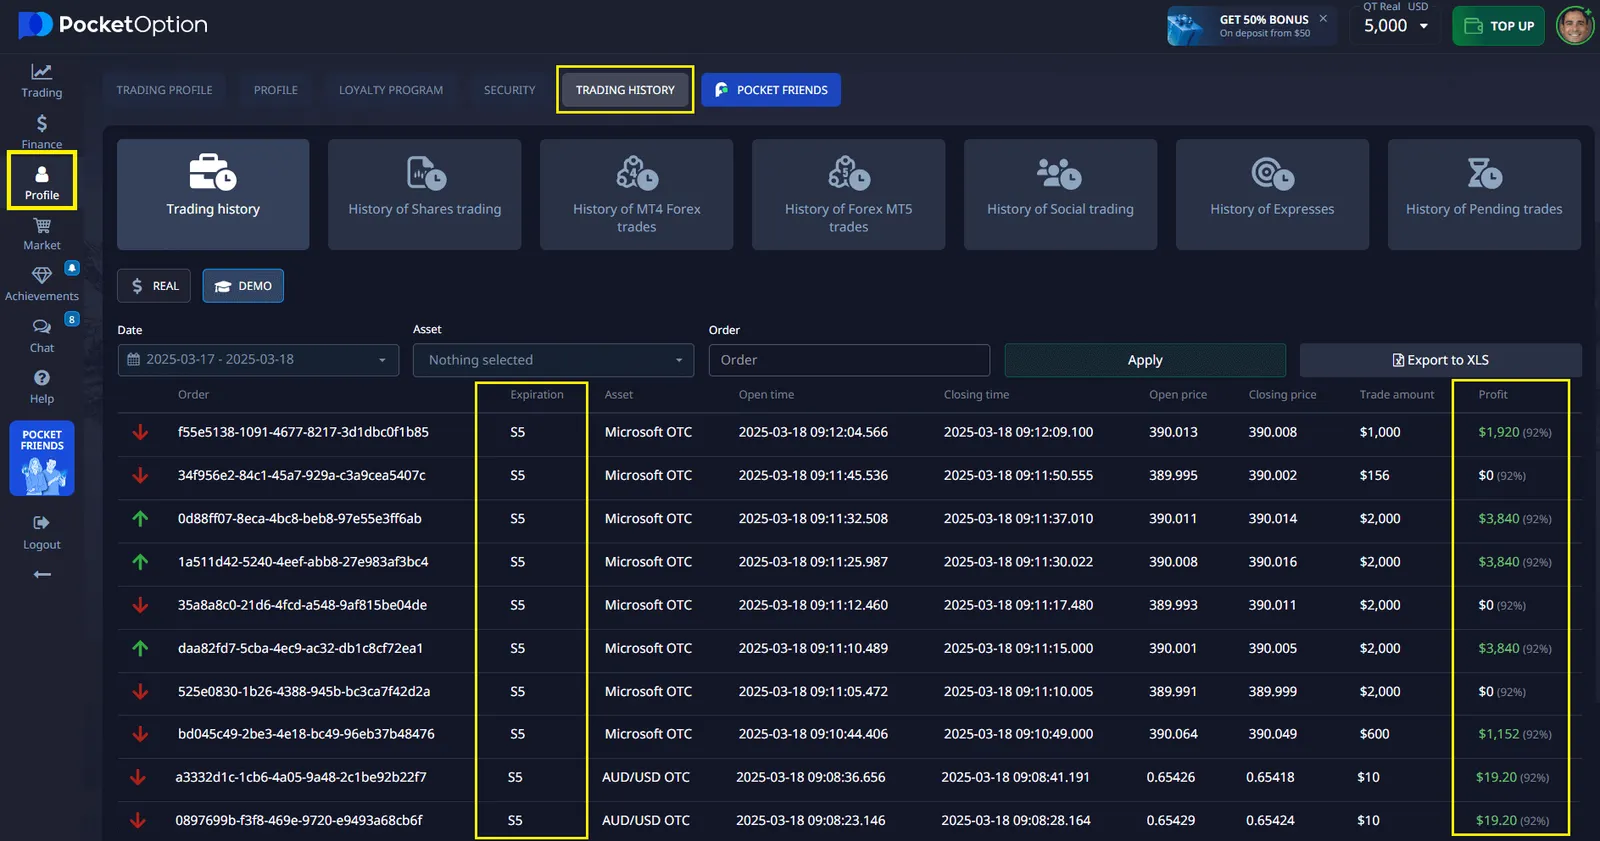
These detailed records allow you to visualize your trading effectiveness and make informed decisions to refine and improve your strategies.
| Feature | Implementation |
|---|---|
| Asset Categories | Separate tracking for different instrument types |
| Expiry Time Analysis | Performance metrics by timeframe |
| Strategy Comparison | Side-by-side analysis of different approaches |
| Risk Management | Position sizing and account balance tracking |
With Pocket Option, you don’t just trade—you learn and evolve with every transaction. The "Trades History" section is designed to give you a clear picture of your trading habits, helping you identify successful patterns and areas for improvement.
Key Performance Metrics to Track
Tracking these key performance metrics in your Google Sheets trading journal template provides valuable insights and highlights areas for improvement. Here are the most important ones to include:
| Metric | Formula | Target Range |
|---|---|---|
| Win Rate | Winning Trades ÷ Total Trades | Above 50% |
| Risk-Reward Ratio | Average Win ÷ Average Loss | Minimum 1:1.5 |
| Expectancy | (Win% × Avg Win) - (Loss% × Avg Loss) | Positive value |
| Max Drawdown | Largest peak-to-trough decline | Less than 20% |
Common Challenges and Solutions
Common obstacles include inconsistent data entry, formula errors, and challenges in maintaining discipline with regular updates. Here’s how to tackle them:
- Inconsistent data entry: Use data validation to ensure accurate inputs.
- Formula errors: Set up automatic checks to detect discrepancies.
- Lack of discipline: Set up regular review schedules and reminders for consistent updates.
Data Visualization Techniques
Visualizing your data through charts is an effective way to identify trends and optimize strategies. Use the following visualization techniques:
| Chart Type | Purpose | Implementation |
|---|---|---|
| Equity Curve | Track account growth over time | Line chart using cumulative P/L |
| Win/Loss Distribution | Visualize trading outcomes | Bar chart showing frequency |
| Performance by Day/Time | Identify optimal trading periods | Heat map using conditional formatting |
Conclusion
With a Google Sheets trading journal template, you have a flexible and accessible tool to track your performance and continuously improve. Start today and watch your trading strategies evolve over time.