
Pocket Option Trading Analysis: A Data-Driven Approach To Consistent Profits
Effective Pocket Option Trading analysis integrates multi-timeframe confluence, volume patterns, and psychological price barriers. This framework reveals how experienced traders achieve 67–73% win rates while maintaining risk-reward ratios above 1:1.8, with specific implementation steps you can apply immediately.
Beyond Basic Indicators: The Professional Edge
Sophisticated Pocket Option trading analysis requires a comprehensive framework integrating multiple data sources rather than relying on isolated indicators. Experienced traders build systems combining price action, volume patterns, market structure, and psychological levels.
The difference between novice and expert analysis lies in methodology:
| Trading Style | Description | Win Rate Range | Risk:Reward Ratio | Strength |
|---|---|---|---|---|
| Single Indicator | Uses only one signal (e.g., RSI or MACD alone) | 38–45% | 1:0.8 | Very simple, but often unreliable |
| Multiple Indicators | Combines 2–3 tools (e.g., RSI + MA + MACD) | 52–58% | 1:1.2 | More stable, filters weak signals |
| Smart Strategy Combo | Combines patterns, levels, and volume | 67–73% | 1:1.8 | Clear context, stronger decisions |
| Expert System | Fully adapted system with conditions and filters | 72–78% | 1:2.3 | Flexible and highly consistent |
“Consistency in Quick Trading comes not just from strategy, but from execution discipline and understanding when not to trade. Volume and context are often ignored, but they make all the difference.”
Michael Torres, market analyst and performance coach
Price Action: The Foundation of Market Reading
Price action forms the cornerstone of effective Pocket Option Trading analysis, offering essential context for interpreting indicators. As indicators lag due to being derived from price, skilled price action interpretation identifies reversals and continuations ahead of signals.
Common patterns in Quick Trading include:
| Price Pattern | Market Signal | Success Rate | Best Timeframe |
|---|---|---|---|
| Pin Bar / Rejection | Potential reversal | 68% with confluence | 15-minute+ |
| Engulfing Pattern | Momentum shift | 72% at key levels | 5-minute+ |
| Inside Bar | Consolidation/breakout | 64% with volume confirm | 1-hour+ |
| Double Top/Bottom | Reversal pattern | 76% with divergence | 30-minute+ |
Three-Step Price Action Method:
- Identify significant swing points on higher timeframes (4H, Daily)
- Switch to lower timeframe (5–30 min) and detect patterns
- Confirm validity with volume, candlestick size, and proximity to levels
Built-In Tools for Smarter Decisions
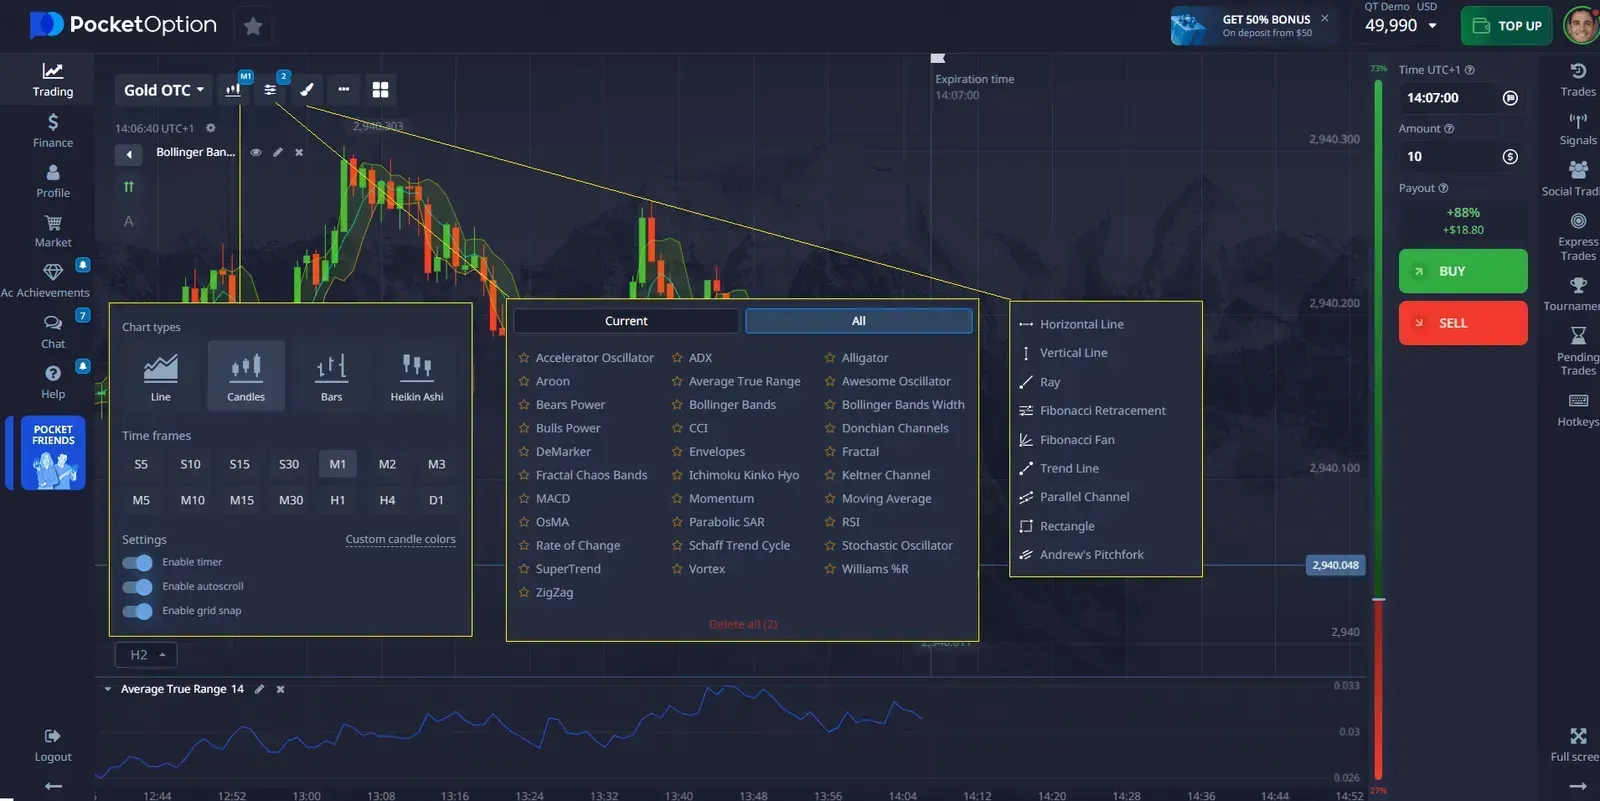
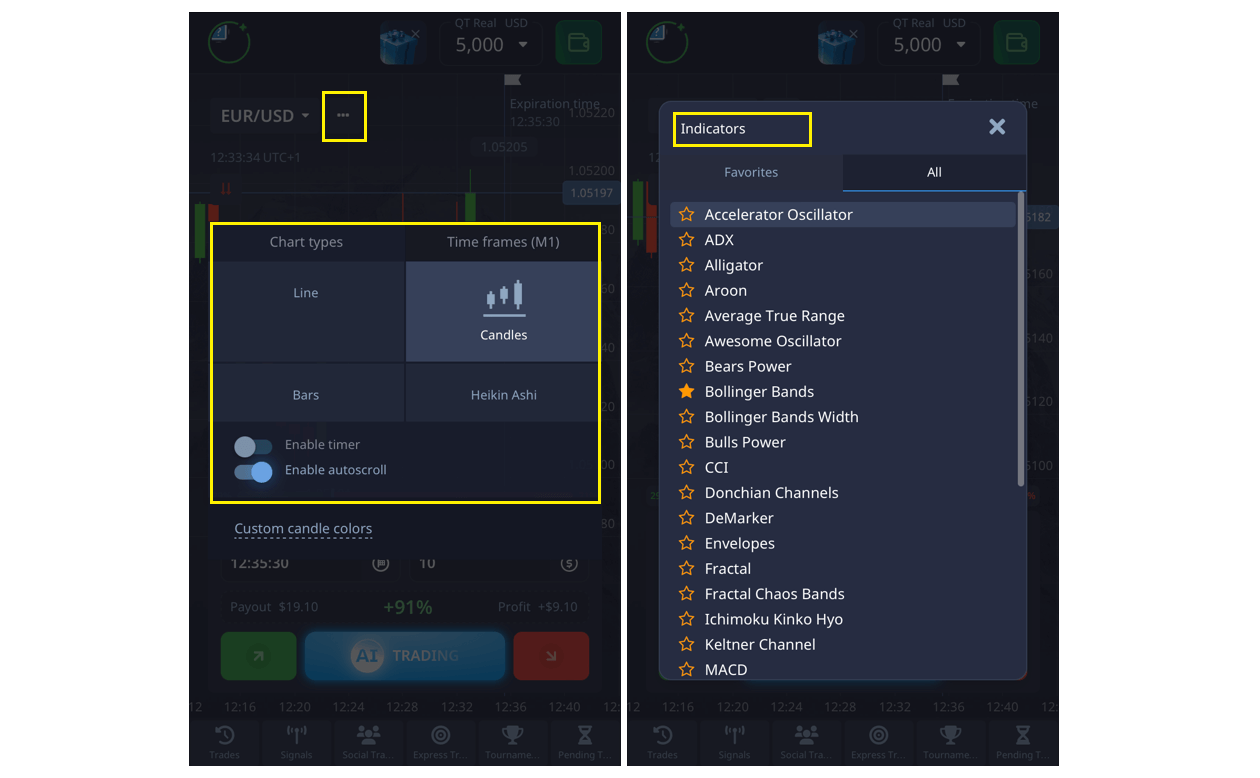
Pocket Option provides a diverse range of analytical tools designed to help you understand market trends and make well-informed decisions.
Key features include:
- Fast visual tools and intuitive chart layouts to reflect current market conditions (Use candlestick, line charts, heiken ashi and bars)
- Detailed payout percentages to help you understand your profit potential
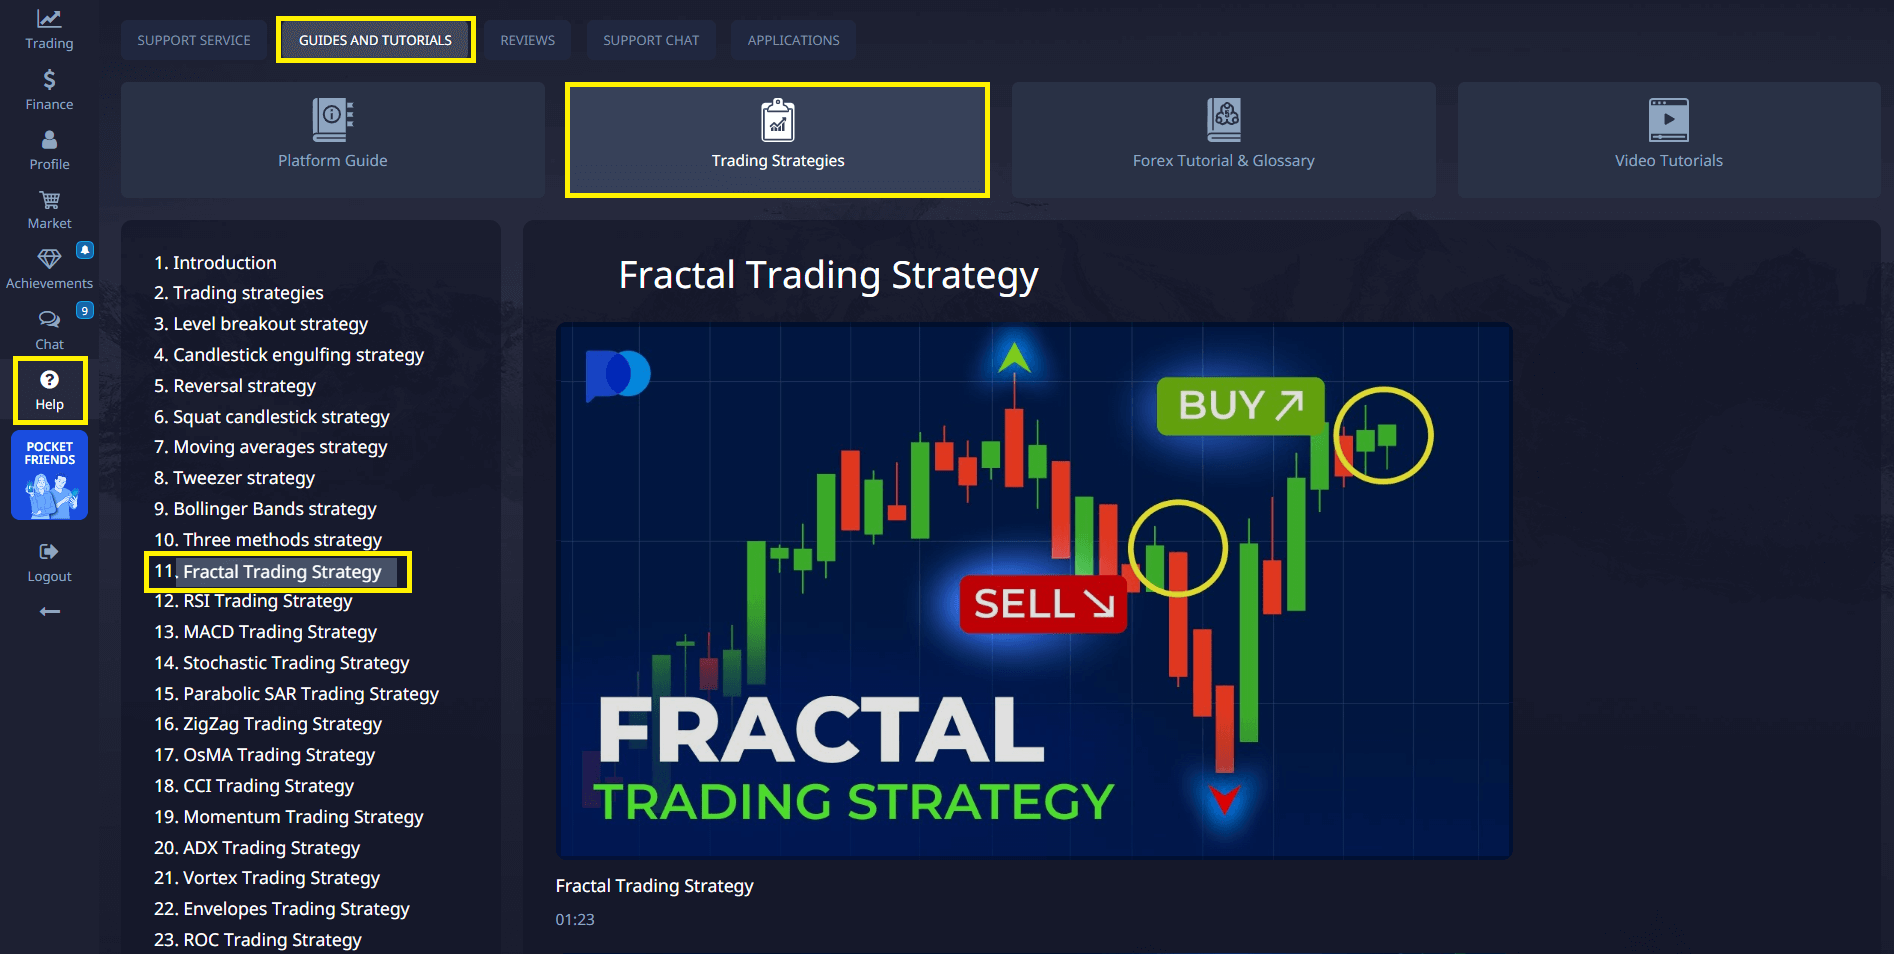
- A strategy library offering integrated approaches to refine your trading method
- Risk management tools that help protect and optimize your trades
These features work together to deliver clear insights and a smooth trading experience.
Volume Analysis: The Missing Dimension
Volume reveals the conviction behind price movements. Professionals use:
- Volume Climax: Extreme spike, signals potential exhaustion
- Volume Confirmation: Rising volume validating price direction
- Volume Divergence: Decreasing volume at price extremes
- Low-Volume Pullback: Weak retracement = healthy trend
Volume Pocket Option Trading analysis becomes especially valuable during breakouts and at key support/resistance levels. A breakout with 200%+ average volume shows much higher sustainability than similar moves on average or below-average volume.
Find out more about volume indicator in our article
Support/Resistance: Mapping Market Memory
Support and resistance levels function as market memory points where past buyer/seller activity influences future price behavior. Effective Pocket Option trading analysis requires systematically identifying and ranking these levels based on their probable price impact.
Not all levels carry equal significance. Professional traders prioritize these levels based on specific characteristics:
| Level Type | Significance | Identification Method |
|---|---|---|
| Multi-timeframe Confluence | Very High | Aligned levels across timeframes |
| Major Swing Points | High | Significant past highs/lows |
| Round Numbers | Moderate-High | Psychological levels (e.g., 1.2000, 50.00) |
| Fibonacci Levels | Moderate | 38.2%, 50%, 61.8% retracement areas |
Strategic Indicator Integration
Expert traders use indicators for distinct analytical dimensions:
| Market Dimension | Indicators | Insight Provided |
|---|---|---|
| Trend Direction | Moving Averages, ADX | Trend direction and strength |
| Momentum | RSI, MACD, Stochastic | Rate of price change |
| Volatility | Bollinger Bands, ATR | Volatility, breakout signals |
| Volume | OBV, Volume Profile | Market participation, strength of move |
Indicators should answer unique questions, not confirm each other redundantly. The strongest support/resistance levels typically show:
- Multiple tests with precise reactions (indicates market recognition)
- Higher timeframe significance (daily levels outweigh 15-minute levels)
- Recent relevance (levels that recently affected price matter more)
- Volume confirmation (high-volume reactions reinforce level strength)
- Multiple technical confluences (level aligns with other technical factors)
When conducting Pocket Option Trading analysis, the most profitable opportunities emerge when multiple support/resistance factors align at similar price points, creating “confluence zones” with significantly higher reaction probability.
Market Context: The Environment Matters
Market context determines which analytical techniques will be most effective. Successful Pocket Option trading analysis begins with identifying the current market environment, as different conditions require different approaches.
| Market Type | Identification | Best Focus | Common Errors |
|---|---|---|---|
| Strong Trend | ADX > 25, clear direction | Trend continuation, pullbacks | Premature reversals |
| Range-Bound | Horizontal support/resistance | Bounces at key levels | Anticipating unconfirmed breakouts |
| Breakout/Breakdown | Breach + strong volume | Momentum entry, retests | Chasing late entries |
| Transition | Mixed volatility, structure | Smaller positions, tighter filters | Using trend methods in chop |
Practical Example: Using Analysis on Pocket Option
To apply the analytical strategies described above, follow this hands-on example using the Pocket Option platform:
- Register or log in to your Pocket Option account — You can use a demo account or switch to a live account.
- Choose your asset — Select a popular instrument (e.g., EUR/USD) from the asset panel.
- Open the chart — Switch to the advanced chart mode for better visualization.
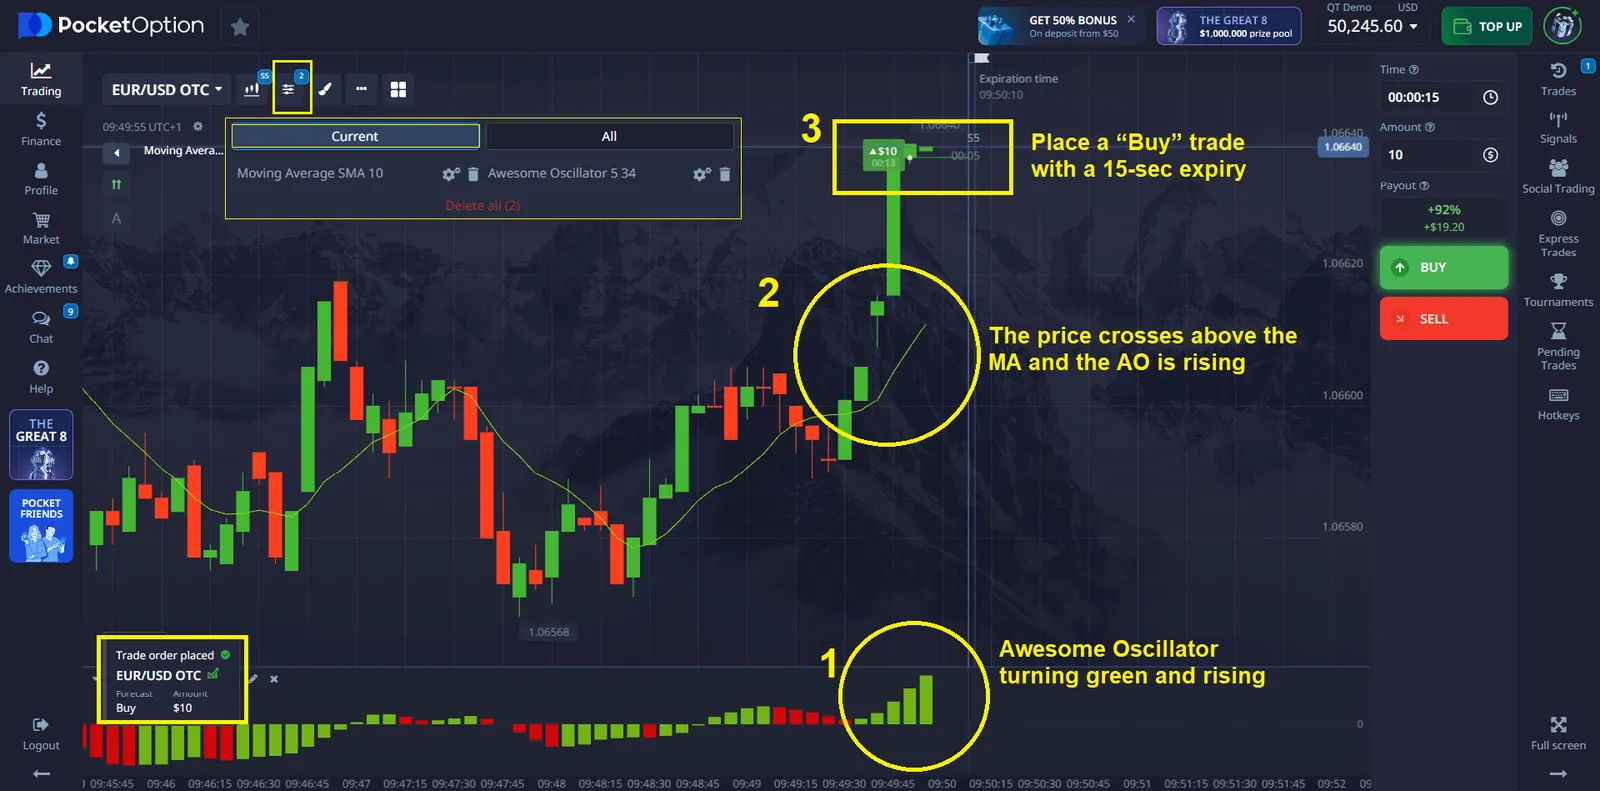
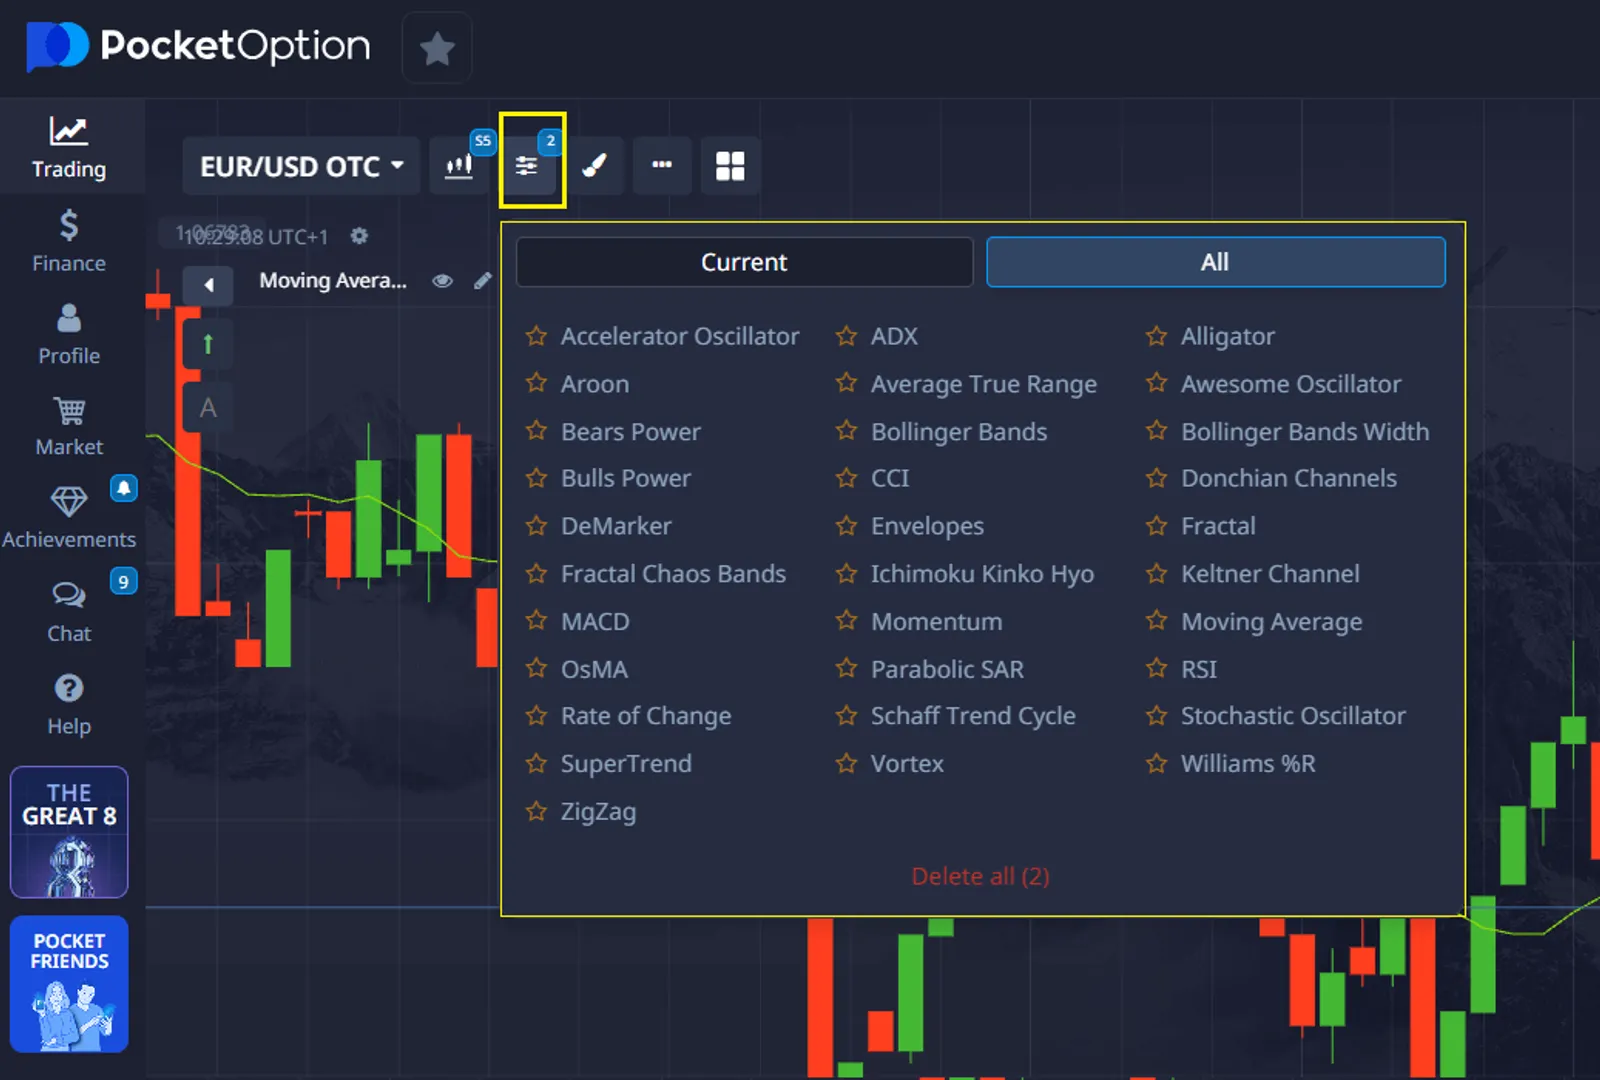
- Select indicators — For example, apply a Moving Average (trend), RSI (momentum), and Volume Profile (participation).
Analyze the chart:
- Start from a higher timeframe (e.g., 4H) to identify key levels
- Switch to a trading timeframe (e.g., 5M or 15M)
- Look for price patterns such as an engulfing candle or at a support/resistance zone
- Confirm with volume — Ensure volume supports the price move (e.g., increasing on breakout, declining on pullback)
Plan your trade:
- Define your risk (1–2% of account balance)
- Decide on entry type (e.g., at market or limit order on pullback)
- Execute and monitor — Enter the trade, monitor real-time performance, and exit according to your strategy.
"The visual simplicity of Pocket Option’s tools combined with multi-timeframe charting makes it my go-to platform. No clutter
just clear, efficient execution."— Eva Müller, full-time trader
Try om mobile!
From Analysis to Execution
Bridge Pocket Option Trading analysis and action with structured steps:
- Setup Identification
- Confirmation via volume/pattern/context
- Risk Management — stops based on structure, risk 1–2%
- Precise Entry — avoid ambiguity
- Position Management — multiple exit strategies
- Trade Logging — record setups, outcomes, and lessons
Execution depends on:
- Defined entry criteria
- Stop-loss anchored to price structure
- Position sizing based on stop distance
- Partial profits and trailing exits
- Performance tracking
Build Your Analytical Edge
Progression path:
- Learn indicators
- Master price action
- Recognize context
- Integrate methods
- Apply structured execution
Strengthen your Pocket Option Trading analysis using the demo account to test strategies risk-free. Explore copy trading to align with top performers and gain further market insight. Discuss this and other topics in our community!
✔️ Start integrating this system today using real-time charts available via Pocket Option’s desktop, browser, and mobile apps.