- 111-Day Moving Average: Represents medium-term price momentum.
- 350-Day Moving Average (×2): Reflects long-term trend strength doubled.
- Crossover Signal: Generated when 111 SMA exceeds 2 × 350 SMA.
- Mathematical Foundation: Uses the π relationship for timing precision.
Bitcoin Pi Cycle Top Indicator: Your Precise Market Exit Strategy

6 min to read

Updated on 24 Sep 2025
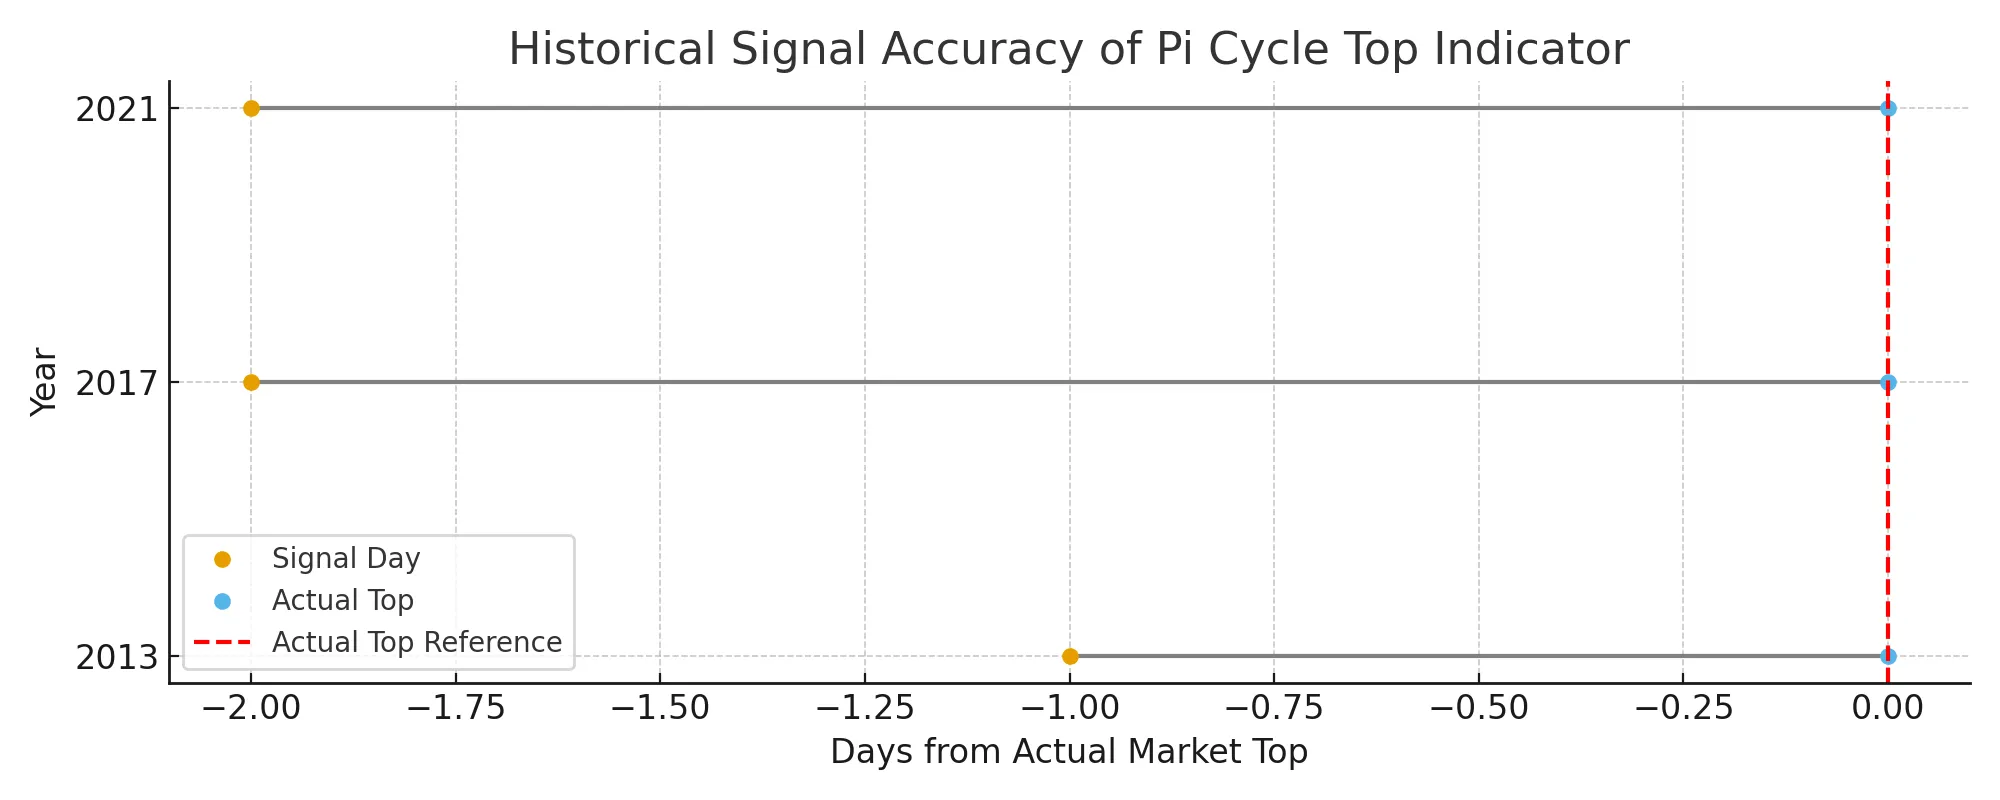
The Bitcoin Pi Cycle Top Indicator has successfully predicted three major market peaks with remarkable accuracy, achieving signals within days of actual Bitcoin cycle tops in 2021, 2017, and 2013.
Article navigation
- Bitcoin Pi Cycle Top Indicator: Master Market Peak Prediction
- Understanding the Bitcoin Pi Cycle Top Mechanism
- Historical Performance and Accuracy Analysis
- Calculating the Pi Cycle Top Indicator
- Implementation Strategies for Modern Traders
- Platform Integration and Practical Applications with Pocket Option
- Limitations and Risk Considerations
Bitcoin Pi Cycle Top Indicator: Master Market Peak Prediction
The Bitcoin Pi Cycle Top Indicator stands as one of the most reliable technical analysis tools for predicting Bitcoin market cycle peaks. Created by Philip Swift in 2019, this innovative indicator combines two simple moving averages to identify when Bitcoin’s price rally may be approaching unsustainable levels. For traders seeking to time their exits and maximize profits, understanding this powerful tool has become essential in navigating cryptocurrency markets.
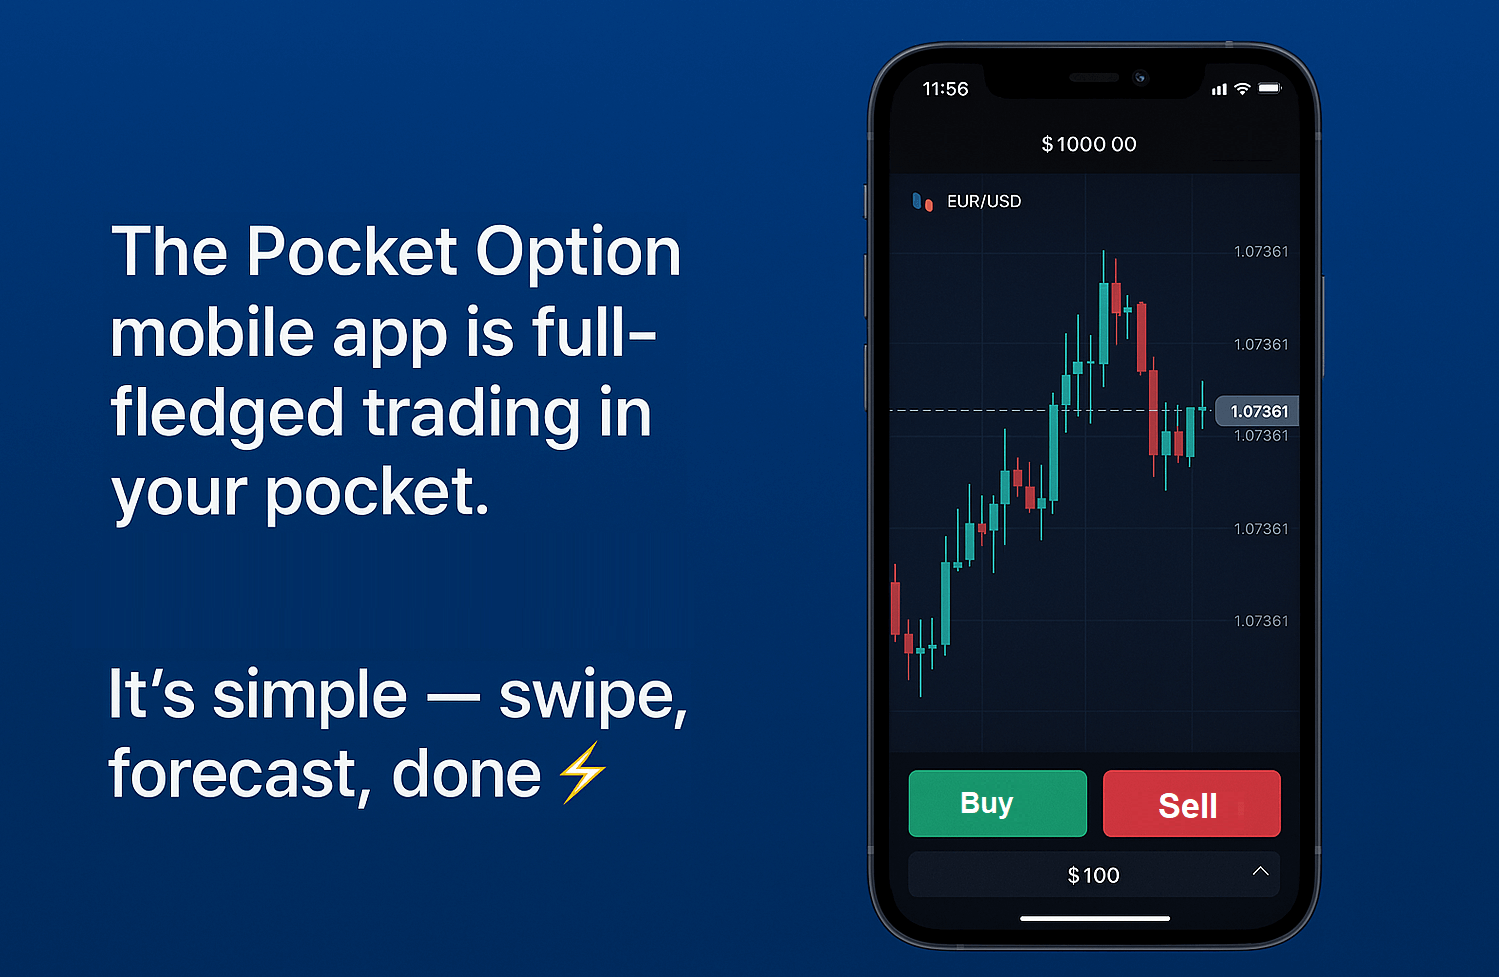
✨ With Pocket Option, you can trade on Bitcoin’s volatility with ease. Simply make a forecast, and you could earn up to 92% profit in as little as 5 seconds! ✨
Understanding the Bitcoin Pi Cycle Top Mechanism
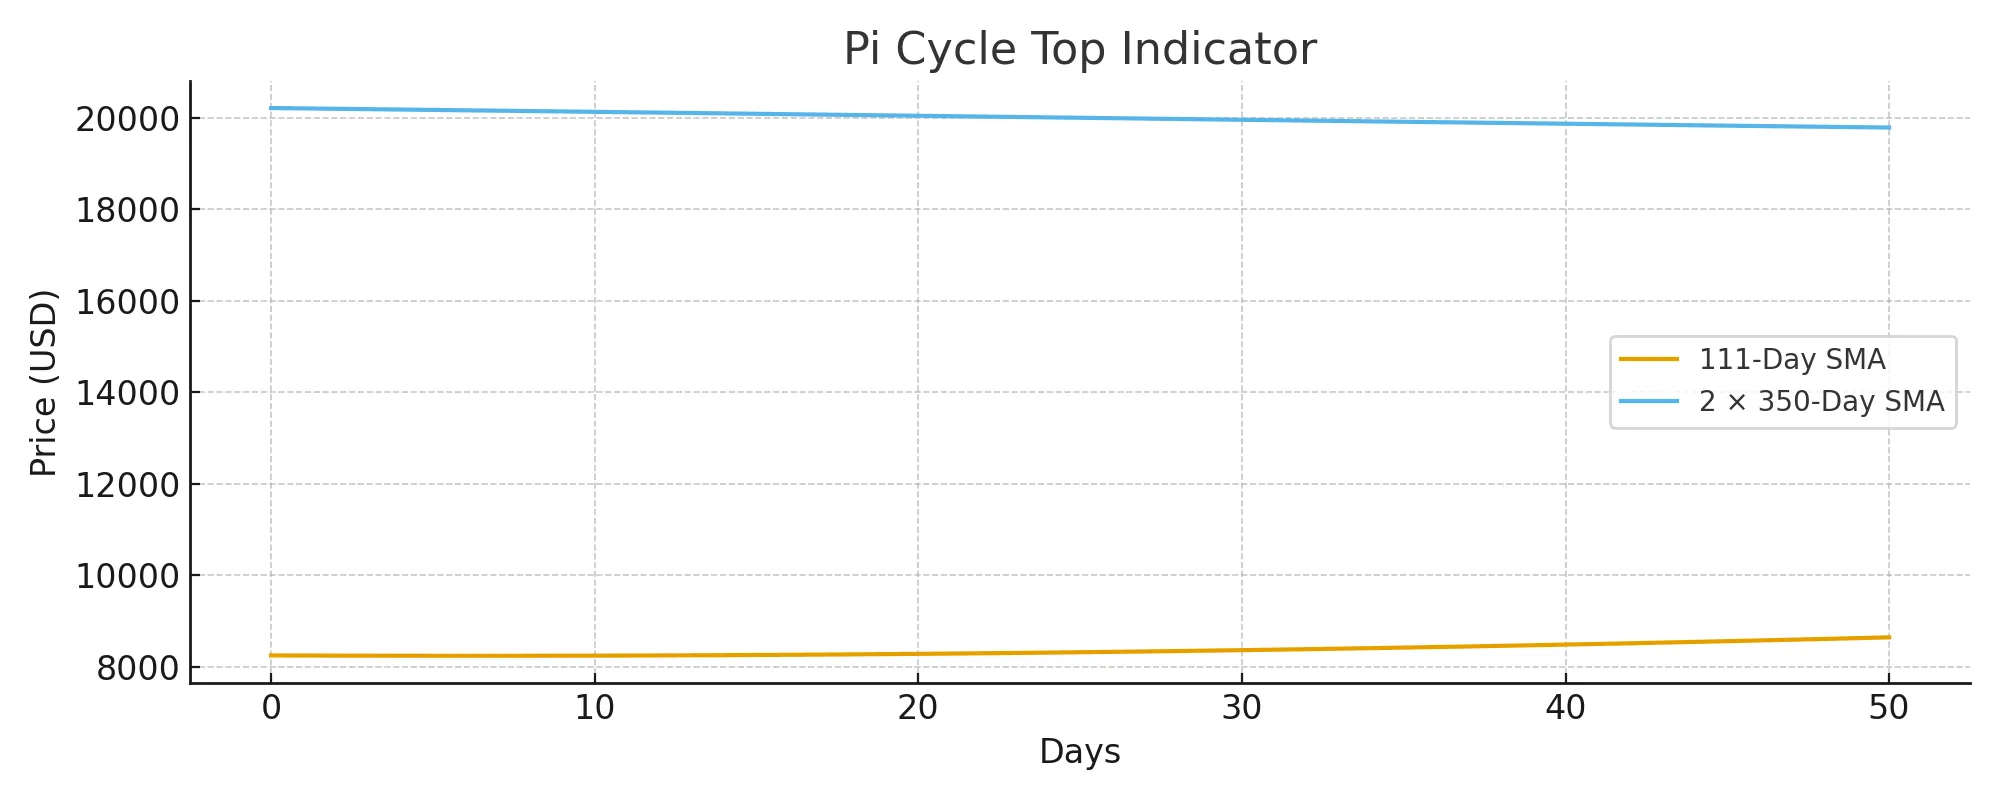
The Pi Cycle Top Indicator operates on a remarkably simple yet effective principle: when Bitcoin’s 111-day moving average crosses above twice the 350-day moving average, a market top signal is triggered. This mathematical relationship leverages the number π (pi) in its calculation, hence the name.
“The beauty of the Pi Cycle Top lies in its simplicity–two moving averages that capture the essence of Bitcoin’s cyclical behavior,” explains Philip Swift, creator of the indicator and founder of LookIntoBitcoin.
Core Components of the Pi Cycle Top
🚀 The Pi Cycle’s crossover signal can be your cue! On Pocket Option, you can act on these signals instantly with Quick Trading to capitalize on potential market peaks. 🚀
Historical Performance and Accuracy Analysis
The Pi Cycle Top Indicator has demonstrated exceptional accuracy across multiple Bitcoin cycles. Historical data reveals that this indicator has successfully identified market peaks within a three-day window of actual tops, making it one of the most precise timing tools available to cryptocurrency traders.
| Cycle Peak Date | Indicator Signal | Bitcoin Price at Signal | Actual Peak Price | Accuracy (Days) |
|---|---|---|---|---|
| April 14, 2021 | April 12, 2021 | $59,600 | $64,800 | -2 days |
| December 17, 2017 | December 15, 2017 | $17,900 | $19,650 | -2 days |
| November 30, 2013 | December 1, 2013 | $1,150 | $1,165 | +1 day |
“The Pi Cycle Top’s track record speaks for itself–three successful predictions across different market environments demonstrate its robustness as a market timing instrument,” notes cryptocurrency analyst Willy Woo.
Calculating the Pi Cycle Top Indicator
Understanding the mathematical foundation enables traders to implement this indicator effectively. The calculation involves computing two distinct moving averages and monitoring their relationship over time.
Step-by-Step Calculation Process
- Calculate 111-Day Simple Moving Average: Sum closing prices for 111 days, divide by 111.
- Calculate 350-Day Simple Moving Average: Sum closing prices for 350 days, divide by 350.
- Apply Multiplier: Multiply 350 SMA by 2.
- Monitor Crossover: Watch for 111 SMA to cross above (2 × 350 SMA).
- Generate Signal: Crossover indicates a potential market top is approaching.
For example, when applying this to Pocket Option’s Quick Trading platform, traders can use these signals to inform their position sizing and exit strategies, though the indicator works best as part of a comprehensive trading strategy.
Implementation Strategies for Modern Traders
Successful application of the Pi Cycle Top Indicator requires understanding its strengths and limitations. While historically accurate, traders should integrate this tool within broader risk management frameworks rather than relying solely on its signals.
| Strategy Component | Implementation | Risk Level | Expected Outcome |
|---|---|---|---|
| Early Warning System | Monitor approaching crossover | Low | Position preparation |
| Partial Profit Taking | Reduce positions on signal | Medium | Preserve gains |
| Complete Exit Strategy | Close all positions | High | Maximize protection |
| Confirmation Tool | Combine with other indicators | Low | Enhanced accuracy |
“Smart traders use the Pi Cycle Top as a warning system rather than a mechanical trading signal–it’s about preparation, not prediction,” advises blockchain researcher Timothy Peterson.
Platform Integration and Practical Applications with Pocket Option
Modern trading platforms have made implementing the Pi Cycle Top Indicator more accessible than ever. Traders on Pocket Option can seamlessly integrate these timing insights into their strategies, especially for timing entries and exits in volatile cryptocurrency markets.
Pocket Option offers a powerful and user-friendly environment:
- Over 100+ Assets: Trade not only Bitcoin but also a wide range of cryptocurrencies, stocks, indices, and commodities.
- Free Demo Account: Practice your strategies with a $50,000 virtual balance without any risk.
- Low Minimum Deposit: Start trading on a real account with a deposit from as little as $5, which may vary depending on your region and payment method.
- Extensive Knowledge Base: Access free tutorials, guides, and strategies to sharpen your skills.
- Community and Tournaments: Engage with other traders, participate in tournaments, and use features like Social Trading to copy the trades of successful users.
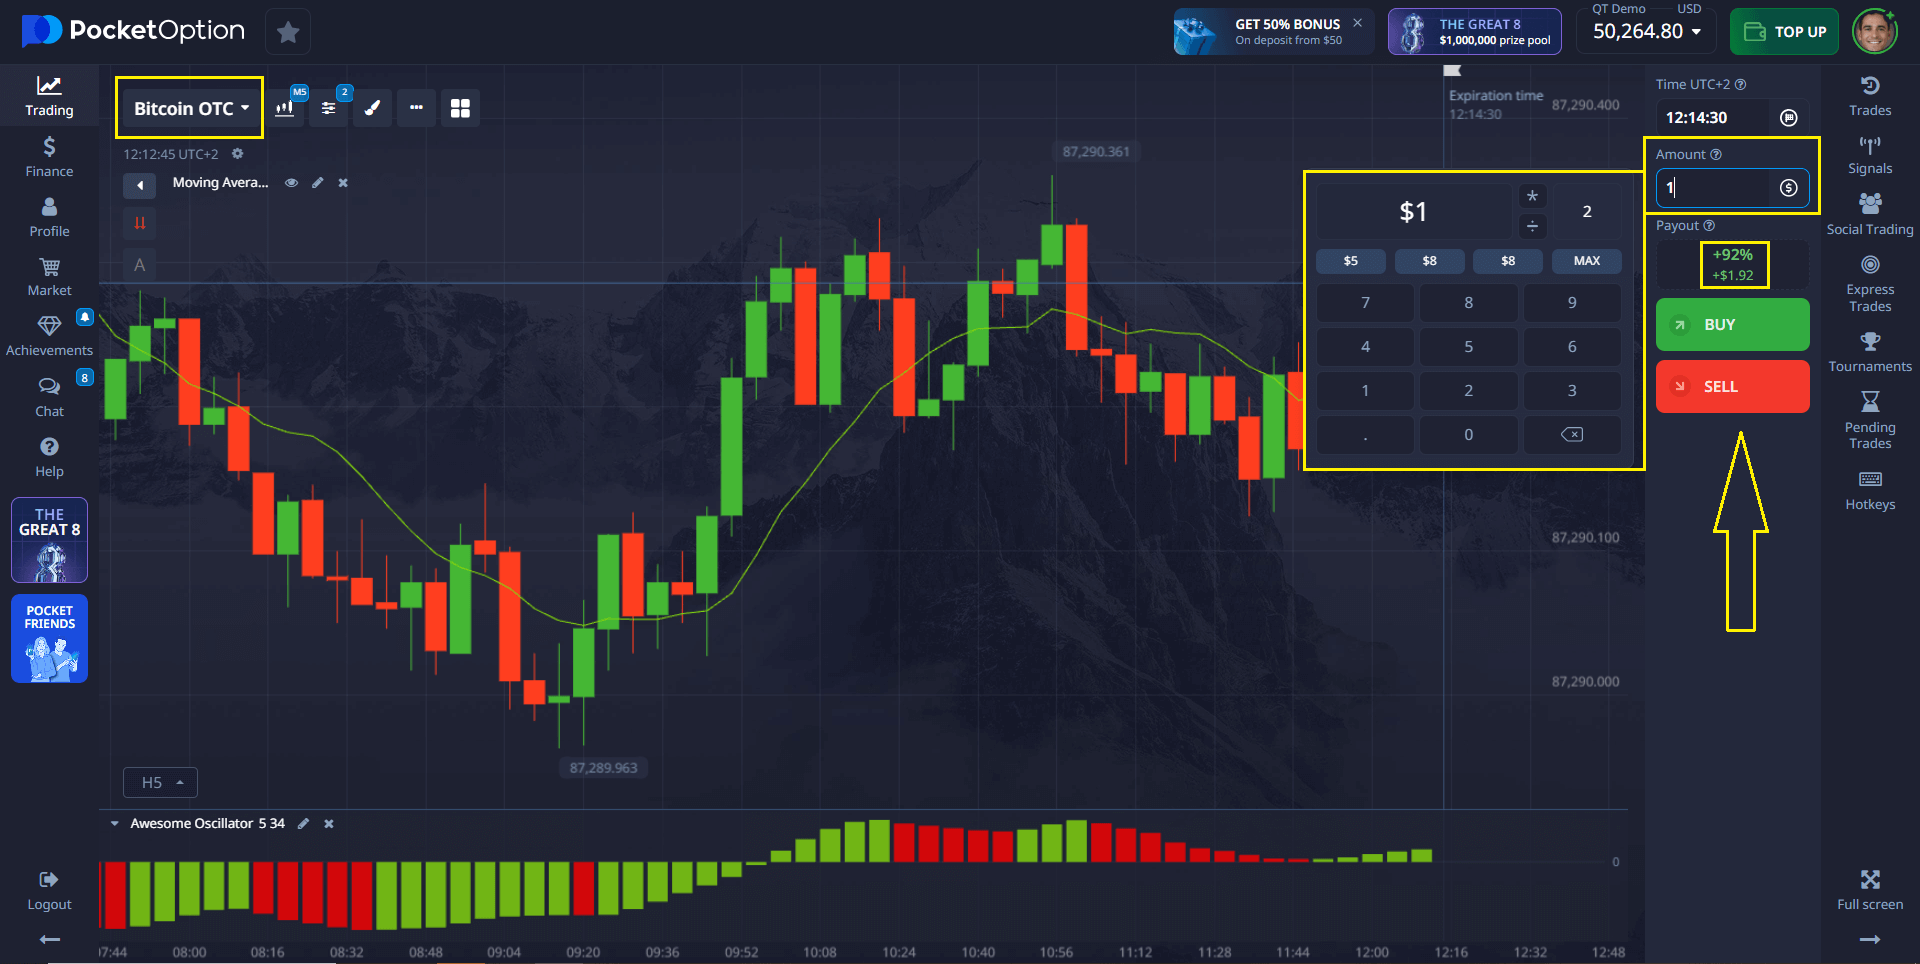
Example: How to Open a Bitcoin Trade on Pocket Option
Let’s see how you can apply this knowledge directly on the platform:
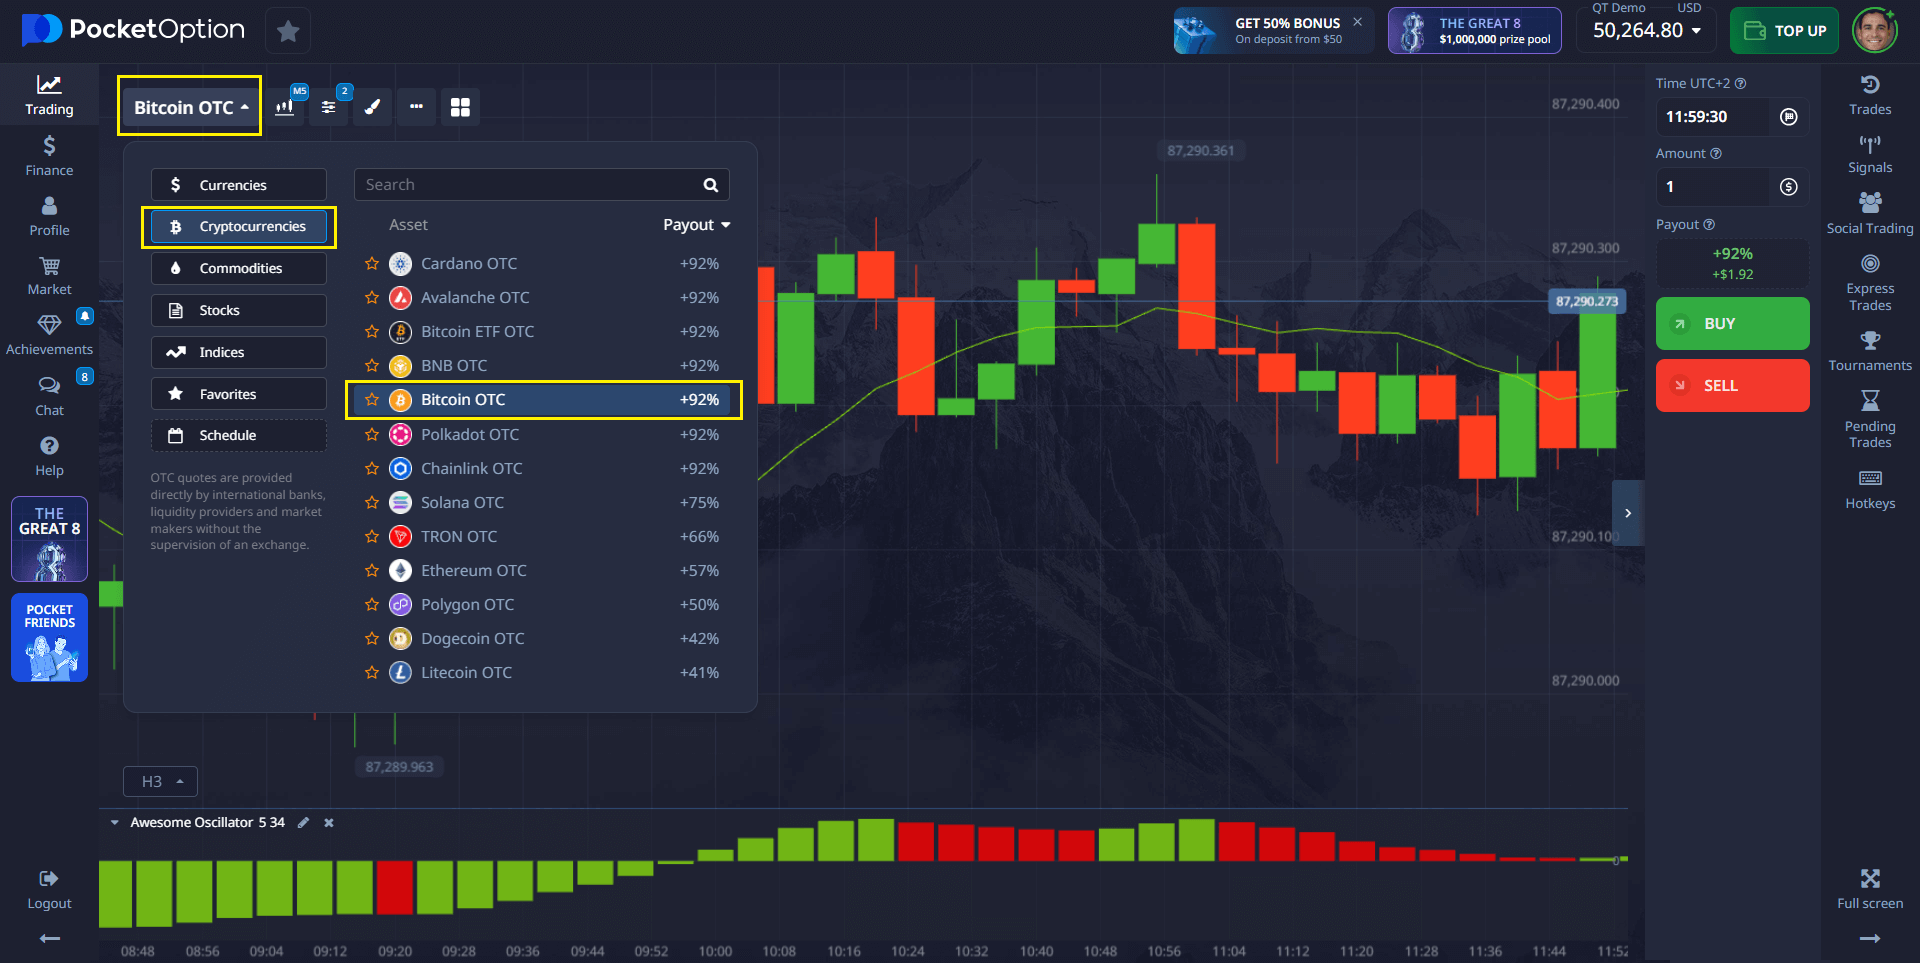
- Choose Your Asset: Select Bitcoin (or Bitcoin OTC for 24/7 trading) from the asset list.
- Analyze the Chart: Use the built-in technical tools on the workspace, like moving averages or the Trader’s Mood indicator, to supplement the Pi Cycle signal.
- Select Your Trade Amount: Enter the amount for your trade, starting from just $1.
- Choose the Trade Time: Select a trade duration, starting from 5 seconds on OTC assets.
- Make Your Prediction: Based on your analysis, predict where the price will go. If you believe it will go up, click BUY. If you think it will go down, click SELL.
- Secure Your Profit: If your forecast is correct, you will receive a profit of up to 92%. This percentage is clearly displayed when you select the asset.
On a real account, you can also benefit from features like copy trading, receive cashback from your trades, and enjoy other exclusive advantages.
💸 Ready to start small? With Pocket Option, you can open a real account with a minimum deposit of just $5 and begin your trading journey with minimal risk. 💸
Limitations and Risk Considerations
Despite its impressive track record, the Pi Cycle Top Indicator faces certain limitations that traders must acknowledge. Understanding these constraints helps maintain realistic expectations and prevents over-reliance on any single analytical tool.
Primary Limitations
- Sample Size: Limited to three historical cycles.
- Market Evolution: Bitcoin’s maturation may affect indicator reliability.
- False Signals: Potential for crossovers without subsequent peaks.
- Timing Precision: Signals may occur days before or after actual peaks.
- External Factors: Cannot account for regulatory or macroeconomic shocks.
💡 The best way to manage risk is to practice. With the Pocket Option free demo account, you can test the Pi Cycle Indicator and other strategies in real market conditions without risking any capital. 💡
“While the Pi Cycle Top has been remarkably accurate, past performance doesn’t guarantee future results–diversification remains key,” cautions risk management expert Nassim Taleb.
FAQ
What makes the Bitcoin Pi Cycle Top Indicator different from other technical indicators?
The Pi Cycle Top Indicator uniquely combines the mathematical constant π with moving averages, creating a timing tool specifically calibrated for Bitcoin's cyclical behavior. Unlike traditional indicators, it focuses exclusively on identifying market peaks rather than general trend direction.
Can the Pi Cycle Top Indicator be applied to other cryptocurrencies?
While designed specifically for Bitcoin, some traders experiment with applying similar principles to major altcoins. However, the indicator's parameters (111 and 350 days) are optimized for Bitcoin's unique market cycles and may not translate effectively to other assets.
How accurate is the Pi Cycle Top Indicator in predicting market peaks?
Historically, the indicator has demonstrated exceptional accuracy, signaling within 2-3 days of actual Bitcoin cycle peaks in 2013, 2017, and 2021. However, this represents only three data points, and future performance may vary as Bitcoin markets evolve.
What should traders do when the Pi Cycle Top signal appears?
Traders typically use the signal as a warning to review their positions, consider profit-taking, and implement risk management strategies. The signal shouldn't trigger automatic selling but rather prompt careful analysis of market conditions and portfolio positioning.
Is it safe to rely solely on the Pi Cycle Top Indicator for trading decisions?
No single indicator should guide all trading decisions. The Pi Cycle Top works best when combined with other analytical tools, fundamental analysis, and comprehensive risk management strategies to create a well-rounded trading approach.
How can beginners start using the Pi Cycle Top Indicator?
Beginners should first understand the underlying mathematics, practice calculating the indicator manually, and study historical examples. Start by using it as an educational tool rather than a trading signal until you fully grasp its implications and limitations.
What happens if the Pi Cycle Top signal proves wrong in future cycles?
As Bitcoin markets mature and institutional adoption increases, the indicator's effectiveness may change. Traders should remain flexible, continuously evaluate its performance, and be prepared to adapt their strategies as market dynamics evolve
Should I sell all my Bitcoin when the Pi Cycle Top Indicator signals?
No, implementing a strategic position reduction rather than a complete exit typically produces optimal results. Professional traders at Pocket Option use a graduated approach: reducing exposure by 20% when the indicator lines come within 5%, another 30% at 2% proximity, and 40-50% upon confirmed crossover, while maintaining a 10-20% core position. This approach protected capital during the 55% correction in 2021 while allowing continued participation in the subsequent recovery to $69,000 in November. Always combine Pi Cycle signals with confirmation indicators like weekly RSI above 92 and MVRV Z-Score above 7.0 for maximum conviction.
Can the Pi Cycle Indicator be used for cryptocurrencies other than Bitcoin?
The Pi Cycle Top Indicator was specifically calibrated for Bitcoin's unique four-year market cycles and has not demonstrated comparable reliability with other cryptocurrencies. The mathematical relationships (111-day and 350-day SMAs) were precisely selected to match Bitcoin's halving-based cyclical pattern. When applied to altcoins, the indicator produces excessive false signals due to their different volatility profiles and market structures. While some traders on Pocket Option have experimented with modified versions for Ethereum and other large-cap cryptocurrencies, these adaptations require substantial recalibration and have not achieved the 85% accuracy rate demonstrated with Bitcoin.
Where can traders access real-time Pi Cycle Top data?
Multiple platforms provide real-time Pi Cycle Top data, including LookIntoBitcoin, Glassnode, and various cryptocurrency charting websites. Many trading platforms also offer customizable indicators that can replicate the Pi Cycle Top calculation.
CONCLUSION
The Bitcoin Pi Cycle Top Indicator represents a sophisticated yet accessible approach to market timing, combining mathematical precision with practical utility. While its historical accuracy is impressive, successful implementation requires understanding both its strengths and limitations within broader trading strategies. As Bitcoin continues evolving from a speculative asset to institutional investment vehicle, tools like the Pi Cycle Top provide valuable insights into market cycles and timing opportunities. The key lies in using this indicator as one component of a comprehensive analytical framework rather than a standalone trading signal. Start Trading with Advanced Indicators Learn More Trading Strategies Looking ahead, the true test of the Pi Cycle Top Indicator will come as Bitcoin enters new market phases, potentially offering traders continued opportunities to optimize their market timing and maximize returns through informed decision-making.
Start tradingAbout the author :
Trading
Sign up for more like this
Customize your newsfeed with content you're actually interested in — get up-to-date personalized newsletter in your inbox.
Your comment
Comments are pre-moderated to ensure they comply with our blog guidelines.

In 2025, blending traditional and innovative strategies emerges as the best way to invest $10,000, aiming to enhance financial growth. The discussion explores multiple paths, providing insights into maximizing returns
1,298
0
0
Trading

High-frequency trading (HFT) is typically associated with institutional investors using advanced algorithms to place thousands of trades in milliseconds. Pocket Option doesn’t offer true HFT infrastructure — but it does
1,714
0
0
Trading