Enterprise Value (EV): Explanation and Calculation
Most retail traders focus on stock price or market cap. That's a mistake. Enterprise value gives you the full picture — what it would actually cost to buy a company outright, including every dollar of debt on its books. Analysts and institutional investors use EV because it strips away capital structure noise and makes companies genuinely comparable. This guide breaks down what EV is, how to calculate it step by step, and how to interpret the result. Whether you're screening stocks or studying a specific company, understanding EV sharpens your analysis.

What Is Enterprise Value (EV)?
Enterprise value represents the total economic value of a company — the theoretical price a buyer would pay to acquire 100% of the business, including all obligations. Unlike market capitalization, EV accounts for debt and subtracts cash, making it a far more accurate measure of what a company is truly worth.
Think of it this way: if you buy a house with a mortgage, the real cost isn't just the purchase price — it's the purchase price plus the outstanding loan. EV applies the same logic to companies. You inherit the debt when you acquire the business, but you also get to keep the cash.
Investors use enterprise value when comparing companies across industries, evaluating acquisition targets, and calculating valuation multiples like EV/EBITDA. Market cap alone doesn't tell you whether a company is cheap or expensive — two firms with identical market caps can have dramatically different EV figures if one carries heavy debt.
Want to practice reading financial data in real trades? Open a free demo account and test your analysis on 100+ assets.
Try Demo AccountBefore putting capital at risk, smart traders spend time on a demo trading account — testing strategies with virtual funds until the analysis feels second nature.
Enterprise Value Formula
The standard enterprise value formula looks like this:
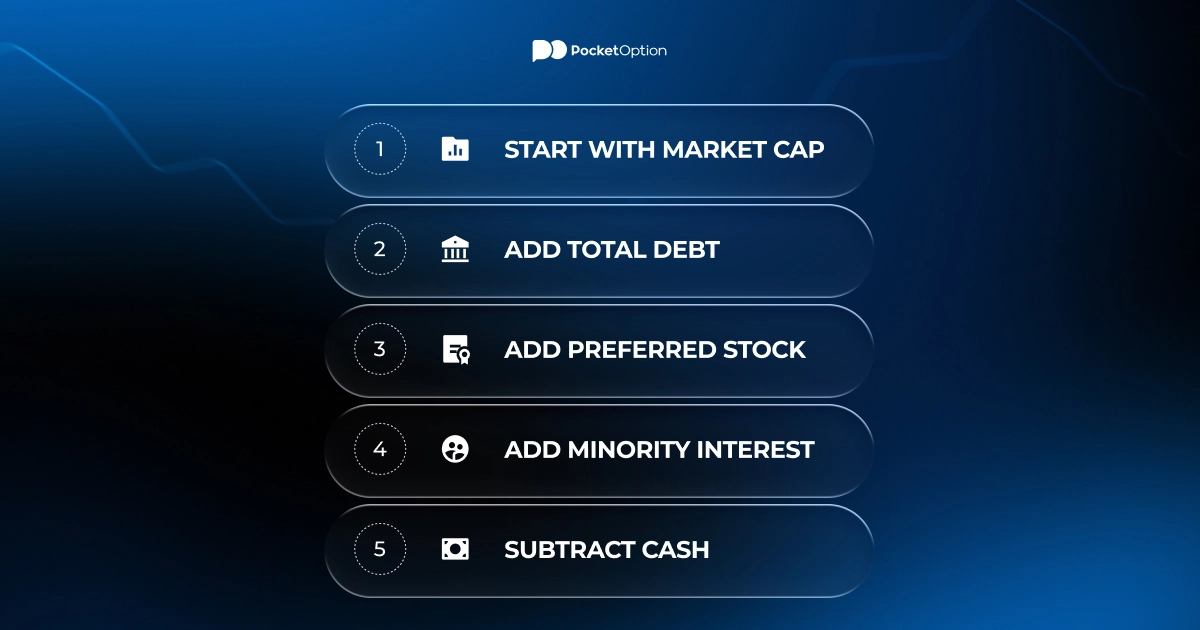
EV = Market Capitalization + Total Debt + Preferred Stock + Minority Interest − Cash and Cash Equivalents
Component | What It Represents | Add or Subtract? |
|---|---|---|
Market Capitalization | Share price × total shares outstanding — what public equity is worth today | Add |
Total Debt | Short-term and long-term borrowings — obligations the acquirer assumes | Add |
Preferred Stock | Hybrid instruments with debt-like features, not included in market cap | Add |
Minority Interest | Non-controlling stakes in subsidiaries — part of enterprise but not in market cap | Add |
Cash & Equivalents | Liquid assets that reduce net acquisition cost | Subtract |
Each component plays a specific role. Debt gets added because any buyer assumes those liabilities. Cash gets subtracted because it offsets part of the purchase price — the buyer effectively gets that cash back after acquisition.
Risk Disclaimer: Trading and investing involve risk of capital loss. This article is for educational purposes only and does not constitute financial advice. Always do your own research before making any investment decisions.
How to Calculate Enterprise Value?
Calculating enterprise value is straightforward once you know where to pull the numbers. Once you understand what is enterprise value at its core — total acquisition cost, not just equity price — the math becomes simple. Here's a step-by-step walkthrough using a real-world style example.
Example company: TechCorp Inc.
Market Cap: $5,000,000,000 (500M shares × $10 per share)
Total Debt: $1,200,000,000 (long-term bonds + short-term loans)
Preferred Stock: $150,000,000
Minority Interest: $80,000,000
Cash & Equivalents: $600,000,000
Step-by-step calculation:
Start with Market Cap: $5,000,000,000
Add Total Debt: $5,000,000,000 + $1,200,000,000 = $6,200,000,000
Add Preferred Stock: $6,200,000,000 + $150,000,000 = $6,350,000,000
Add Minority Interest: $6,350,000,000 + $80,000,000 = $6,430,000,000
Subtract Cash: $6,430,000,000 − $600,000,000 = $5,830,000,000
Result: TechCorp's Enterprise Value = $5.83 billion
Even though market cap is $5B, the real acquisition cost is $5.83B — nearly $830M more. That gap matters enormously in M&A analysis and stock screening.
Enterprise Value vs Market Capitalization
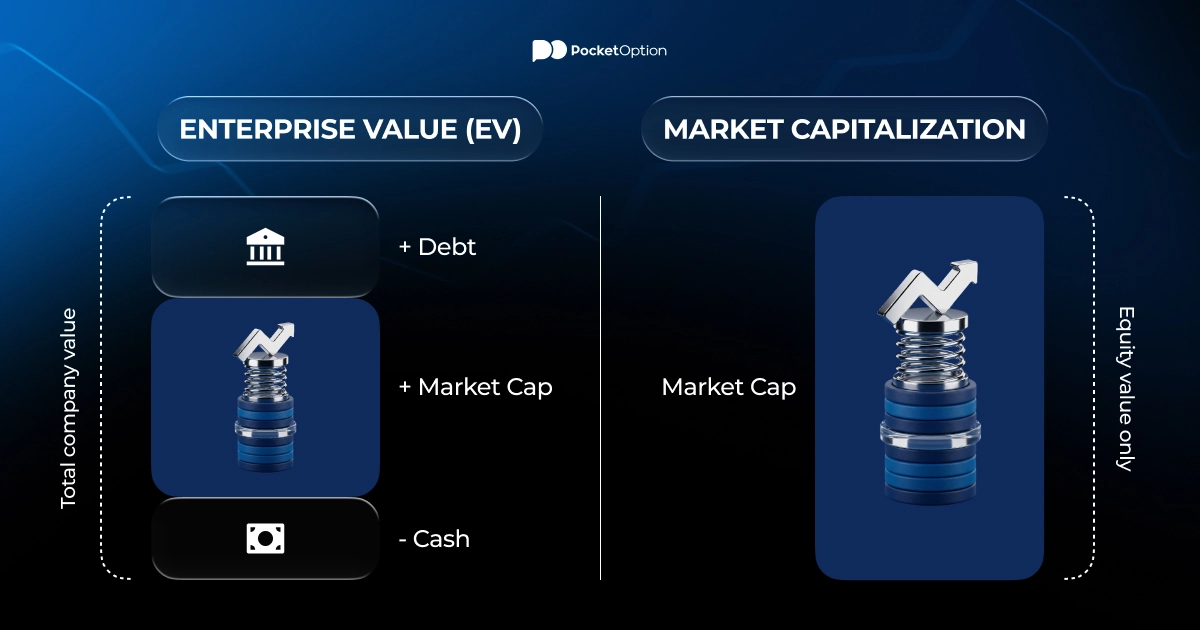
Market capitalization only reflects equity — what shareholders own. Enterprise value captures the entire capital structure. This distinction is critical when comparing companies that use debt very differently.
Two companies can have identical market caps but wildly different enterprise values. Company A with $5B market cap and no debt has EV of roughly $4.5B after cash. Company B with $5B market cap but $3B in debt could have EV above $7B. Same equity price, completely different acquisition cost.
Metric | Enterprise Value (EV) | Market Capitalization |
|---|---|---|
What it measures | Total company value (debt + equity − cash) | Equity value only |
Includes debt? | Yes | No |
Includes cash? | Subtracted | No |
Used for | M&A analysis, EV multiples, cross-company comparison | Quick size reference, index weighting |
Best for comparing | Companies with different capital structures | Companies in same sector with similar leverage |
Can be negative? | Yes, in rare cases | No (price × shares ≥ 0) |
For traders scanning fundamentals, always check enterprise value alongside market cap. A company that looks cheap by market cap can look expensive on EV if it carries significant debt — that's a red flag worth investigating.
Traders who skip the basics often learn them the hard way — through losses. The pocket option tutorial covers everything from account setup to executing your first position, so you start on solid ground.
Popular Valuation Multiples
Raw enterprise value numbers mean little without context. Analysts pair EV with operating metrics to build valuation multiples that allow apples-to-apples comparisons across companies and sectors.
EV/EBITDA
The most widely used EV formula-based multiple. It compares enterprise value to earnings before interest, taxes, depreciation, and amortization — a proxy for operating cash flow. Lower ratios typically indicate cheaper valuation.
Formula: EV / EBITDA
A ratio below 10x is often considered reasonable in mature industries. Tech companies frequently trade at 20x+ due to growth expectations. Always compare within sectors — a 15x EV/EBITDA in retail looks very different from 15x in software.
EV/Sales
EV divided by annual revenue. Useful for pre-profit companies where EBITDA is negative or distorted. Commonly applied in tech, biotech, and early-stage growth companies.
Formula: EV / Revenue
A high EV/Sales ratio signals the market expects strong future growth. A low ratio may indicate undervaluation — or a business in secular decline. Context matters.
Both multiples use enterprise value calculation as the numerator precisely because EV captures total firm value, not just equity. Using market cap instead would produce distorted results for leveraged companies.
Can Enterprise Value Be Negative?
Usually happens in beaten-down small-caps that sold a division, collected a large insurance payout, or sat on cash while the stock fell through the floor. So can enterprise value be negative in a healthy company? Almost never — it's a red flag by definition. The market is saying the operating business itself is worthless, and the only thing of value is the cash.
Example:
Market Cap: $80M
Total Debt: $10M
Cash: $200M
EV = $80M + $10M − $200M = −$110M
A negative EV doesn't automatically mean ""buy."" It often signals operational problems, cash burn, or structural issues the market has already priced in. Some value investors screen specifically for negative EV situations as deep value plays — but due diligence is essential.
Potential Drawbacks and Limitations
No metric is perfect. Enterprise value has blind spots every serious analyst should understand before relying on it.
Snapshot in time: EV uses current market cap, which fluctuates daily. An EV calculated Monday may look very different by Friday if the stock moves significantly.
Off-balance-sheet obligations: Operating leases, pension liabilities, and contingent liabilities may not appear in the standard debt figure — understating true EV.
Cash quality matters: Not all cash is freely available. Some is trapped in subsidiaries abroad or reserved for operational purposes. Treating all cash as accessible can overstate the deduction.
Sector distortions: Financial companies — banks, insurers — have fundamentally different balance sheet structures. Standard EV calculations don't apply cleanly.
Ignores future capex: EV/EBITDA looks backward. Heavy future capital requirements don't show up in the multiple, potentially making capital-intensive businesses look cheaper than they are.
Use enterprise value example analysis as one tool among many. Combine EV multiples with free cash flow analysis, balance sheet quality checks, and qualitative business assessment for a complete picture.
Vedi di più:Knowledge baseLearning