
What is Bitcoin Dominance: Understanding Crypto Market Influence in 2025.
In 2025, bitcoin dominance remains one of the most important indicators in the crypto market. It not only reflects the market share of Bitcoin but also helps traders and analysts detect upcoming shifts in investor sentiment and capital flows. This metric is crucial for understanding whether investors are favoring Bitcoin or moving into altcoins — and knowing how to interpret it can give you a serious edge.

🔍 What Is Bitcoin Dominance?
Bitcoin dominance represents the proportion of the total cryptocurrency market capitalization held by Bitcoin. If the entire crypto market is valued at $2 trillion and Bitcoin accounts for $1 trillion, then Bitcoin’s dominance is 50%.
This value is important because it tells us how much influence Bitcoin has over the broader market. High dominance means most of the market’s value is concentrated in BTC, while a drop in dominance suggests capital is moving toward altcoins.
| Dominance Level | What It Means |
|---|---|
| High (50%--70%) | Bitcoin leads the market -- less risk appetite |
| Low (30%--45%) | Investors are exploring altcoins -- higher risk-taking |
This metric gives traders a sense of where the "market gravity" is at any given time.
📈 Why Bitcoin Dominance Matters in Market Analysis
Bitcoin is often viewed as a "safe haven" in crypto -- similar to gold in traditional finance. When there’s fear or uncertainty, traders often consolidate funds into Bitcoin, boosting its dominance. But when confidence rises, traders chase higher returns in altcoins.
Understanding bitcoin dominance allows you to:
- Detect risk-on vs risk-off market conditions.
- Anticipate altcoin surges or Bitcoin-led rallies.
- Avoid entering the wrong sector at the wrong time.
Example: In late 2020, BTC dominance dropped from 70% to 40%, while Ethereum and other altcoins skyrocketed. Traders who tracked dominance shifts gained early entry into these rallies.
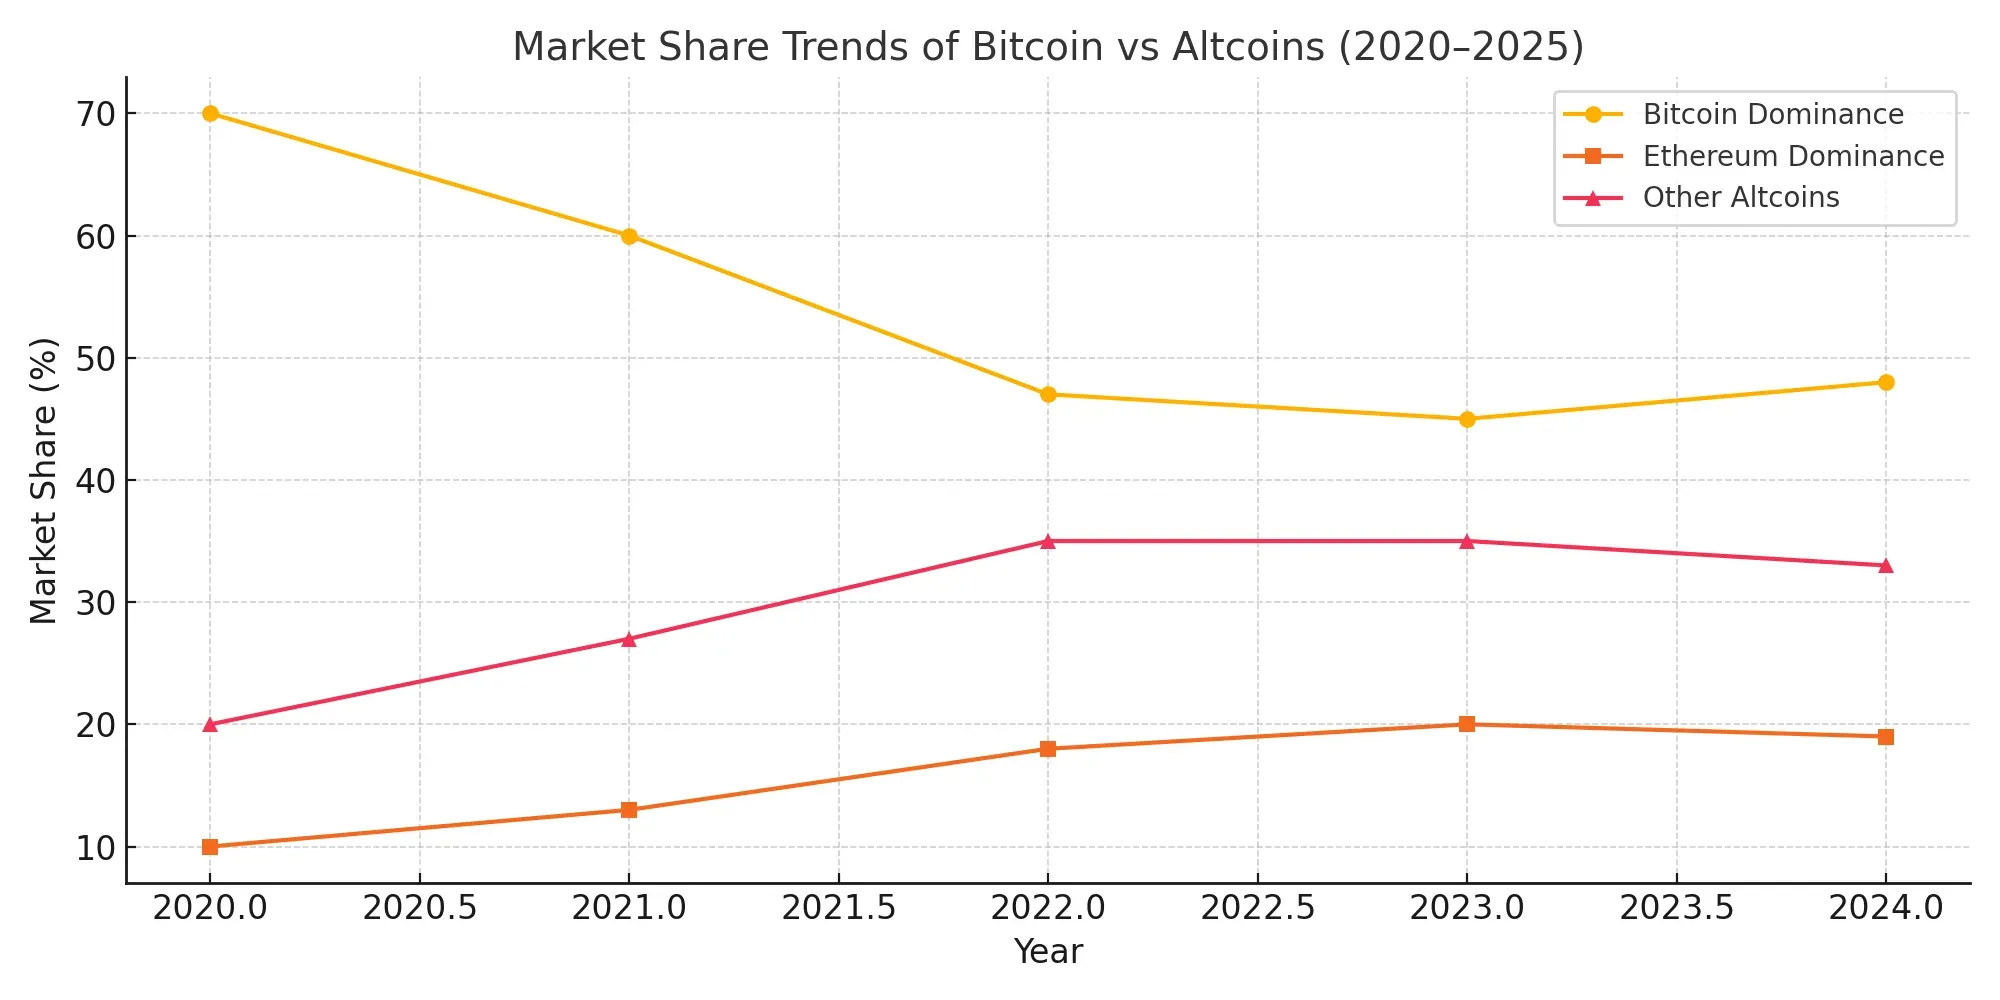
📊 BTC Dominance Chart: How to Use It
How to Read It:
|
Trend on Chart |
Market Signal |
|
BTC dominance rising |
Capital flows back into Bitcoin (often during fear) |
| BTC dominance falling |
Traders are buying altcoins — possible altseason ahead |
When used with volume and momentum indicators like RSI or MACD, the BTC dominance chart helps you identify turning points.
🌐 What Is Altcoin Season?
An altcoin season occurs when most altcoins significantly outperform Bitcoin over a period of time -- usually when BTC dominance drops sharply.
Traders use the altcoin season indicator, such as BlockchainCenter’s tool, which shows how many of the top 50 altcoins outperformed BTC over the last 90 days. If more than 75% have, it's considered an altseason.
| Altseason Signal | Interpretation |
|---|---|
| 75% of altcoins gain | Altseason confirmed -- expect further altcoin growth |
| <50% gain | BTC remains dominant -- altcoin risk is higher |
Knowing when to rotate your portfolio from BTC into ETH, SOL, or XRP depends heavily on this analysis.
🔄 BTC vs Altcoins: The Correlation Game
Altcoins often follow Bitcoin but with higher volatility. However, during certain periods -- like consolidations or post-BTC rallies -- altcoins begin to diverge and outperform.
Examples of Divergence:
- Ethereum surging while Bitcoin trades sideways.
- DeFi coins rallying during Bitcoin consolidation.
- Layer 1 tokens gaining traction in response to new tech developments.
This divergence typically coincides with a drop in bitcoin market share, making it a critical signal for switching trading strategies.
📉 What Happens When Bitcoin Dominance Drops?
When Bitcoin's dominance decreases:
- Altcoins attract capital: Traders seek faster-growing assets.
- Market volatility increases: More speculative coins gain traction.
- Diversification becomes key: BTC no longer leads every move.
For example, in Q1 2021, Bitcoin’s dominance fell under 40%, and projects like Cardano, Dogecoin, and Polygon saw price increases of over 500%.
This is why investors track btc dominance trading signals as part of their decision-making process.
🔁 Market Movements & Volatility
Bitcoin dominance moves in cycles:
- During crashes or macroeconomic fear, BTC dominance rises.
- During market euphoria, altcoins outperform and BTC dominance falls.
| Scenario | Effect on Market |
|---|---|
| BTC Dominance ↑ | Altcoins underperform; capital consolidates |
| BTC Dominance ↓ | Altcoins boom; more speculative behavior |
Understanding this cycle allows you to rebalance your portfolio based on changing crypto market cap ratio dynamics.
🧠 Pro tip: Combine BTC dominance readings with inverted flag pattern or reverse flag pattern on altcoins to catch breakout moves.
💡 Bitcoin, Ethereum, XRP -- A Comparative Look
|
Cryptocurrency |
Market Role |
Key Strengths |
|
Bitcoin (BTC) |
Digital gold, market leader | High liquidity, safe haven, global recognition |
|
Ethereum (ETH) |
Smart contracts, DeFi infrastructure |
Innovation leader, scalable applications |
| XRP | Payments and settlements |
Fast, low fees, strong bank partnerships |
As Bitcoin dominance shifts, capital rotates between these top assets. Use this data to anticipate which crypto may lead the next wave.
🧮 Understanding Market Cap and Its Role in Dominance
Market capitalization = current price × circulating supply. It helps measure a crypto asset’s value relative to the entire crypto space.
When the crypto market cap ratio grows rapidly (especially in altcoins), BTC dominance usually declines -- even if Bitcoin itself is rising
| Factor Affecting Dominance | Impact on Bitcoin |
|---|---|
| New altcoins gaining traction | BTC dominance drops |
| Institutional focus on BTC | BTC dominance rises |
📌 This helps traders determine if Bitcoin's dominance changes due to its strength or altcoin expansion.
🛠 Bitcoin Dominance Trading Strategy
So, what is bitcoin dominance trading strategy? It means using dominance levels to adjust asset allocation based on risk-reward conditions.
Core Tactics:
- Buy BTC when dominance breaks upward.
- Buy altcoins when dominance breaks downward.
- Exit altcoins when dominance recovers sharply.
- Use altcoin season indicators to confirm timing.
💼 Combining dominance analysis with price action and sentiment indicators can sharpen your strategy.
📲 Pocket Option: Trade With Market Awareness
Want to put all this to use? At Pocket Option, you can:
- 📉 Trade Bitcoin, Ethereum, XRP, and 100+ assets (including stocks) 24/7.
- 📲 Use mobile or web platform -- fast execution, clean interface.
- 🛠 Access technical tools: RSI, MACD, trendlines, BTC dominance overlays.
- 🚀 Explore social trading, AI bots, and Telegram signal alerts.
Whether you're analyzing btc dominance chart or planning a reverse flag pattern setup -- Pocket Option provides everything you need.
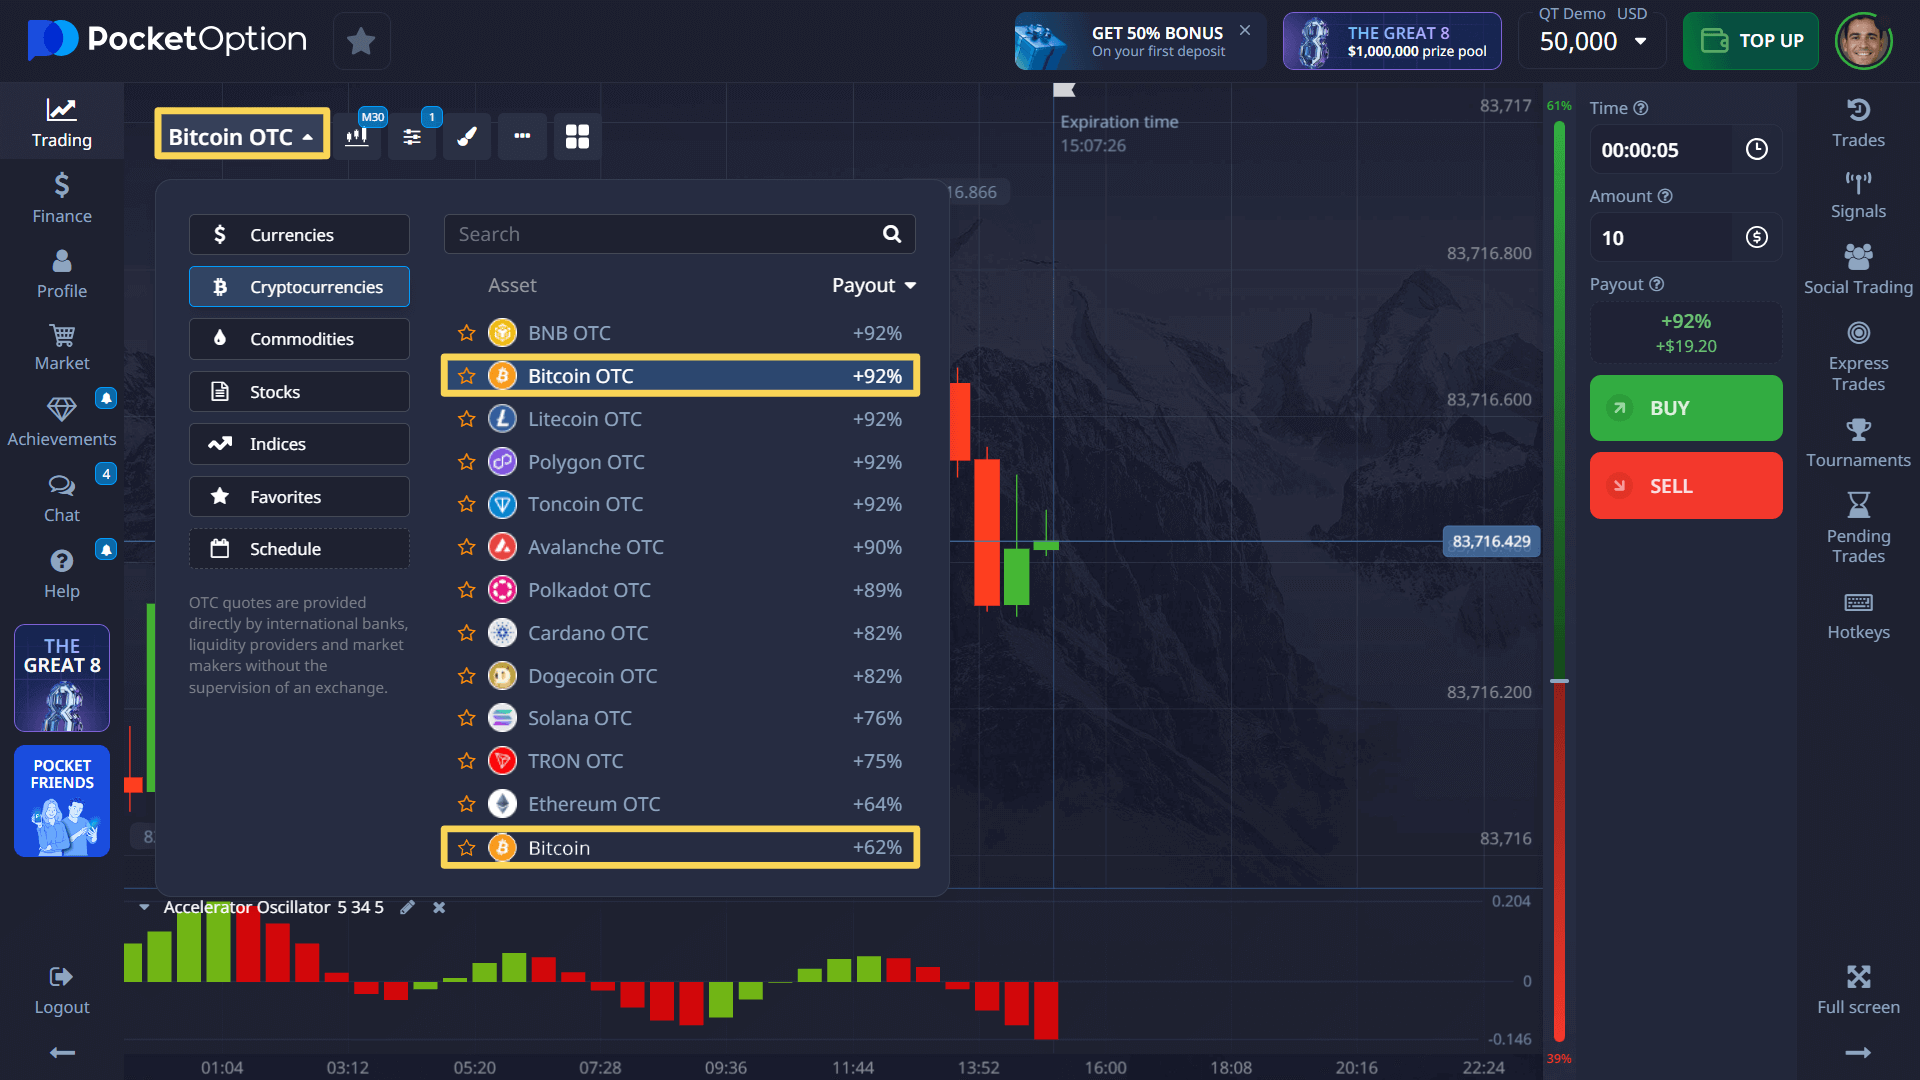
🧰 Pocket Option Features for Crypto Traders
- ✅ 100+ tradable assets (crypto, stocks, commodities)
- ✅ Fast OTC trading with high payouts
- ✅ AI-based bots and auto-trading tools
- ✅ Telegram Signal Bot integration for live alerts
- ✅ Copy trades from successful users (Social Trading)
- ✅ Up to 92% return per trade
- ✅ Regular tournaments and trading competitions
🧭 Final Thoughts: Why Bitcoin Dominance Remains a Key Indicator
Whether you're managing your first crypto portfolio or running multiple strategies, bitcoin dominance is one of the clearest indicators to track:
- It shows where market confidence lies.
- It predicts altcoin rotations and volatility shifts.
- It helps traders stay ahead of broader sentiment trends.
By following the btc dominance chart, understanding the crypto market cap ratio, and using tools like the altcoin season indicator, you can make smarter, faster, and more profitable decisions in crypto.
Ready to take your trading further?
ดูเพิ่มเติม:strategyplatformcryptoKnowledge baseLearning