
What Is a Fractal in Trading: Understanding Patterns for Market Reversals
Understanding what is a fractal in trading is essential for anyone seeking to identify potential turning points in market trends. A fractal in trading is a recurring price pattern that signals a likely reversal in price direction. Recognizing these patterns can help traders make more informed decisions about when to enter or exit trades. This article explores the concept of fractals, how they form, their mathematical foundation, and practical ways to use them on trading platforms like Pocket Option.
The Basic Concept of a Fractal in Trading
A fractal in trading is typically defined by a pattern involving five consecutive bars or candlesticks. The center bar must represent either the highest high or the lowest low compared to the two bars on either side. Such patterns mark potential reversal points on a price chart:
- Bearish Fractal (Top fractal): The middle bar has the highest high, signaling a possible downward reversal.
- Bullish Fractal (Bottom fractal): The middle bar has the lowest low, indicating a potential upward reversal.
These formations help traders spot when a current trend might be ending or pausing.
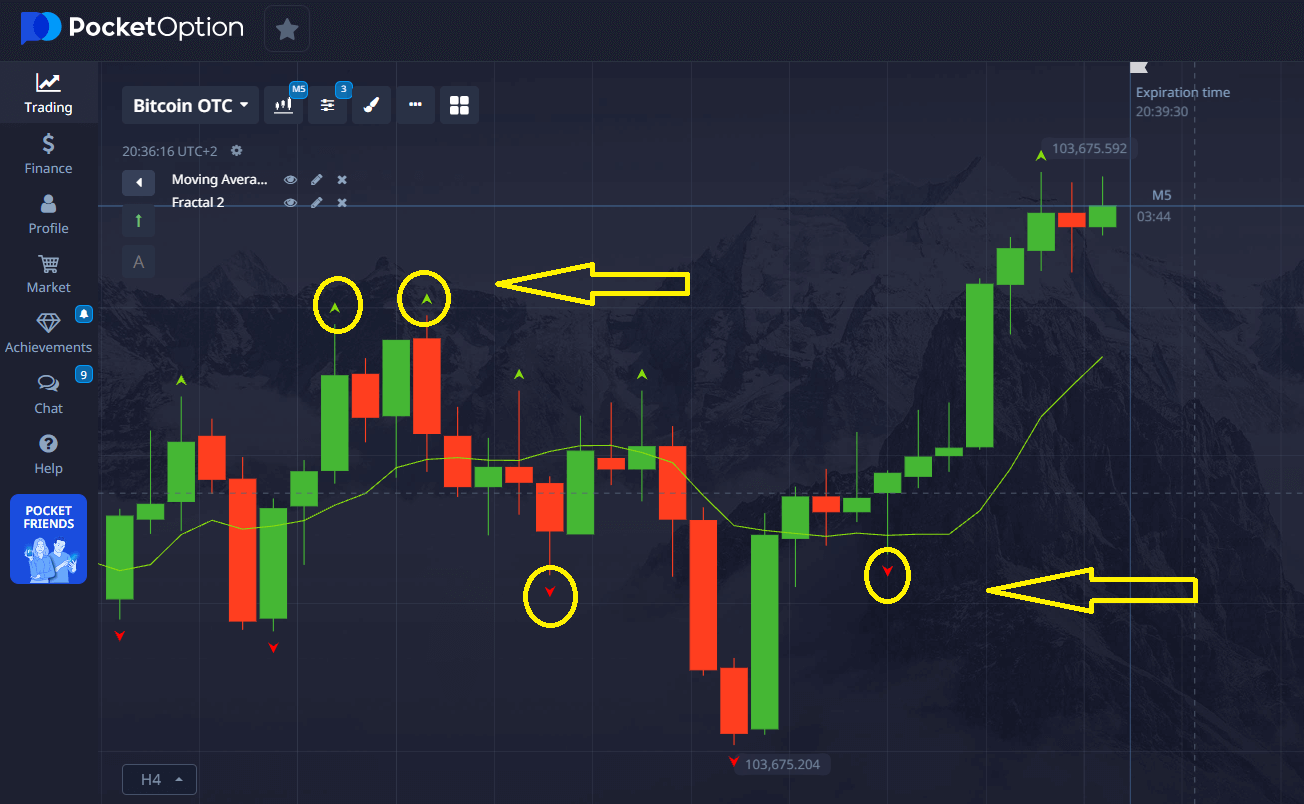
Fractals on Pocket Option
The Mathematical Foundation of Trading Fractals
Fractals stem from mathematical patterns known for their self-similarity at different scales. In financial markets, fractals represent price structures that repeat across timeframes, such as minutes, hours, or days. This property allows fractal patterns to maintain relevance regardless of the chosen chart scale.
| Fractal Type | Formation Pattern | Market Indication |
|---|---|---|
| Bullish Fractal | Low point preceded and followed by higher lows | Potential upward reversal |
| Bearish Fractal | High point preceded and followed by lower highs | Potential downward reversal |
How to Identify Fractals on Trading Charts
Identifying fractals involves analyzing price data to spot the specific five-bar pattern. Traders can apply fractal indicators available on most platforms, including Pocket Option, which highlight these patterns automatically.
Manual identification requires checking the highs and lows of five consecutive bars and confirming if the middle bar stands out as the highest or lowest.
Steps to Detect Fractals:
- Review at least five consecutive candlesticks or bars.
- Confirm the middle bar's high or low against two bars on each side.
- Note the fractal type (bullish or bearish) based on the pattern.
Using Fractals in Trading Strategies on Pocket Option
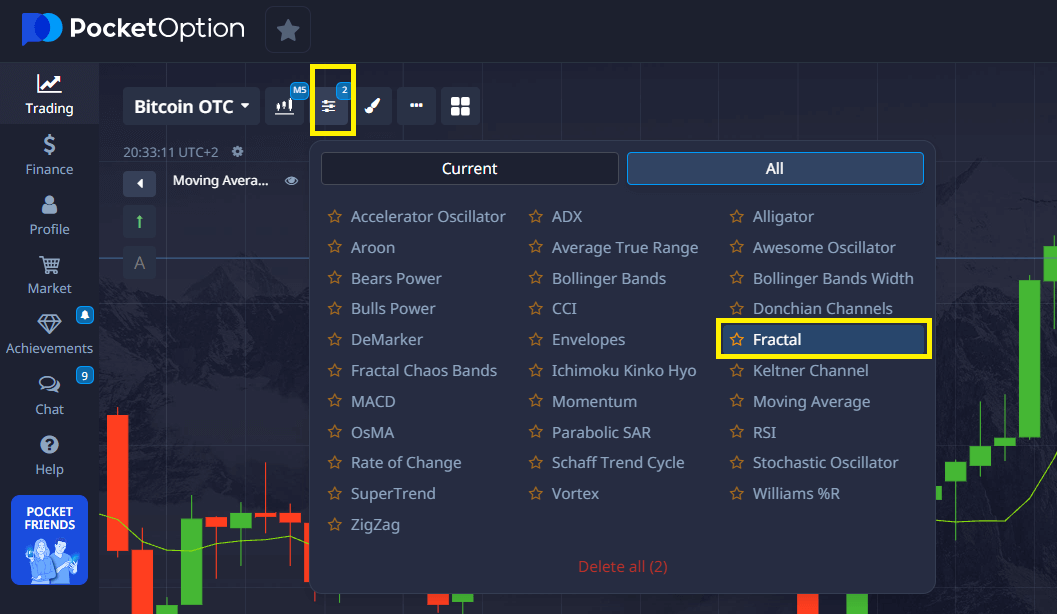
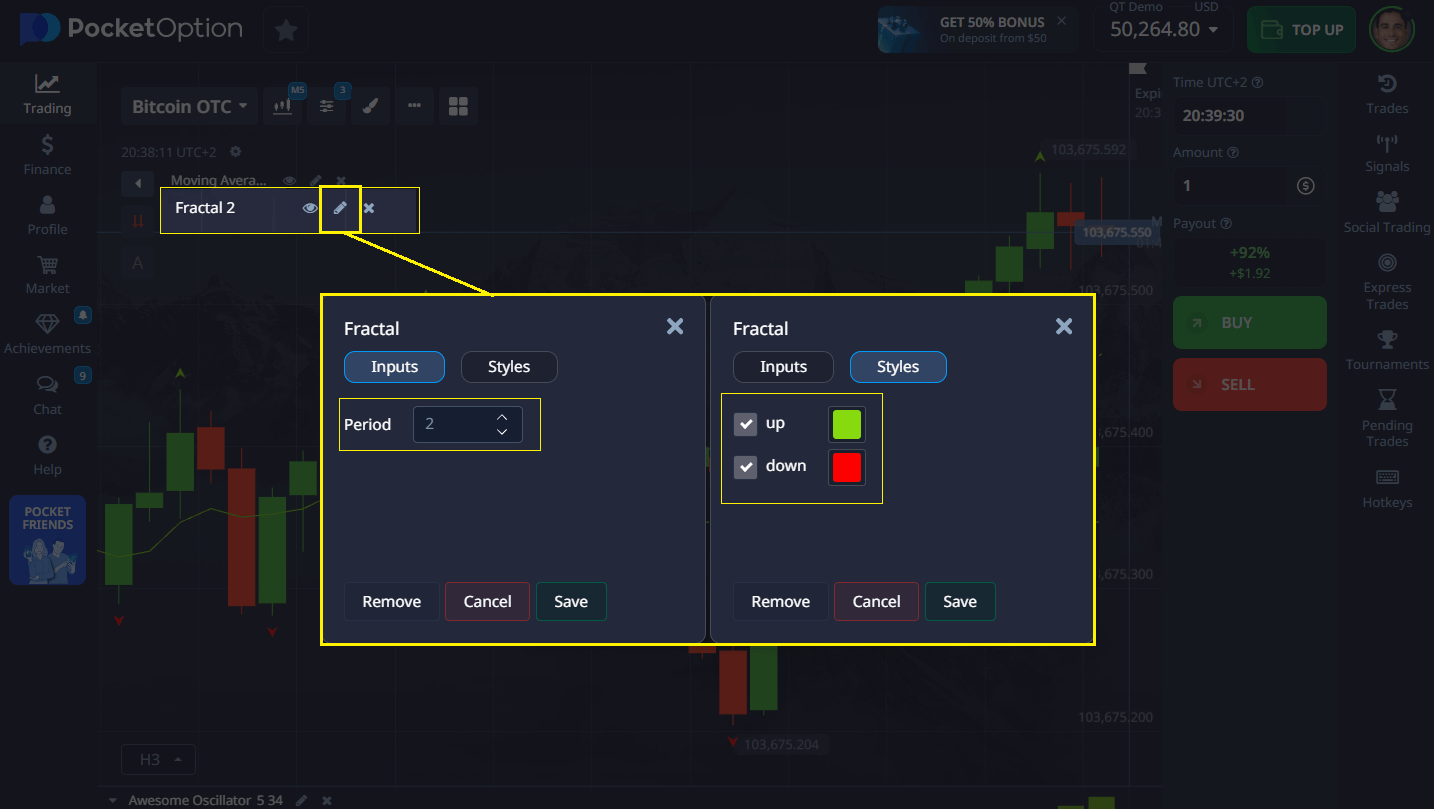
Pocket Option offers advanced charting tools, including fractal indicators that automatically mark fractal patterns on your trading charts. This feature simplifies the process and helps to monitor market conditions in real time.
To improve decision-making, it is recommended to combine fractals with other analytical tools such as:
- Support and resistance levels
- Moving averages
- Volume indicators
This combination can filter false signals and provide a clearer picture of market dynamics.
Collecting and Analyzing Fractal Data
Effective fractal trading requires gathering and analyzing data across multiple timeframes. This process ensures the reliability of fractal signals.
Key steps include:
- Gathering historical price data for the asset
- Applying fractal indicators on different timeframes
- Confirming fractal patterns through cross-timeframe analysis
- Recording signal success rates to adjust strategies
| Data Collection Step | Purpose | Implementation Method |
|---|---|---|
| Price History Compilation | Establish baseline data | API connections or manual downloads |
| Timeframe Selection | Define analysis granularity | Compare charts across 1H, 4H, 1D |
| Pattern Recognition | Identify fractal formations | Use automated fractal indicators or visual checks |
More about Fractals on Pocket Option
Key Metrics to Evaluate Fractal Signals
Traders should consider specific metrics when analyzing fractals to determine signal strength and reliability:
- Fractal Dimension: Measures price complexity; values indicate trending or choppy markets.
- Signal Strength: Ratio comparing central bar high/low to surrounding bars to assess validity.
- Confirmation Time: Period until the fractal pattern is validated by subsequent price action.
- Success Rate: Percentage of fractals correctly predicting reversals.
| Metric | Calculation Method | Interpretation |
|---|---|---|
| Fractal Dimension | Box-counting method: N(s) = Cs-D | 1.3–1.5 indicates trending; >1.5 signals a choppy market |
| Signal Strength | (High/Low of central bar) ÷ (Average of surrounding bars) | >1.05 strong signal; <1.02 weak signal |
Practical Example of a Bearish Fractal
Consider five bars with the following high prices:
| Bar | High Price | Notes |
|---|---|---|
| 1 | 1.2340 | First bar |
| 2 | 1.2355 | Second bar |
| 3 | 1.2380 | Middle bar – highest high |
| 4 | 1.2360 | Fourth bar |
| 5 | 1.2345 | Fifth bar |
The middle bar forms a bearish fractal because its high (1.2380) surpasses highs of the two preceding and two following bars, suggesting a possible downward reversal.
Fractals in Different Market Conditions
| Market Condition | Fractal Role | Recommended Indicators |
|---|---|---|
| Trending | Identify pullbacks and trend continuation points | Moving Averages, RSI |
| Consolidation | Mark support and resistance boundaries | Bollinger Bands, Volume |
| Volatile | Multiple fractals form, filter with confirmation | ATR, Volume |
Limitations of Fractal Analysis
Fractals are not foolproof. They rely on past price patterns and may generate false signals, especially in highly volatile or manipulated markets. Combining fractals with other indicators and risk management techniques is necessary to avoid poor trade decisions.
Moreover, fractals often confirm reversals only after the price has started to move, which may lead to late entries.
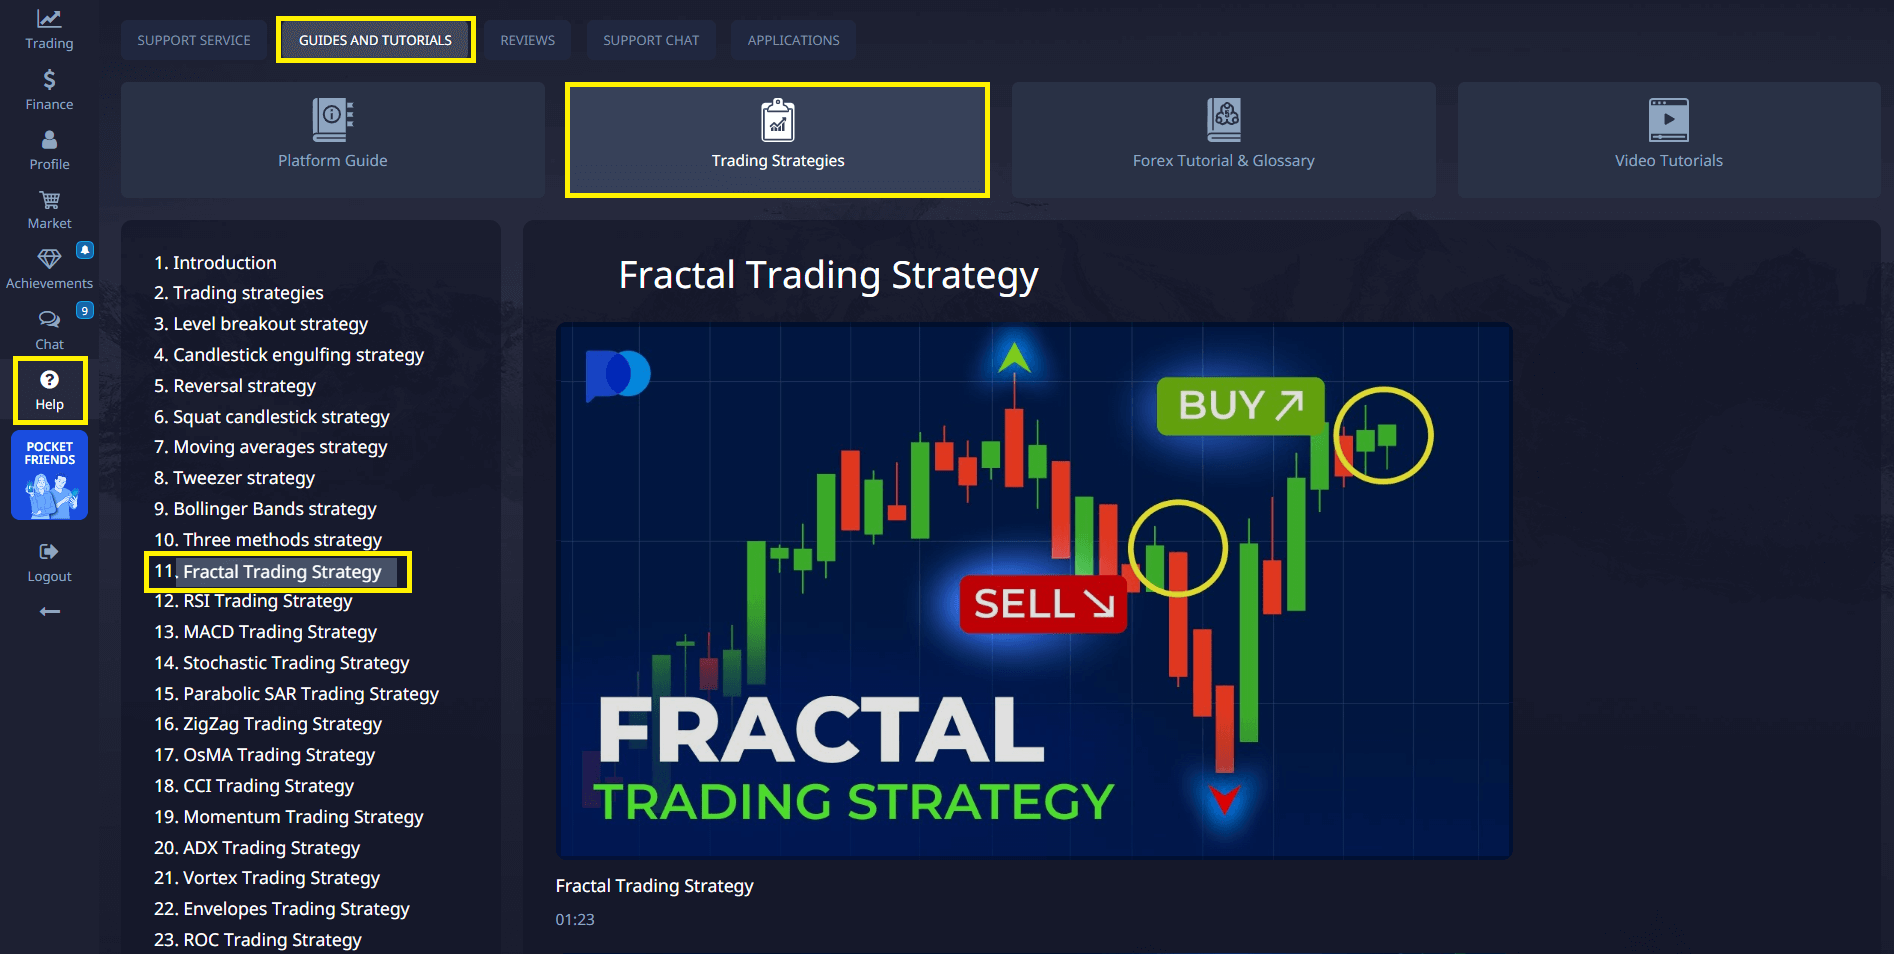
More about Fractals strategy on Pocket Option
Using Pocket Option for Fractal Trading
Pocket Option’s charting tools simplify fractal identification. The platform provides easy integration of fractal indicators alongside other technical tools. This enables users to monitor fractal signals in real time and make better-informed trading decisions.
For beginners, practicing fractal strategies on the demo account allows testing without financial risk.
Conclusion
Understanding what is a fractal in trading equips traders with a mathematical and practical method to spot potential market reversals. While fractals are useful in various market conditions, relying solely on them can be risky. Effective use involves combining fractal signals with other tools and maintaining strict risk management. Pocket Option’s platform offers accessible fractal indicators and resources for traders to apply these patterns efficiently.