
Three Drives Pattern: How to Identify Bullish and Bearish Reversals
Three Drives is a harmonic formation of three pushes in one direction with two corrections between them. Here is how the structure works, which Fibonacci ratios traders cite, how bullish and bearish versions differ, how to identify it, and where it falls short.

Three pushes up. Two pauses between them. Each push a little more tired than the last. Stare at charts long enough and you'll see this shape everywhere. Sometimes it's real. Often it's wishful thinking. That's the whole difficulty of Three Drives.
What Is the Three Drives Pattern?
Strip away the jargon and the three drives pattern is a harmonic setup built from five moves. Three pushes in one direction. Two pullbacks wedged between them. Price climbs. Retreats. Climbs a bit higher. Retreats again. Then one last lunge. The idea is gradual exhaustion. The trend keeps going, but every leg follows a measured rhythm. The third one may mark a turning zone.
Notice the word may. Traders treat the formation as a potential reversal setup. Not a promise. It isn't a tour of every harmonic shape either. One formation, one job: flag a possible stall. Spotting a three drives pattern takes discipline. Calling it too early takes only enthusiasm.
Open a demo account and practice marking swings on live charts.
Try Demo AccountShapes look cleaner on paper than on a live chart.
Try this. Open a demo account. Scroll through a few charts with virtual funds. Hunt for a three drives pattern. You'll find candidates fast. Then apply the rules below. Watch most candidates fall apart. Count how many survive. Write down why each one dies. That sorting exercise is the real education. It costs nothing.
Keep a notebook during demo trading and mark every candidate you reject.
How the Three Drives Pattern Is Structured
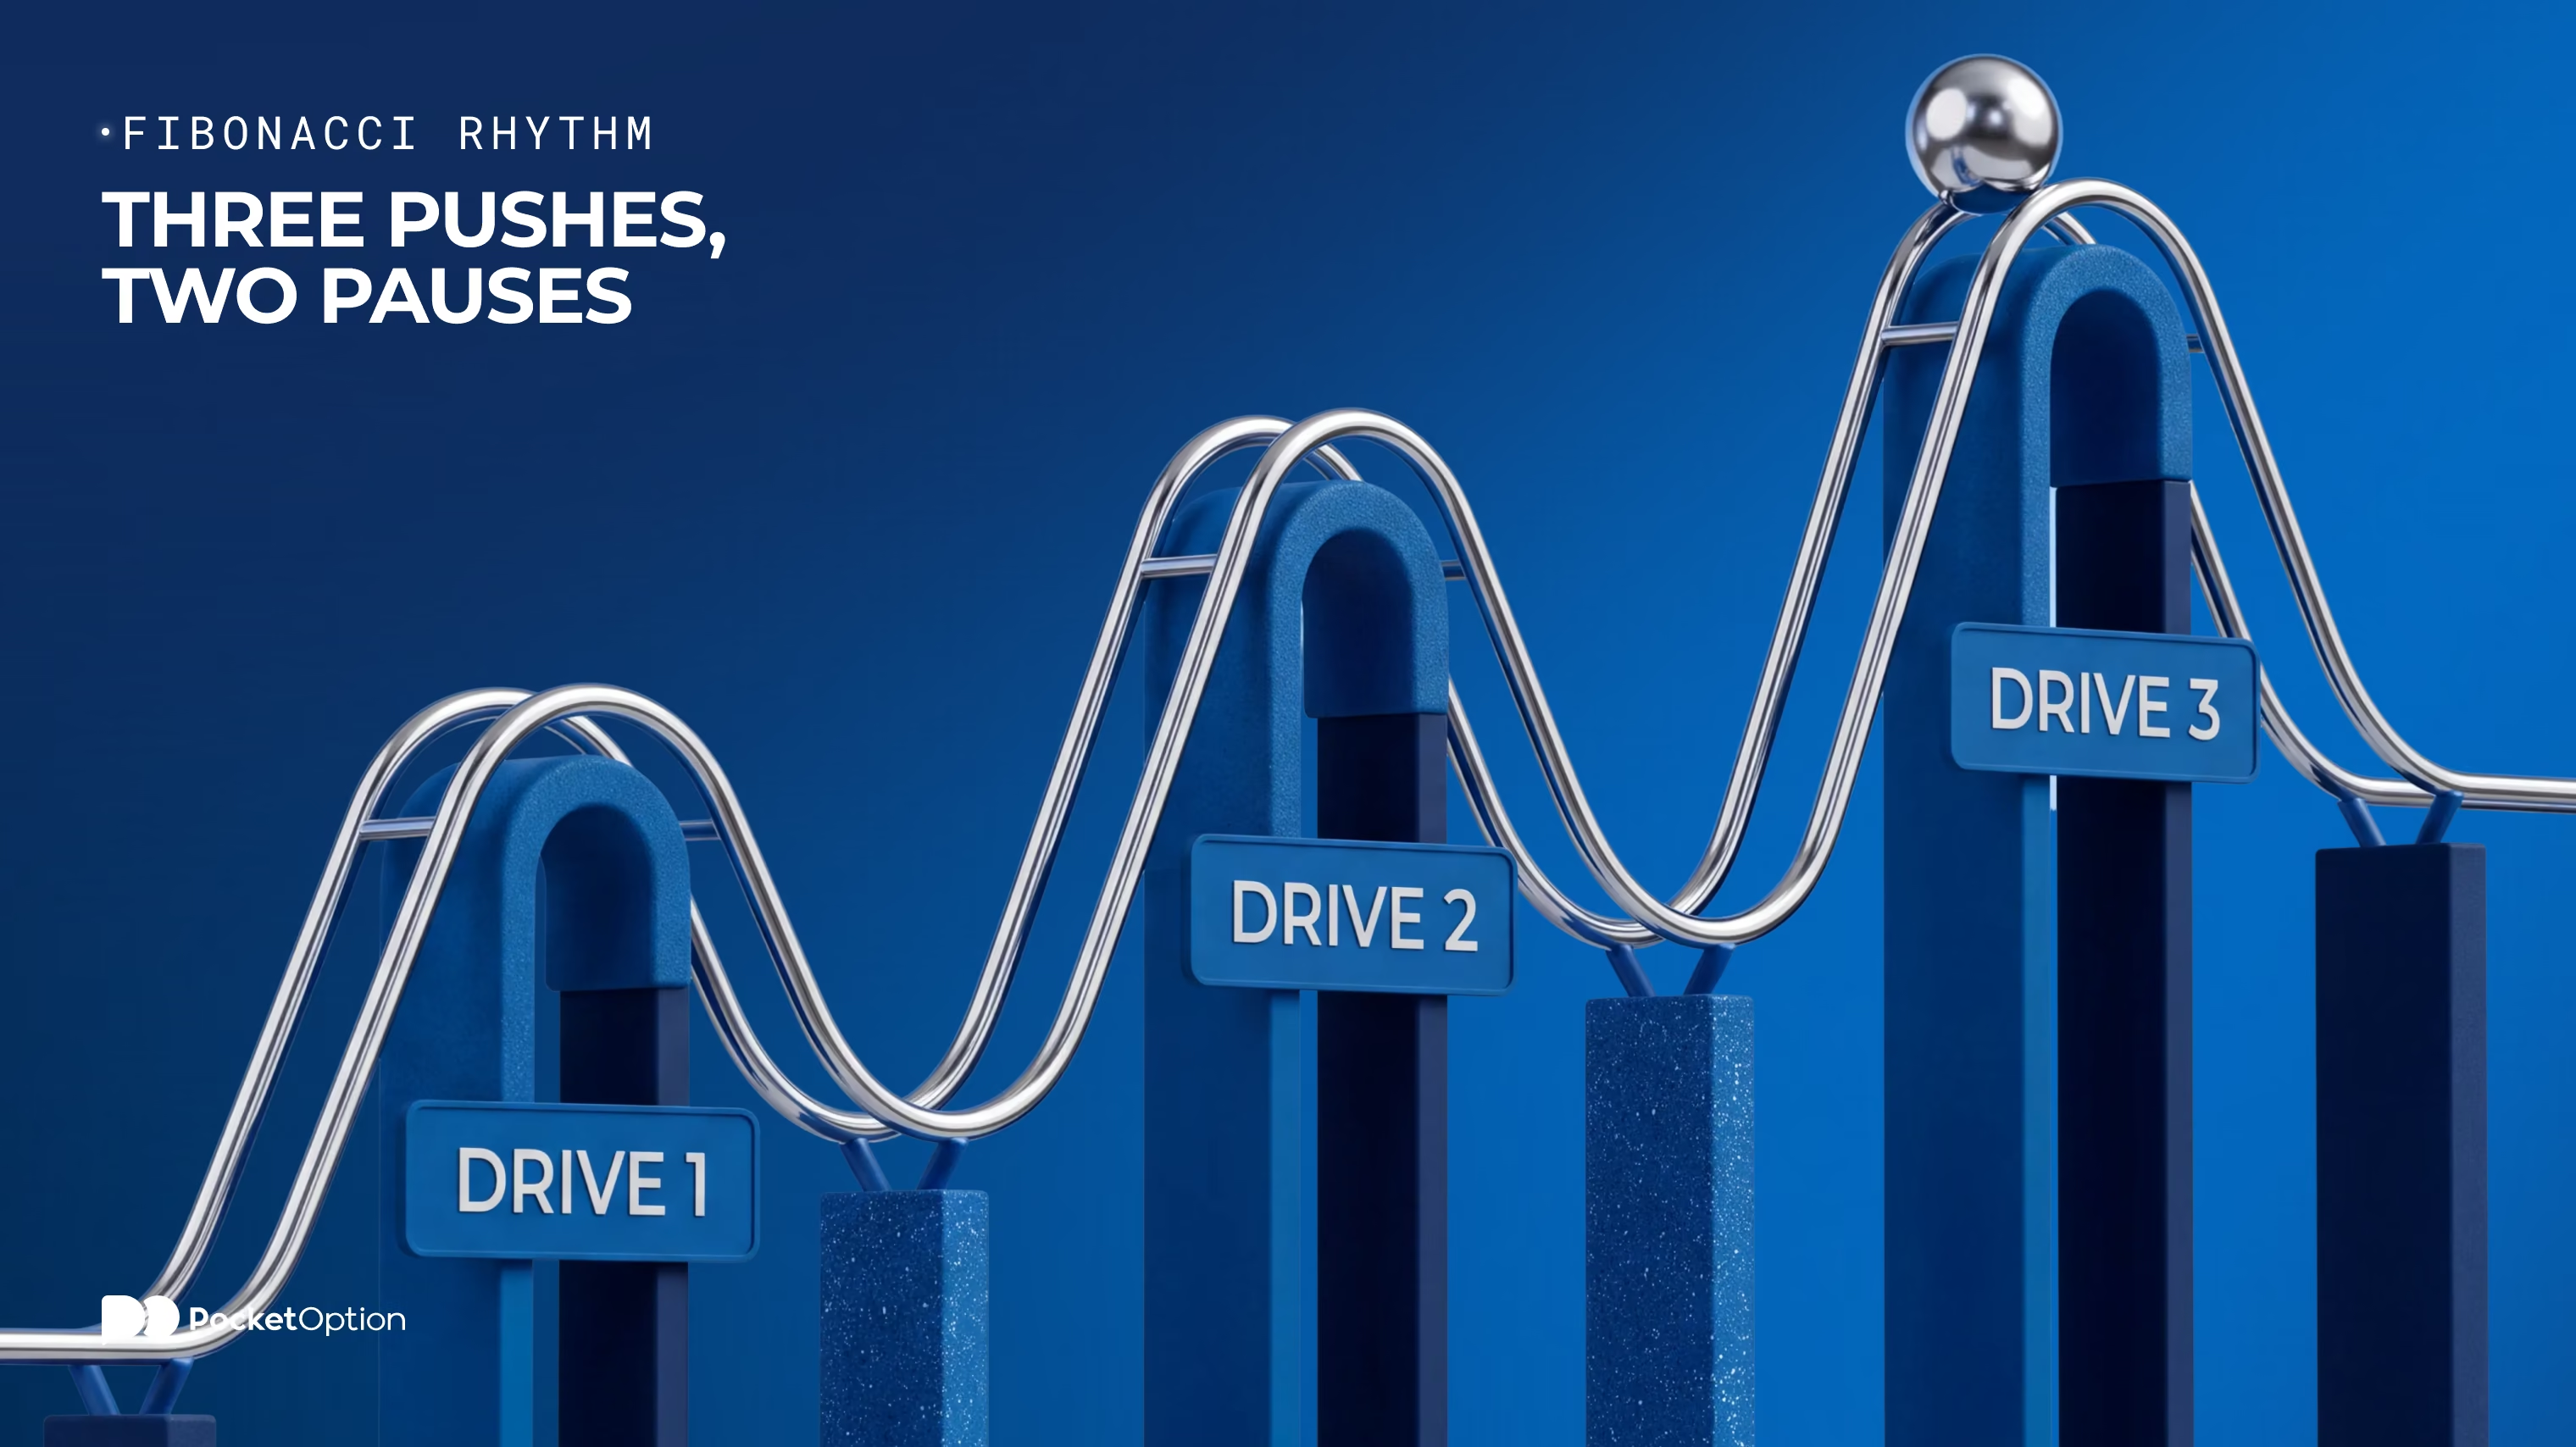
Before any ratios, what is the three drives pattern in trading at the level of pure structure? A sequence. Drive 1. Correction. Drive 2. Correction. Drive 3. Five moves, always in that order. Here's a schematic, no asset attached. Price pushes up. It pulls back by a fair chunk. It pushes up again, a bit past the last high. It pulls back by a similar amount. It pushes up a third time, stretching a little further.
Setting up a chart takes a minute. The pocket option tutorial covers the basics.
What matters is proportion. Each correction, each later drive, gets compared with the move before. Symmetry counts. Visual similarity doesn't. And the formation is judged as a whole structure. Any three successive highs don't qualify.
Fibonacci Ratios in the Three Drives Pattern
Fibonacci enters here. Inside three drives pattern trading, one pair of numbers gets quoted over and over. Corrections retrace roughly 61.8% of the previous drive. The next drive extends roughly 127.2% of the previous correction. Some sources allow 78.6% pullbacks and 161.8% extensions instead. Interpretations differ. That's the point. Treat these numbers as guidelines and as confluence. Not as a rigid rule. Not as a guarantee.
Element | Common Fibonacci Relationship | What It Shows |
|---|---|---|
Correction 1 | Around 61.8% of Drive 1 | The first pause and how much the move gives back |
Drive 2 | Around 127.2% of Correction 1 | The push resumes and overshoots the earlier extreme |
Correction 2 | Around 61.8% of Drive 2 | A second pause of similar depth, the symmetry check |
Drive 3 | Around 127.2% of Correction 2 | The final stretch, where exhaustion may show |
Ratios that almost fit are normal. Ratios that need squinting aren't.
Bullish vs Bearish Three Drives Pattern
Flip the picture and you get the other twin. A bullish Three Drives forms after a string of lower lows. Each drive pushes price down. Read it as a possible floor, never a certain one. The bearish version forms through higher highs. Each drive pushes price up. Read that one as a possible ceiling, with the same caveat. Same geometry, mirrored. But three drives alone confirm nothing about direction. Price may simply keep going.
How to Identify a Three Drives Pattern
Checklists keep you honest. What to check when identifying the formation:
Three separate drives pointing the same way
Two corrections that are easy to see
Fibonacci ratios that roughly fit
Legs of similar timing or shape, where it applies
No forcing of ratios onto unrelated swings
Support from the broader market context
A shape that looks right but has no coherent proportions probably isn't a Three Drives. Draw it. Measure it. Be ready to say no.
Limitations of the Three Drives Pattern
Stay skeptical. The formation is subjective. Hand the same chart to two traders and you may get two different sets of legs. Fibonacci ratios rarely land perfectly. The structure can fail, and the trend can simply continue. It's easy to see in hindsight. The last candle is already printed. Zoom out from the hourly to the daily and the shape can dissolve. And there are no reliable win rates here. Beware any article that quotes one. Even neat Fibonacci confluence doesn't lift the odds to a known number.
How Traders Can Interpret the Three Drives Pattern
Treat it as context, not a trade plan. Used well, a Three Drives helps you question a stretched move. Is it running out of steam? Read it next to the broader trend, support, resistance and price action. No entry point comes with it. No stop. No target. The structure alone doesn't confirm a reversal. Let the rest of the chart vote first.
Risk Disclaimer: Trading involves significant risk of capital loss. This article is for educational purposes only and does not constitute financial advice. Always conduct independent research and consider your risk tolerance before making any trading decisions.
ดูเพิ่มเติม:InterestingTrading Strategies