Schaff Trend Cycle (STC): A Faster Alternative to MACD for Short-Term Trends
The Schaff Trend Cycle combines MACD and Stochastic smoothing, enabling quicker detection of short trends, which produce less false signals that are results of lag-related issues.

What Is the Schaff Trend Cycle (STC)
The Schaff Trend Cycle was designed by Doug Schaff as an advanced version of the MACD line. Unlike conventional MACD lines, which show readings as such, Schaff Trend Cycle indicator processes MACD readings with the help of a cycle-based stochastic formula, generating an oscillator within the range of 0-100. That is, it is distinguished from a traditional MACD by the bounded scale.
Since the reading is scaled, one can use traditional overbought and oversold zones, just like in the case with RSI and stochastics. If the oscillator is close to 100, the market has over-extended in terms of short-term strength, and when the oscillator approaches 0, it signals short-term weakness. It is worth noting that there may be a misunderstanding regarding the name “STC stock,” as sometimes Schaff Trend Cycle is regarded only as a stock ticker.
The STC Formula: MACD Meets Stochastic
The calculation takes place in stages. A MACD line is calculated based on the difference of fast and slow exponential moving averages, typically 23-period and 50-period EMAs and not the classical 12/26 EMAs pair used in classic MACD calculations.
A MACD line is calculated from 23 and 50 period EMAs.
Stochastic calculations (%K) are performed on this MACD line on a selected cycle, usually 10-period. This process produces the first smoothed value.
Second stochastic calculation is made for this smoothed value and this further smooths out the noise produced in the previous step.
The result of two stochastic calculations is rescaled to be in the 0 to 100 scale, thus producing the final Schaff Trend Cycle line.
The application of two stochastic operations on MACD explains why this indicator got its name. After MACD is compressed using two stages of smoothing, the new line becomes much more responsive to changes in trend than original MACD alone.
Why STC Reacts Faster Than MACD
A classical MACD indicator is a moving average of moving averages, and therefore suffers from lag. It often confirms a trend reversal only when some part of movement has already taken place. The guide on MACD settings for day trading explains how most of traders try to minimize such lag. What they do is alter the EMA periods.
Schaff Trend Cycle handles the problem in a different way. Instead of reducing EMA periods, STC performs a stochastic operation on MACD which rescales the data relative to recent highs and lows and not to a moving average as MACD does. As the result of this rescaling, the STC indicator becomes more responsive to a change in trend direction without increasing the number of false signals that come as a result of reducing MACD periods.
Default and Best STC Settings
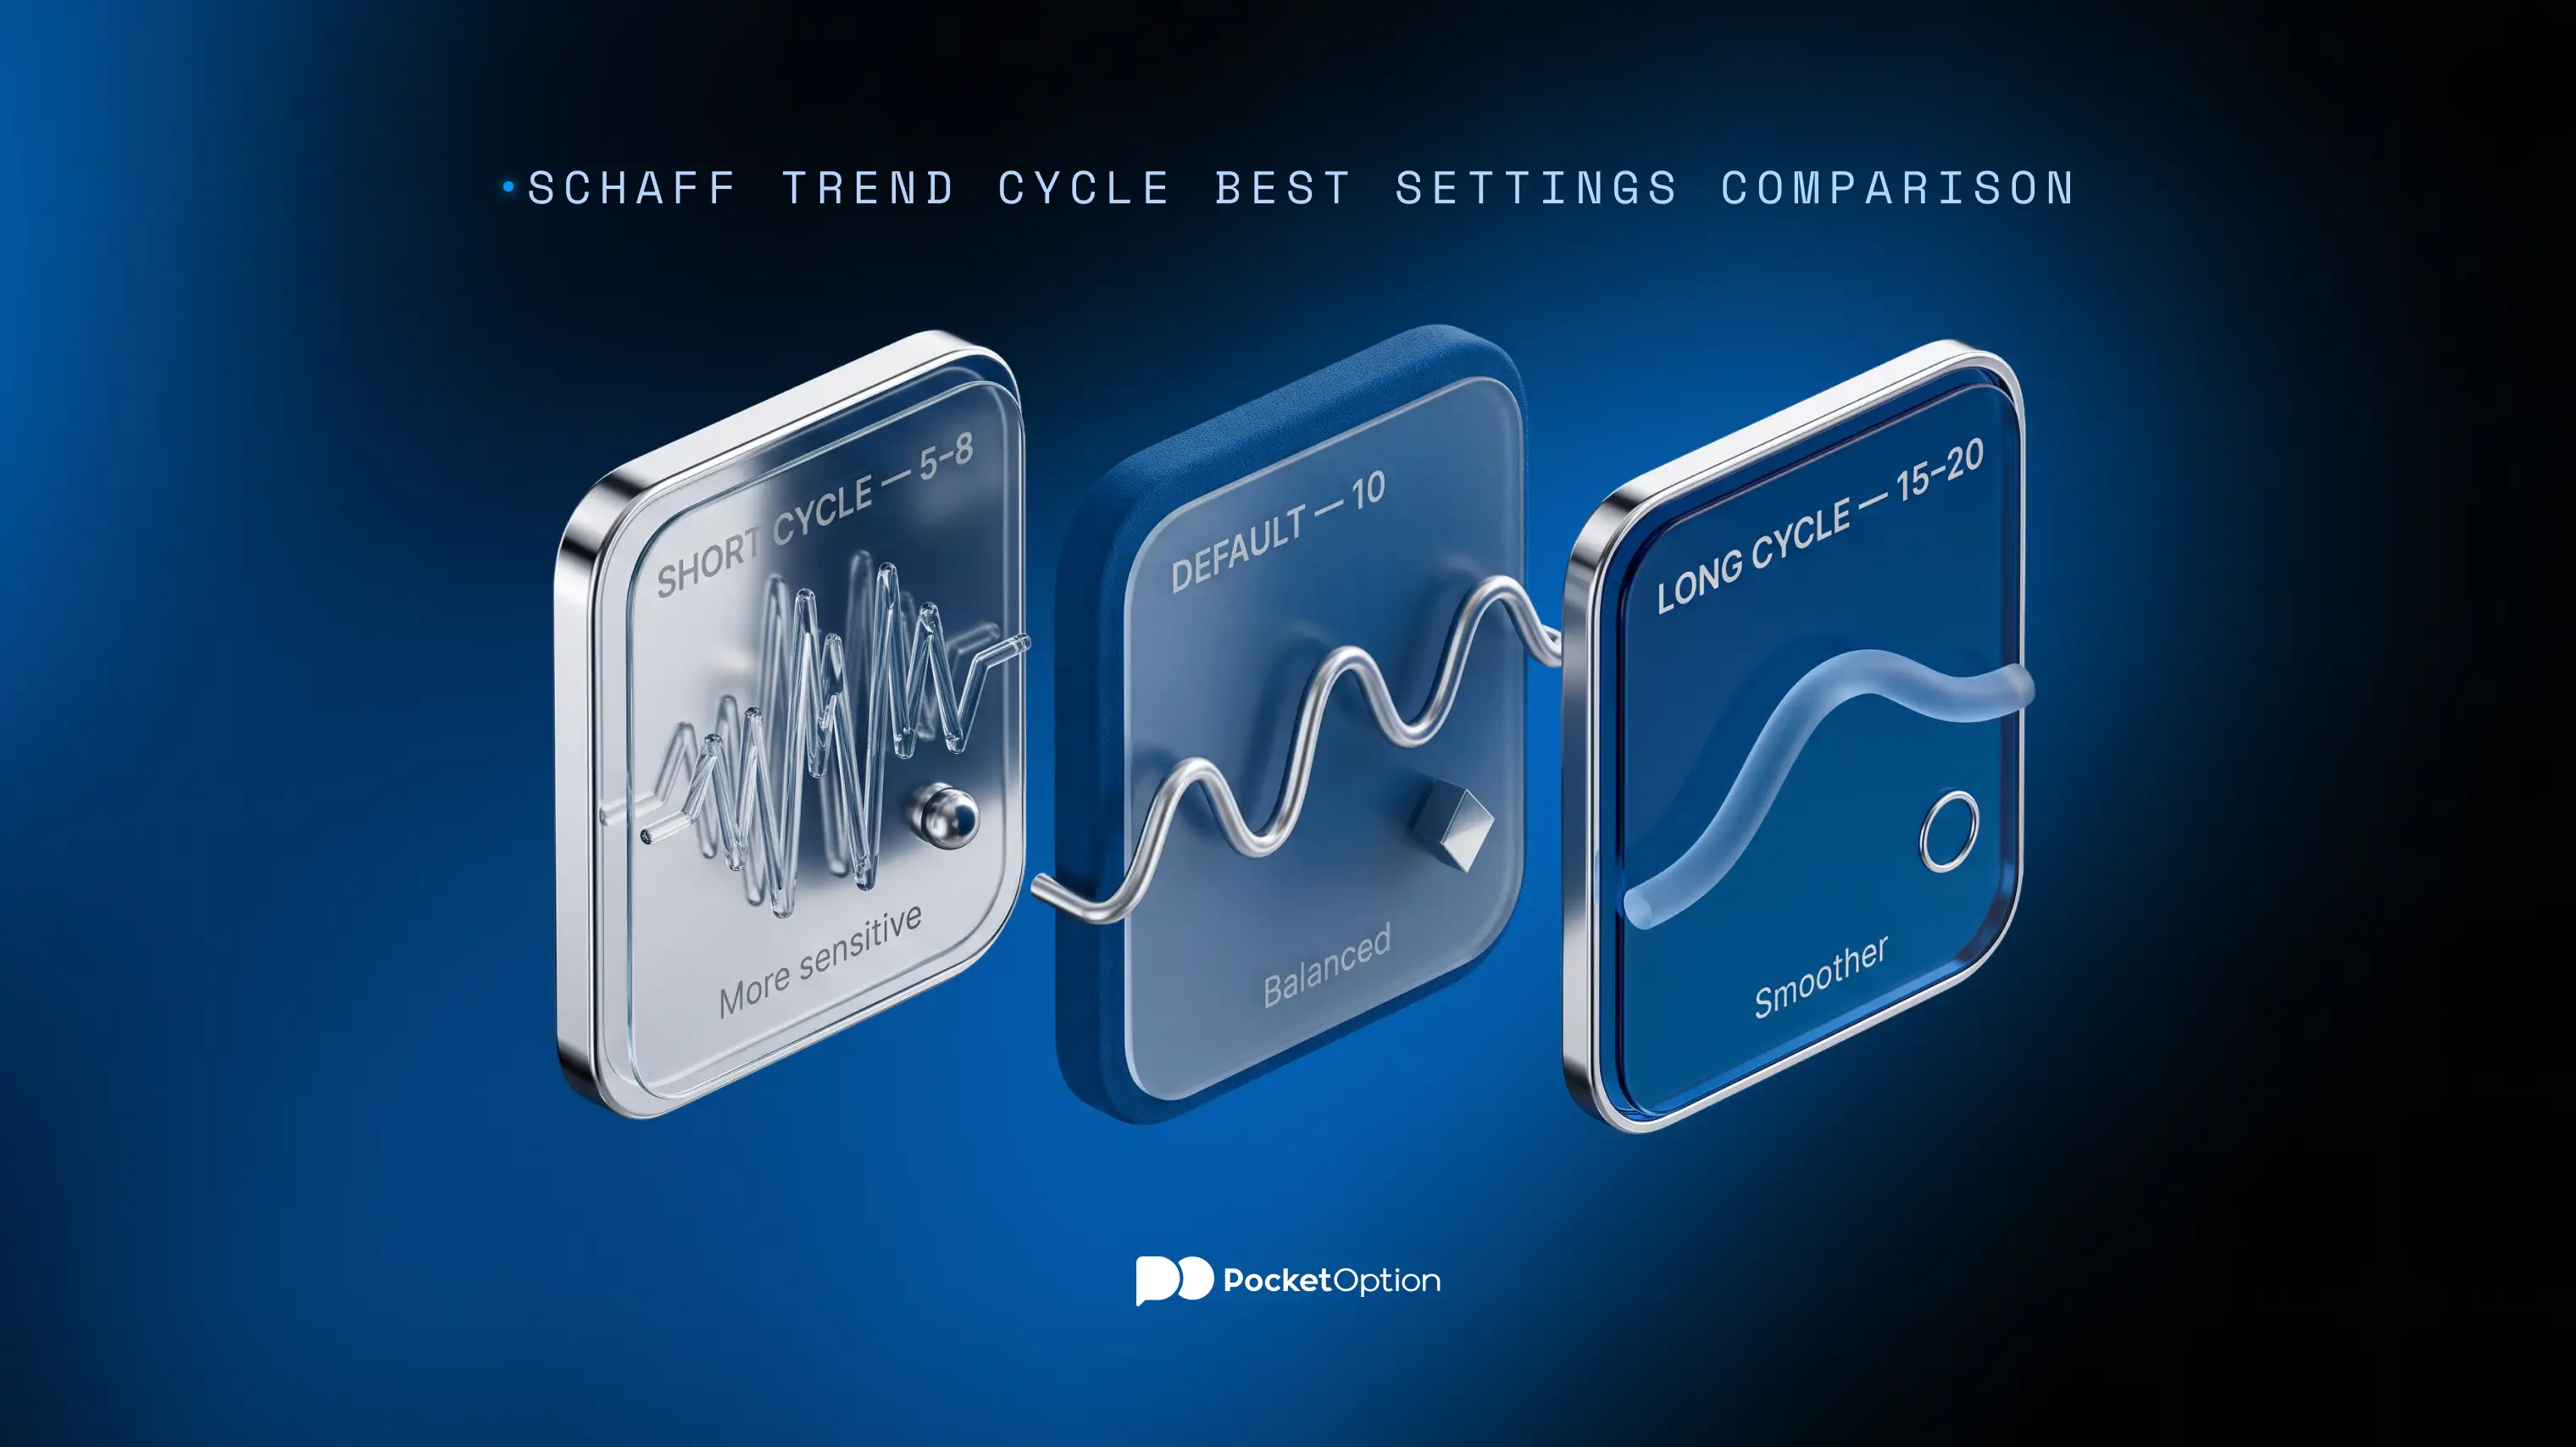
Default settings include 23-period fast EMA, 50-period slow EMA, cycle length equal 10, and smoothing 0.5 of both stochastic calculations. These defaults are suitable for almost all timeframes and were tested in Schaff's original research.
Smaller cycle lengths (e.g. 5-8) increase sensitivity of the oscillator and can be used in fast intraday charts, however, will generate more false signals in choppy market conditions. Bigger cycle lengths (approximately 15-20) make line smoother and are more suitable for swing trading. Exploring schaff trend cycle best settings, researchers use default values (23/50/10) and change the value of cycle length step by step as the large change can significantly distort oscillator behavior near its extreme values.
Reading Overbought and Oversold Zones
Readings above 75 are considered to be overbought, and readings below 25 are considered to be oversold, although some traders use slightly tighter 80/20 levels common for other oscillators. However, the important aspect of the oscillator is not the precise level but the fact of moving from these levels.
If the line comes from the oversold area and exceeds 25 level, it indicates that the momentum starts weakening. Similarly, leaving overbought area below 75 level means the same but in opposite direction. Due to the limited nature of the oscillator line, it is easier to notice such shifts than similar movements of unbound MACD histogram.
Buy and Sell Signals Using STC
The most popular signal generated by Schaff Trend Cycle is zone exit, described above: returning above 25 level from oversold territory is considered to be bullish, and returning below 75 level from overbought territory is bearish. Some traders wait until the line begins turning back up/down, which increases a little bit the lag time but decreases false positives.
Second approach is based on using midline, near 50, as the directional filter: readings consistently above 50 are bullish, while readings below 50 are bearish. Entries are only taken in the direction of trend bias. Confirmation of price action, such as breakout of previous swing highs/lows, is usually used in conjunction with these approaches.
STC vs MACD: Side-by-Side Comparison
Characteristic | MACD | STC (Schaff Trend Cycle) |
|---|---|---|
Scale | Unbounded | 0 – 100 (bounded) |
Main calculation | Difference of two EMAs | Range-based double stochastic smooth of MACD |
Lag time | Greater, particularly when the market is choppy | Lesser due to range-based smoothing |
Levels of overbought/oversold | No overbought or oversold level due to unbounded scale | Defined at 75/25 or 80/20 |
Well-suited for | Trend confirmation, swing trading | Trend reversal recognition and short term trading |
Limitations and False Signals
The use of some sort of simple trend filter helps in reducing false signals. For example, one may check if price is above/below the longer moving average or use specific settings of stochastic oscillator on the higher timeframe. It is expected that the number of signals resulting in trades will get lower with such an approach. The trader should always manage his risk level so a couple of false signals do not damage his account.
Using STC on Pocket Option Charts
STC type oscillators may be added via the indicators menu with a choice of custom EMA and cycle parameters, which means that the trader may apply the 23/50/10 default settings or any other adjustments to the live or demo charts. One must test the oscillator with different settings on the demo balance for a certain asset to make sure of its reliability.
The traders who apply some kind of objective measure of trend strength to their other technical indicators may continue this practice when using the STC: log a number of signals, mark up which exit strategy worked better for the asset and maintain the same settings.
open a free account today
Get StartedConclusion
The Schaff Trend Cycle provides a balance between the smoother MACD and the rapid stochastic oscillator. The scale used in STC is easier to interpret than that of oscillators because overbought and oversold conditions can be clearly identified. Moreover, the double-smoothing technique allows one to recognize trend changes faster than in the case of using MACD. Like other technical indicators, the Schaff Trend Cycle should be used with caution, with the help of a trend filter and risk management.
Disclaimer: Trading carries the real risk of losing money and may not be suitable for everyone. Past performance is not indicative of future results.
See more:InterestingTrading Strategies