Rising Wedge Pattern: How to Spot and Trade It on Pocket Option Platform Charts
If you have spent enough time looking at chart patterns on any platform, then you have probably noticed that sometimes there is a situation when prices continue to rise, but the momentum gradually weakens. This phenomenon in technical analysis is known as a rising wedge pattern.

What Is a Rising Wedge Pattern?
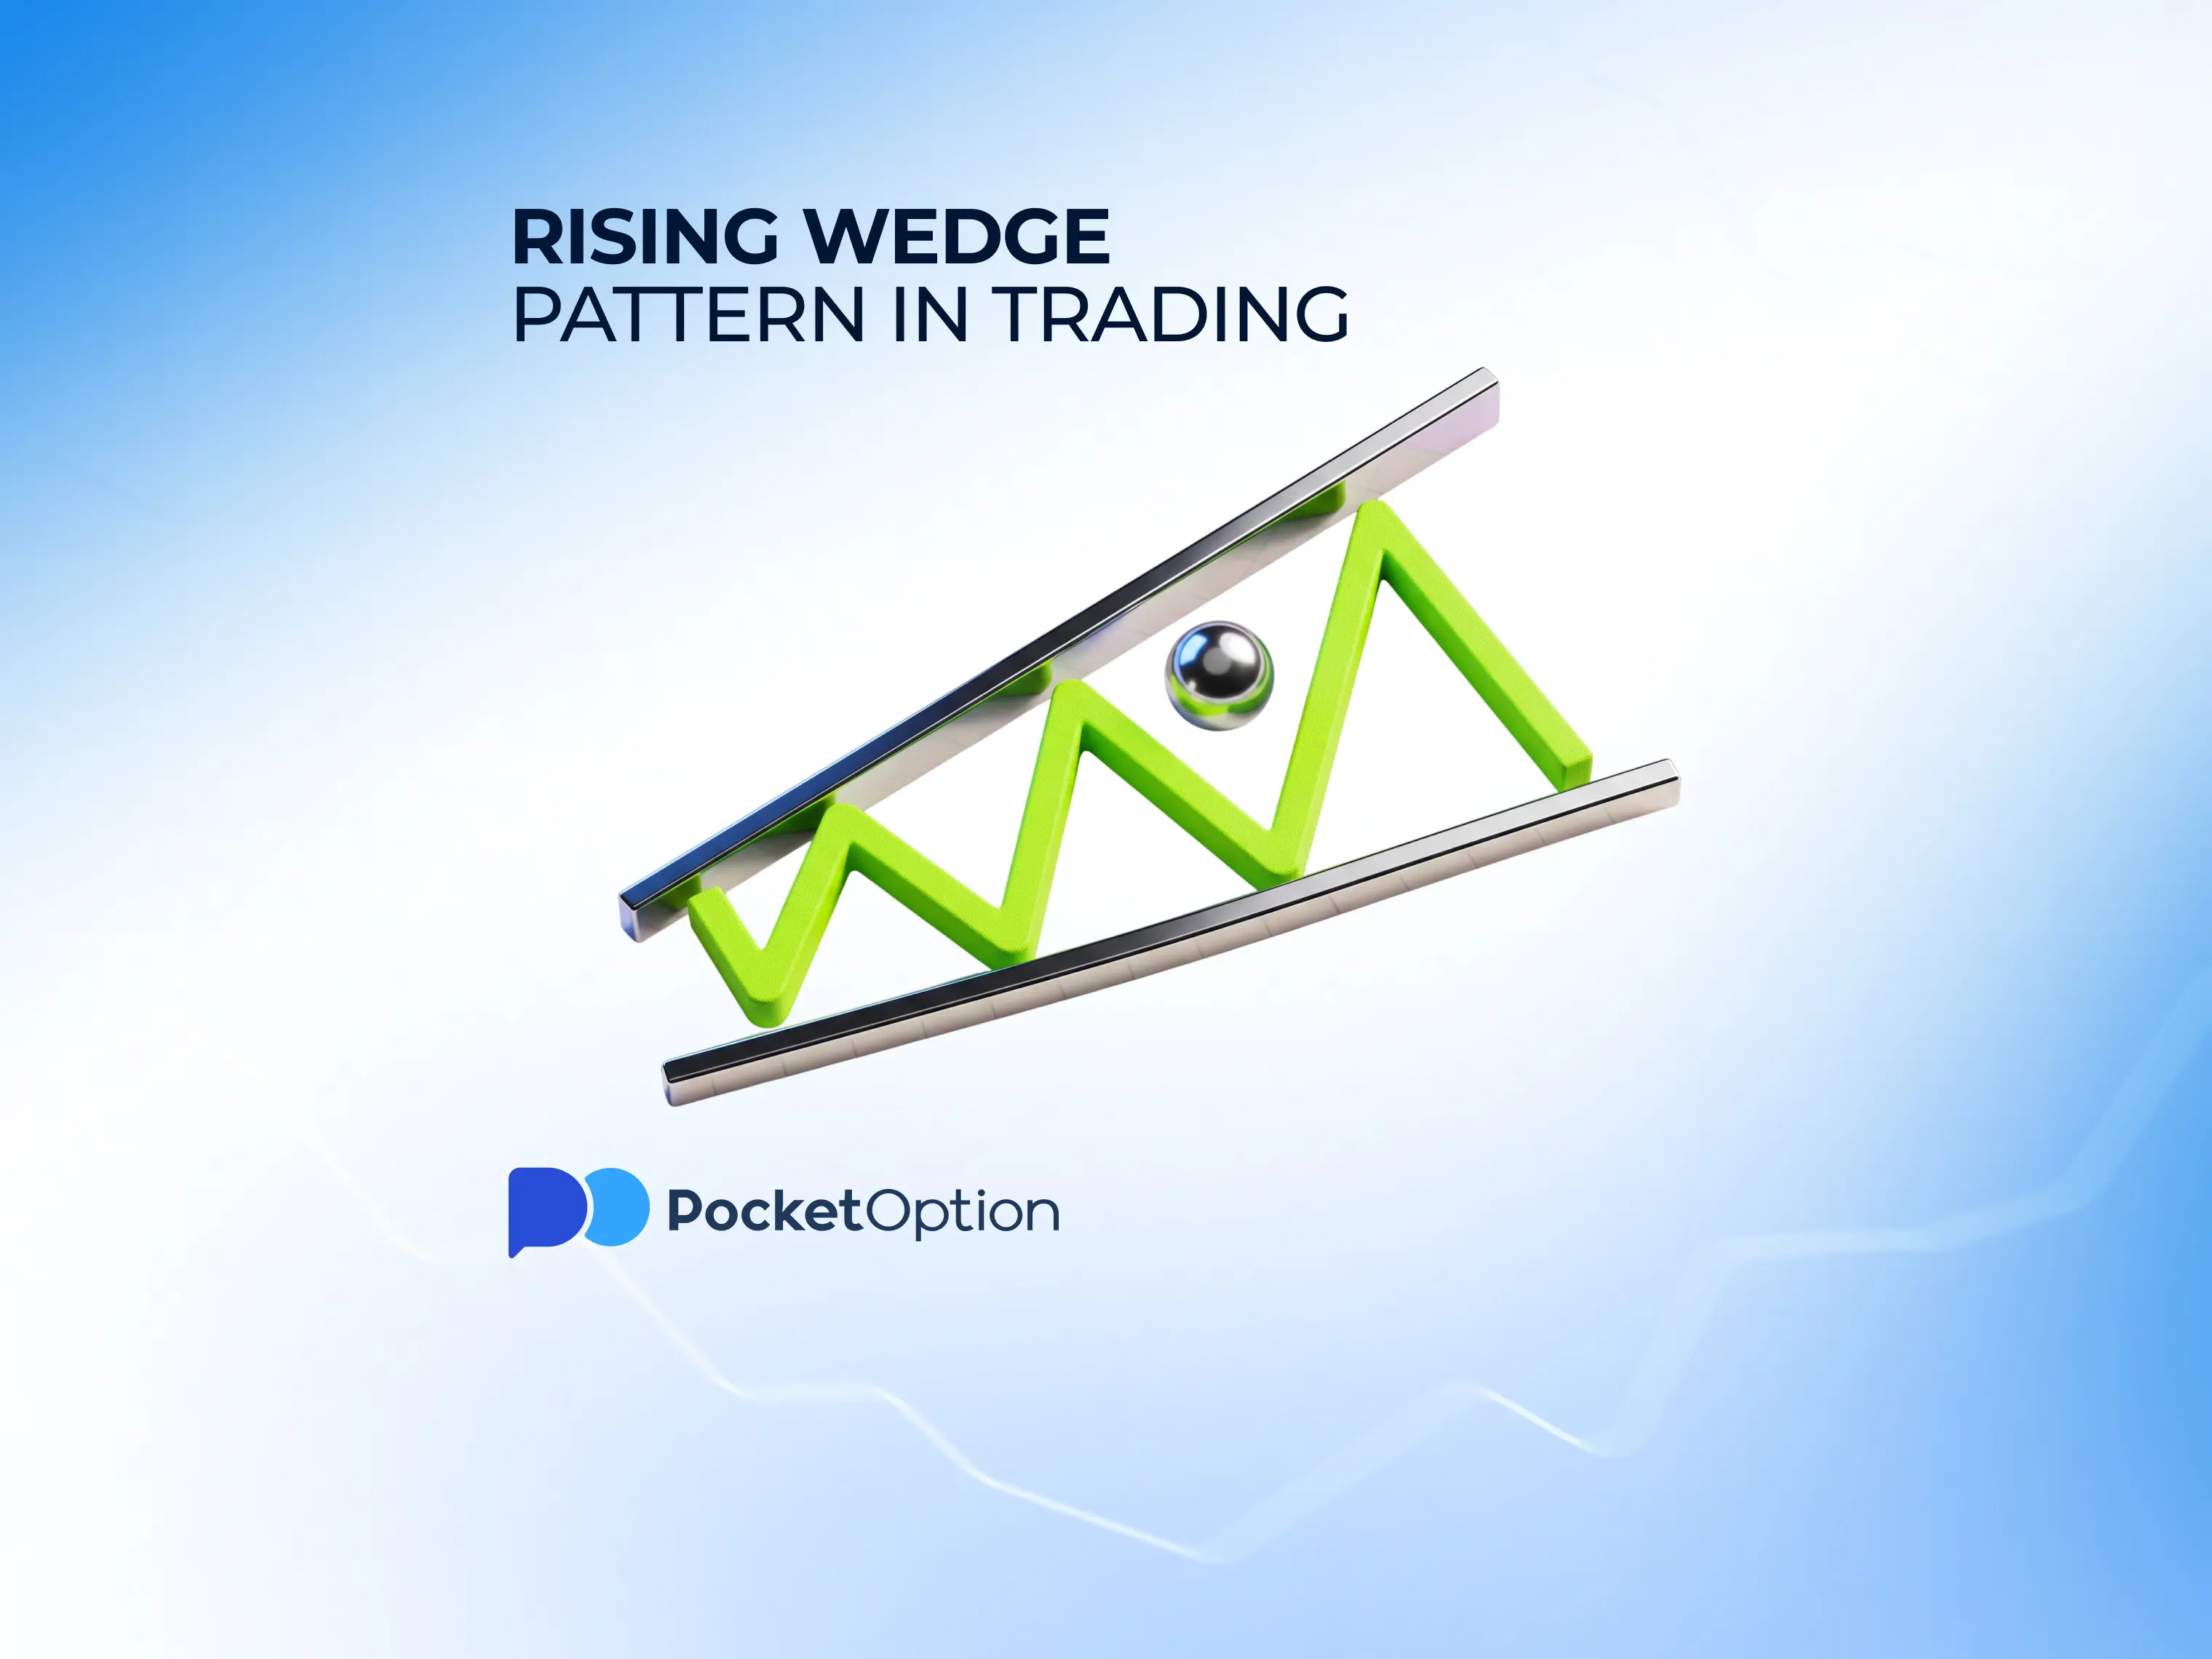
To have a clear understanding of what a rising wedge pattern is, it's sometimes better to look at the picture. Refer to the above example. The concept is simple. There is a higher high, higher low, but the distance between the candles and/or bars that make higher highs and higher lows keeps shrinking. This narrowing concept is the whole point. It shows that buying pressure is fading even though the price technically grinds higher.
So then you can build two convergent trend lines. And typically, at least two touches on each trend line are needed, four in total, before the pattern is considered complete. Volume is another aspect that has to be taken into account. In a classical rising wedge pattern, the volume ideally has to decline with the development of the pattern. However, it's not always a 100% rule.
Another caveat that traders might think is confusion with a simple ascending channel. The difference is that a channel has almost parallel lines, while the wedge converges towards an apex. The time that the pattern can take to develop usually varies from several days to several weeks, and it also depends on what kind of timeframe you use, whether it is daily, weekly, or even monthly. But it really doesn't matter whether you're on an intraday chart or on a daily chart because the structure is crucial: converging lines, higher highs and higher lows, and the visible loss of the charge behind the price pushing.
Is a Rising Wedge Bullish or Bearish?
This is the most important question for tactical trading. To answer it directly, a rising wedge pattern is bearish even though its formation often is of an upward trend. There’s a contradiction: good PA, but a bearish outcome. Why does this happen, then? Because the volume diminishes as the pattern develops! This means, remaining buying pressure is being exhausted. And once the volume diminishes, the pattern breaks. A valid breakdown occurs when there is a considerable move in a downward direction below the lower trend line.
This pattern and its signs is one of the most highly sought and misunderstood concepts by traders in the financial space. A lot of traders, especially new ones, for some reason believe that since there is a higher high and higher low, then the setup must be highly bullish. But experienced traders know that the real meaning behind this pattern is the opposite.
Market Psychology Behind the Pattern
Every chart pattern that you see on the charts is a manifestation of human emotions. People buy or sell a certain asset due to many reasons, and that aggregate sum of all the market participants manifests itself in a chart pattern. In regards to the rising wedge pattern, then early in the pattern, buyers are still in control. There can be, relatively speaking, more volume involved in the early phase, pushing the price to new highs. But looking closer at the pattern this time, you see that volume diminishes, and the buyers have to work harder to push the price even higher. It's a classical sign of exertion. At the same time, sellers are also stepping into the game earlier on each pullback. That is why the lower trend line rises faster than the upper one.
This leads to narrow tip of the wedge. So there is a conundrum: both buyers and sellers are active at the same time, and one side has to lose. And because the buying pressure is already thinning out, sellers tend to win this tug of war, and the breakdown happens from the lower trend line.
There is another psychological behavioral trap involved in this pattern. It is FOMO, fear of missing out. Those traders who see that the price is still going up due to their psychological biases believe that the rally will continue and enter positions near the top. But at the same time, institutional participants have already stopped buying and started to sell. And those chunks of retail traders, due to FOMO, come in and push for the last phase of this pattern.
Where Rising Wedges Appear: Reversal vs. Continuation
A rising wedge pattern in an upward trend can play two different roles, and knowing what kind is in front of us is crucial for successful trading.
First is the reversal nature. If it’s a long, sustained major bullish trend, then a rising wedge of a minimum two or three months' pattern usually indicates the reversal. However, the reversal is not confirmed until a clear downward trend structure becomes visible. The higher the duration, the higher the chance of a reversal pattern.
Second is a continuation pattern. A rising wedge can also show up in the middle of a downtrend, acting as a corrective bounce. Consider you are in a major bear market, and then this rising wedge pattern appears. Inexperienced traders might mistakenly think it's a reversal for the bullish side, while at the same time, in reality it's a continuation pattern. Either way, the resolution is typically the same. The direction is downwards.
How to Identify a Valid Rising Wedge
It's not that simple to plot two narrowing sets of lines and flag it as a rising wedge chart pattern. Here are some of the most important aspects to see in order to have a valid candidate for the pattern.
Two convergent trend lines. They have to slope upward, with the lower line steeper than the upper one.
At least four touchpoints. These lines will act as resistance and support. Two points on resistance and two on support.
Declining volume. As the pattern progresses, the volume usually diminishes.
A prior uptrend or established price context. A wedge pattern without any preceding major trend is usually less important.
A narrowing range. With each swing high and swing low going toward the apex, there has to be a narrowing form.
Confirming the Breakdown Before You Trade
Seeing the pattern is only one half of the job. The pattern doesn't complete until price action actually breaks the rising support line below, and entering before that confirmation is one of the most common mistakes, and experienced traders are no exception. What you can do is to have some patience and wait for the candle or bar to close below the lower trend line. Experienced traders use fixed or floating percentages for the price to go down relative to the trend line. A threshold of 2% to 5% is common, depending on the timeframe and asset volatility. Playing the breakdown with traditional indicators like RSI or MACD can add another layer of confirmation.
At the same time, if you are looking at intraday timeframes, it can be a good idea to see what's going on in higher timeframes. A breakdown on a 15-m chart means a lot less if the same asset is still grinding higher on the daily chart. Usually there is more noise in smaller timeframes. So if the measured trend on a higher timeframe is in line with a pattern on an intraday timeframe, then you have a higher chance of a valid pattern.
With one of the best online platforms for trading
Get StartedSetting Entries, Stop Loss, and Targets
Entry. There are two situations to enter: on the breakout, or wait for the retest.
Stop loss. A common approach is to put a stop loss order just above the lower line of the pattern. It can be several percents above it, depending on the asset volatility and overall market environment.
Target. To estimate the price target, you need to look at the whole picture. The previous chart build might tell us about the support lines, resistance points and pivot points that can be used as first points for profit-taking.
Common Mistakes When Trading Rising Wedges
Entering before the breakdown confirms. Premature entry increases the likelihood of losses, so there should be a clear breakdown from the pattern.
Ignoring volume. A wedge without declining volume is a weaker signal. If there is more volume with pattern development, then most probably the pattern will morph into something else.
Trading a wedge with fewer than four clean touchpoints. If you don't have clear pivot points on the pattern, the chances for the validity of the pattern are lower.
Skipping the higher timeframe. On a lower timeframe, for example intraday 15-m or 30-m timeframes, and the daily or weekly major trend contradicts our patterns, then there is a lower chance for a genuine breakout and pattern.
Forgetting risk control entirely. Premature entries and incorrect stop loss orders can quickly turn a valid pattern into a losing trade.
Confusing a falling wedge with a rising one. They might sound similar and easy to make when you scan charts quickly, but they resolve in opposite directions.
Practicing the Rising Wedge Trades on a Pocket Option Account
Reading about a trading pattern and actually using it are two different skills. It's good to test yourself on a demo account that is easily available on Pocket Option. You can open a demo account on all the different modes, whether it is Forex, Shares, or Quick Trading mode. All of these modes offer decent charting capabilities on which you can train yourself to spot rising wedge patterns.
No strings attached
Try Demo AccountDisclaimer: None of the information in this article constitutes financial advice. Trading involves substantial risk, including the possibility of losing your entire deposit. Chart patterns, including the rising wedge, are technical analysis tools and do not guarantee future price movement. Past performance does not predict future results. Before trading with real funds, assess your financial situation and seek independent advice if necessary.
See more:InterestingTrading Strategies