Range Trading Strategy
A squash ball spends most of a rally bouncing between two walls, predictable, almost boring to watch until someone drives it wide and it leaves the court entirely. Price does something similar for long stretches on plenty of charts. It bounces between a floor and a ceiling, tests each side, drifts back, tests again, right up until it does not.

When Range Trading Makes Sense
Range trading works when price stops trending and starts bouncing instead, sideways between a floor and a ceiling with no real direction. Nobody using range trading is guessing where the market goes next in some grand sense. The job is smaller: mark the two walls the ball keeps bouncing off, then plan a trade around one wall with an exit already decided before entry.
The setup falls apart the moment a real trend shows up. Range trading assumes the ball keeps bouncing between the same two walls. A strong trend means the ball just drove through one wall and kept going, and no amount of hoping brings it back into the court. Recognizing which situation you are actually in matters more than any specific entry trick this style can offer.
Open a free demo account and watch price bounce between support and resistance in real time, using virtual funds.
Try Demo AccountCurious what this actually looks like once price is bouncing between real walls on a live chart? Reading about the pattern only goes so far. Watching a genuine range hold, and eventually break, teaches far more than any diagram can.
Open a demo trading account and watch a few sessions of sideways price action unfold, with virtual funds and nothing real on the line.
How to Spot a Sideways Market
A sideways market leaves fingerprints. Price touches roughly the same ceiling two or three times without breaking through, and the same floor the same number of times without giving way. Momentum stays weak both ways, each bounce looking like the last. Building a range trading strategy around a market that has not shown this pattern yet is building on a guess, not a chart.
Weak, repeating bounces off the same two levels are the tell. A single touch proves nothing. Two or three, spaced out over time, start to look like an actual ceiling and floor rather than coincidence. That repetition is the entire foundation any range trading strategy rests on. The pocket option tutorial has the basics of chart reading if any of this still feels unfamiliar.
Drawing Support and Resistance Zones
Treat support and resistance as zones, not exact prices. A level drawn as a single hairline invites arguments over whether a two-pip wick through it means anything. A zone, a band a few pips or points wide, absorbs those small pricks without forcing a decision every time price grazes the edge. Any trading range indicator built on a single precise number tends to generate false signals exactly where a zone would have stayed quiet.
Indicators That Help Confirm the Range
A handful of tools help confirm the bounce is real rather than wishful thinking: horizontal channels drawn across the touches, RSI drifting overbought near the ceiling and oversold near the floor, volume that fades rather than surges near either wall, and a moving average running flat with no real slope. None confirm anything alone, but stacked together they separate a genuine range from a pattern you are imagining. Anyone trying range trading crypto specifically should lean on these harder, since crypto ranges tend to hold for shorter stretches.
Indicator | What It Shows | How It Confirms the Range |
|---|---|---|
Horizontal channel | Visual line across each touch point | Confirms repeated bounces at the same levels |
RSI | Momentum strength | Overbought near resistance, oversold near support, both fit a range |
Volume | Trading activity at each touch | Fading volume near the walls supports a genuine range |
Moving average | Trend direction | A flat, sideways-running average fits a range, a sloped one does not |
Planning Entries, Stops and Exits
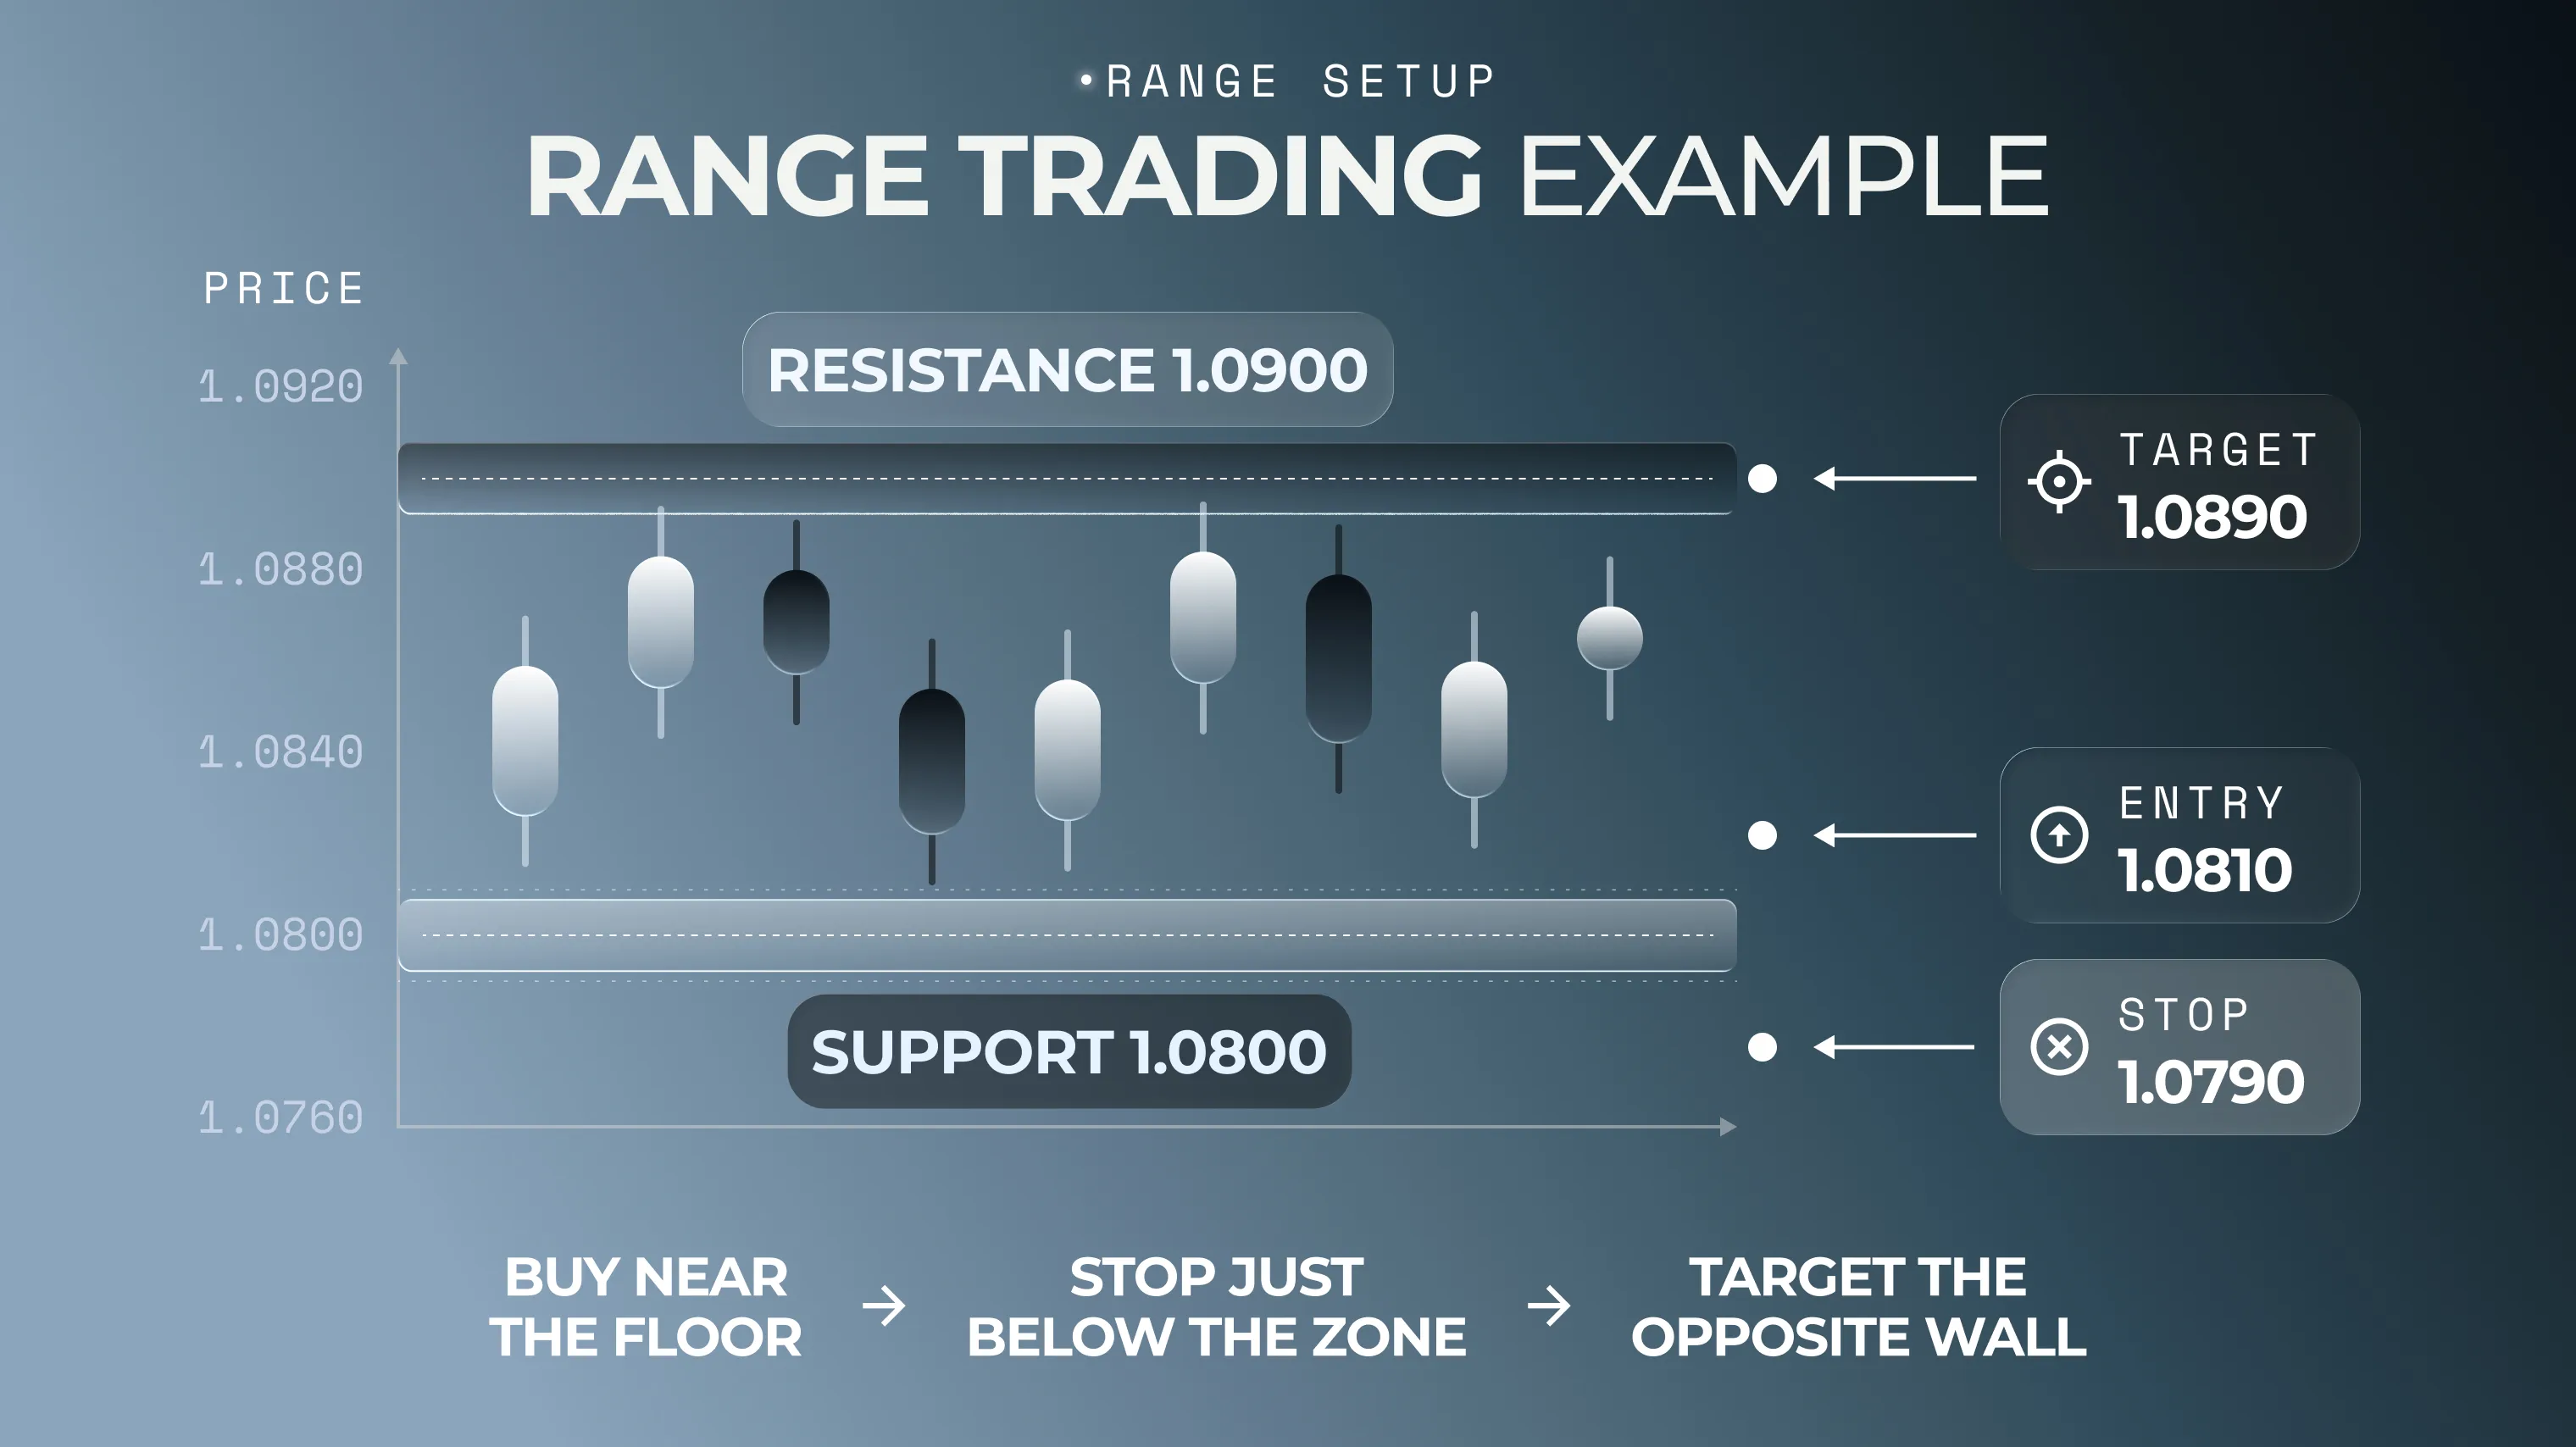
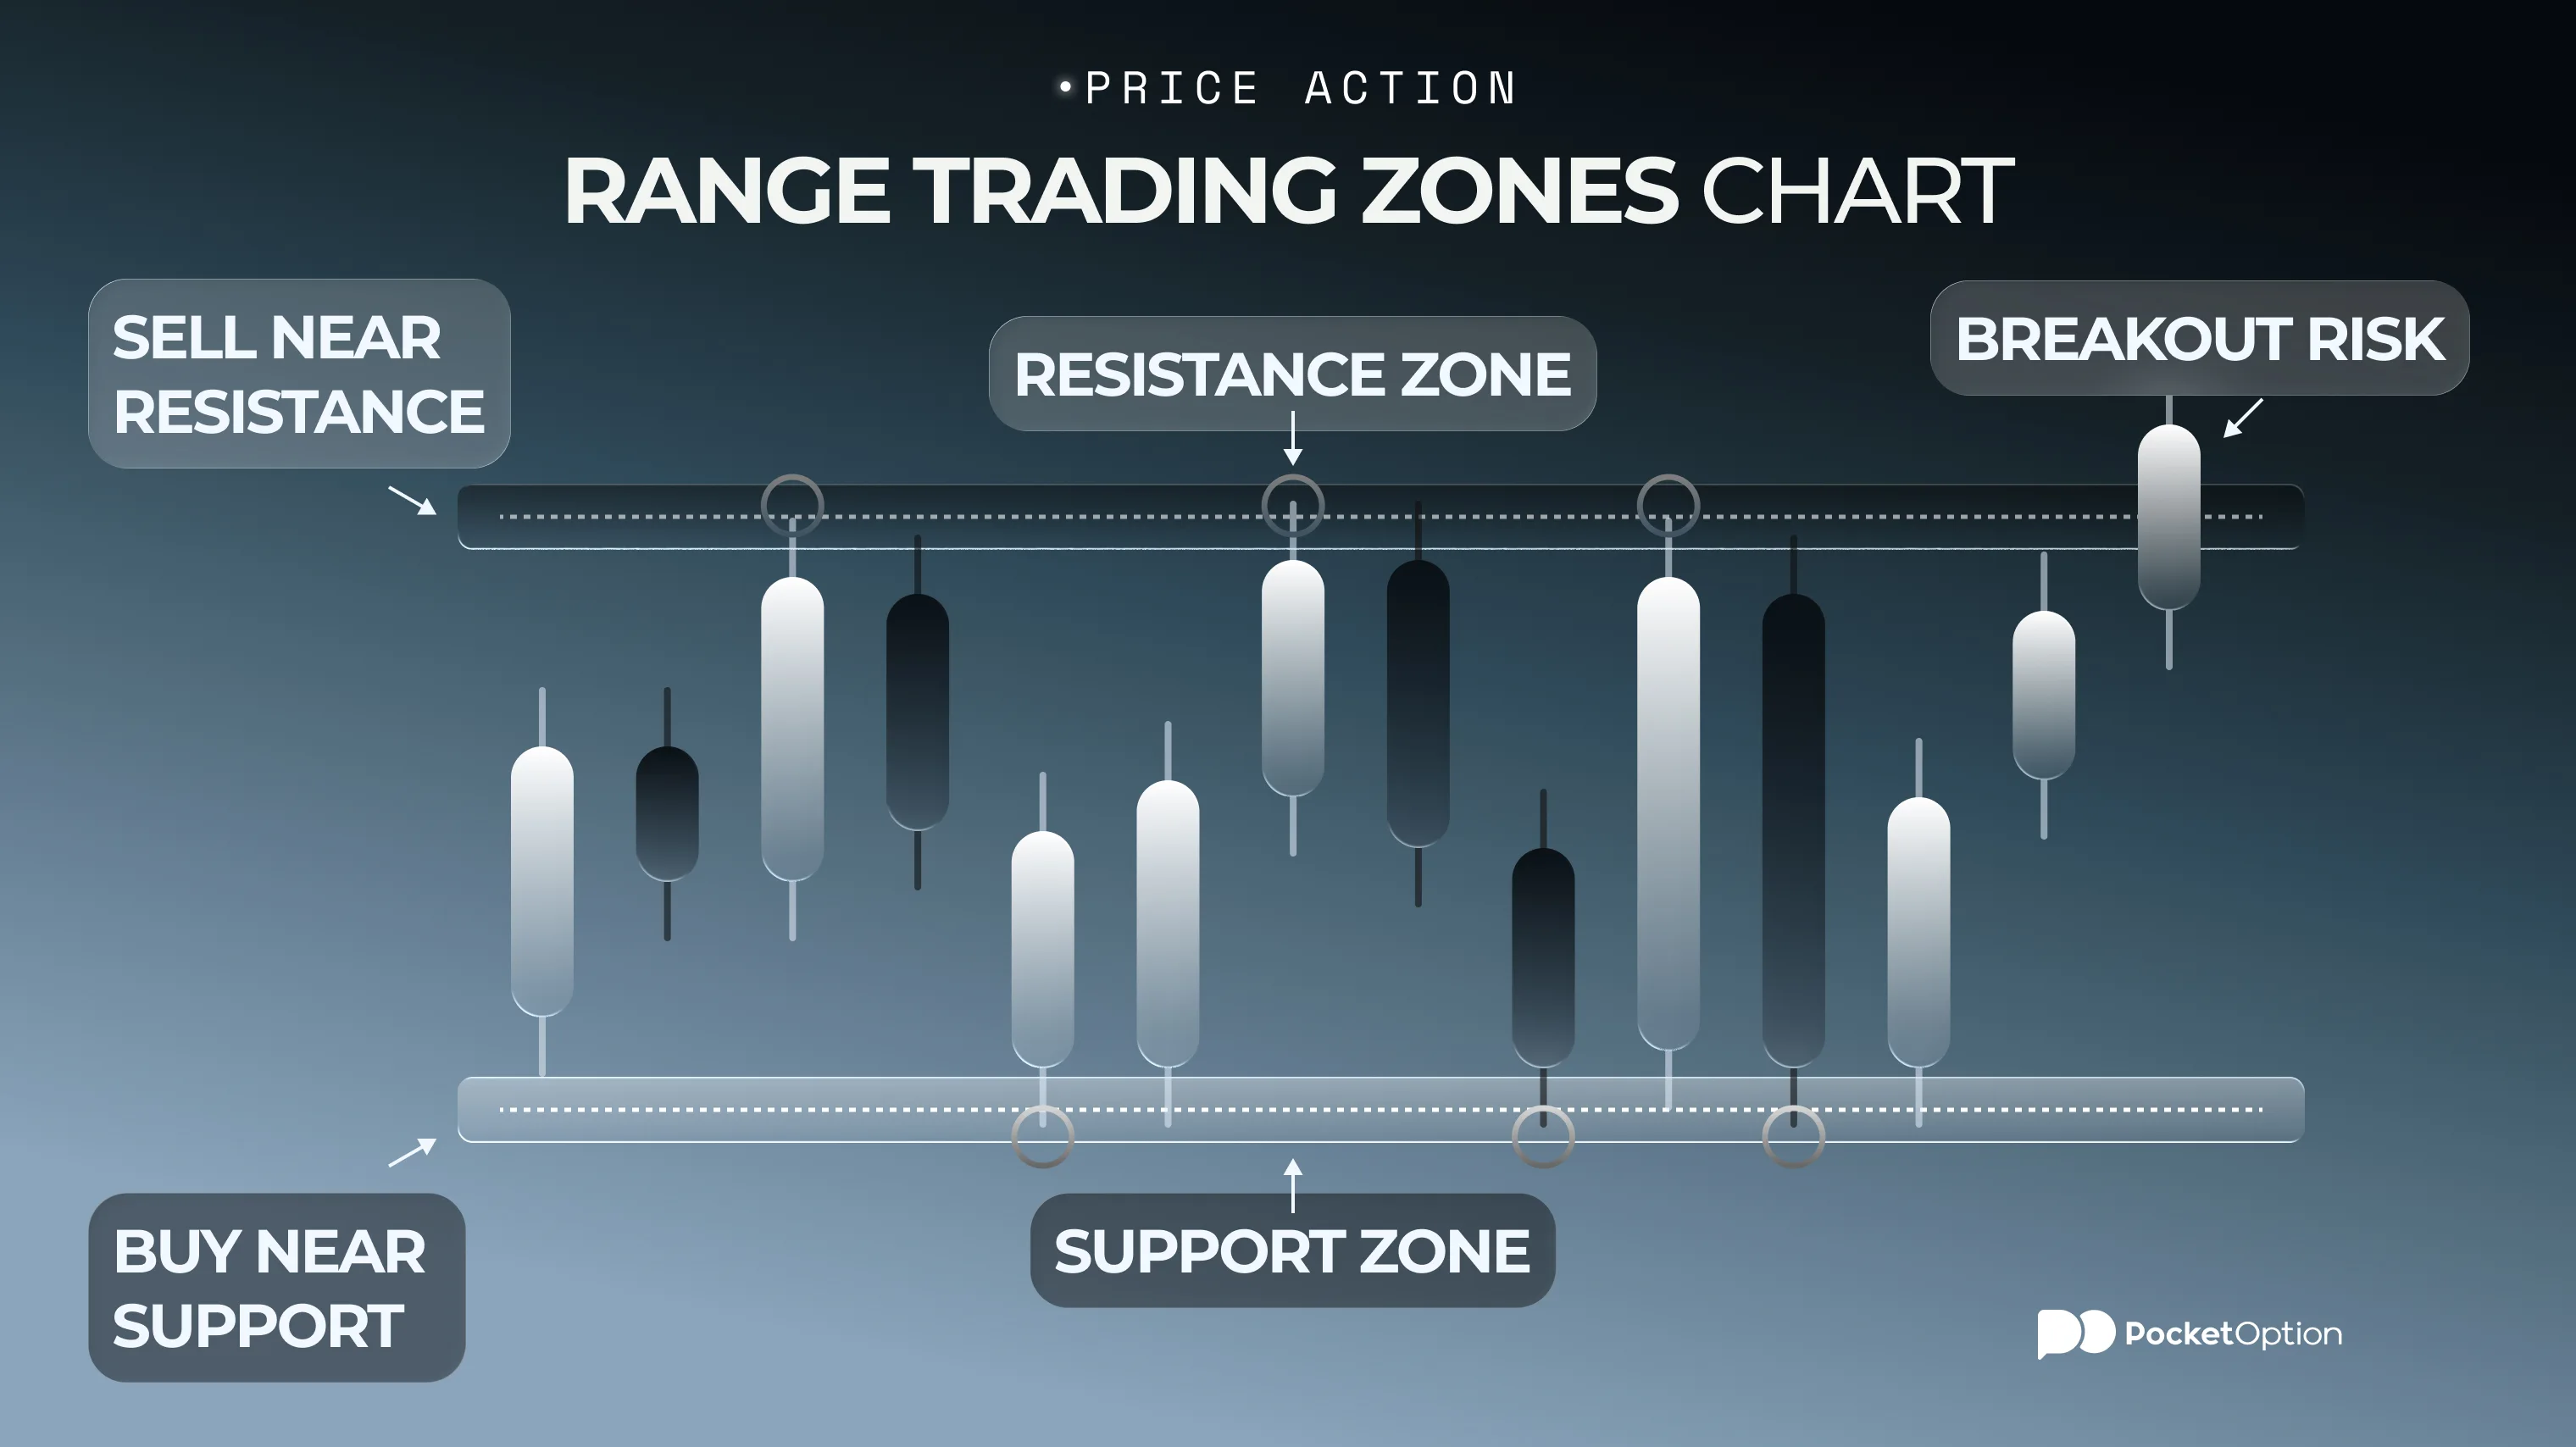
Entries work best near the walls, not the middle of the court. Buy near the floor, sell near the ceiling, since risk to invalidation is shortest there and the potential move back across the trading range is longest. A stop belongs just outside the zone, tight enough to matter but wide enough to survive a normal wick. The target sits near the opposite wall, not beyond it. Enter in the dead center instead and the math turns unfavorable fast: distance to a stop grows, distance to a target shrinks, and the trade needs a bigger move just to break even.
Example: Buying Near the Lower Boundary
Here is what is range trading logic looks like laid out with plain numbers, purely educational, not a signal to act on. Say a pair has bounced between 1.0800 and 1.0900 for two weeks, testing each side three times. Price drifts down to 1.0805, near the floor, and momentum shows signs of stalling rather than accelerating lower. A trader might plan an entry around 1.0810, a stop just under 1.0790, below the zone, and a target near 1.0890, just under the ceiling rather than betting on a break above it. Risk sits at roughly 20 pips. Potential reward sits near 80. That ratio, not a prediction about where price definitely goes, is the entire point of entering near a wall instead of the middle.
What to Do When the Range Breaks
A single wick through the ceiling or floor is not automatically a breakout. A candle closing back inside the zone, on unremarkable volume, often means the wall held. A candle closing clearly outside it, especially on a volume spike, reads differently. A retest of that level from the outside, without price diving back in, confirms the range has actually ended rather than just stretched.
Why Breakouts Need a Different Plan
This approach works from the walls inward. A breakout approach works from the walls outward, requiring genuinely different logic. Entering near resistance and betting on a breakout above that same resistance are opposite bets on the same chart. Stops, targets, and sizing all shift once price actually leaves the court, since the reference points that made the range trade make sense no longer apply.
Where This Strategy Can Be Used
None of this is exclusive to one market. Forex pairs range constantly during quiet sessions. Stocks and indices chop sideways between earnings or major news. Crypto does it too, though ranges there hold for less time before volatility knocks the ball clean out of the court, so tighter risk management matters more.
Mistakes That Break the Setup
The same handful of errors shows up again and again.
Entering in the middle of the range instead of near a wall, where risk/reward already works against you.
Ignoring an actual breakout and treating it as just another bounce.
Setting a stop so tight that ordinary noise near the wall triggers it before the real move happens.
Trading a range that is barely visible, a handful of messy touches mistaken for a clean pattern.
Trying to force range trading onto a chart that is actually trending hard.
Entering without deciding the exit first, then improvising once the trade is already open.
Risks Before You Trade a Range
A range can break without warning, often exactly when it looks most stable. A false breakout can trigger a stop and reverse straight back into the range, stopping you out right before the move you were waiting for. Major news can end a quiet market and start a real trend within minutes. The walls themselves are a judgment call, not a hard fact, and two traders can draw slightly different boundaries on the same chart. Leverage magnifies every one of these risks rather than solving any of them.
Risk Disclaimer: Trading involves significant risk of capital loss. This article is for educational purposes only and does not constitute financial advice. Always conduct independent research and consider your risk tolerance before making any trading decisions.
See more:InterestingTrading Strategies