Mean Reversion Trading Strategy
Price rarely sits still. It stretches, overshoots, then often drifts back toward some middle ground. That pull toward the average is one of the oldest ideas in reading a chart. Not every move reverses, some runs just keep going. But traders who watch range-bound conditions notice a pattern: when price gets yanked far from its typical level, the odds of at least a partial snap back tend to rise.

What Is Mean Reversion Trading?
At its core, a mean reversion trading strategy rests on one assumption: price tends to return toward an average level after a sharp move away from it. Spike well above the recent norm, or dump well below it, and a trader using this logic looks for a move back toward the middle.
Notice the word "possible." Nothing is guaranteed. A market can stay overextended far longer than seems reasonable, and sometimes the stretch is the opening leg of a real trend. Nobody here is calling a guaranteed turn. The read is probabilistic: how likely is it that this outsized move loses steam and price settles down? That is the gap between a disciplined mean reversion trading strategy and betting against every big candle. One waits for context. The other is guesswork.
New to charts? Open a free demo account and practice on 100+ assets with virtual funds, zero risk.
Try Demo AccountReading about stretched prices only takes you so far. Seeing a violent candle snap back toward the average, or stubbornly refuse to, wires the pattern into your head. Running virtual funds on live charts lets you rack up those reps before real money is on the line.
Open a demo trading account, load a volatile pair, and watch it play out in real time.
How Mean Reversion Trading Works
Mean reversion trading starts with defining the "mean" itself. That reference point is not fixed by any rule. It can be a moving average, VWAP, the midline of Bollinger Bands, or any level a trader treats as the fair center of recent activity.
Once the center is set, the rest is simple in theory. Measure how far price sits from it. A move three or four standard deviations away is the dislocation this method hunts for. This is where mean reversion trading separates the patient from the impulsive. Is momentum fading? Is volume drying up? Did the move come from a one-off news spike that has already burned out? Those answers count for more than the raw size of the gap. New to the charts? The pocket option tutorial covers the basics first.
Price Returning to an Average
So why does price drift back at all? Because extreme moves are often driven by temporary forces. A surprise headline, panic selling, a short squeeze, a thin overnight order book. These push price away from where most participants agree it belongs. Once the trigger fades, pressure rebalances. Understanding what is mean reversion in trading comes down to that push-and-pull. Deviation, then a possible return. It does not mean price always reverts. It means the forces behind a spike are usually short-lived, and once they pass, the average acts like a magnet.
Overbought and Oversold Conditions
Traders flag stretched markets using overbought and oversold readings. RSI above 70 hints the move up may be overdone. Below 30, selling may be exhausted. Here is the trap. Grasping what is mean reversion trading also means accepting that overbought does not equal "sell now," and oversold does not equal "buy now." In a strong trend, RSI can pin near 80 for days while price keeps climbing. Treat these zones as a heads-up, not a trigger.
Indicators Used in Mean Reversion Trading
No single tool defines this style. Most traders combine a couple to cross-check each other. Some of the most common mean reversion trading strategy examples rely on the indicators below, each answering a different question about how far a move has stretched.
Indicator | What It Shows | How Traders Use It |
|---|---|---|
Moving Average | Average price over a period | Center line, distance from it flags stretch |
Bollinger Bands | Volatility bands on a moving average | An outer band tag marks an extreme move |
RSI | Momentum of recent moves | Above 70 or below 30 flags overbought or oversold |
VWAP | Volume-weighted average price | Intraday anchor, price far from it signals imbalance |
Standard Deviation | Distance of price from its average | Measures how unusual a move really is |
Pair two or three and you get context. Lean on one and you get false signals.
Mean Reversion Trading Strategy Example
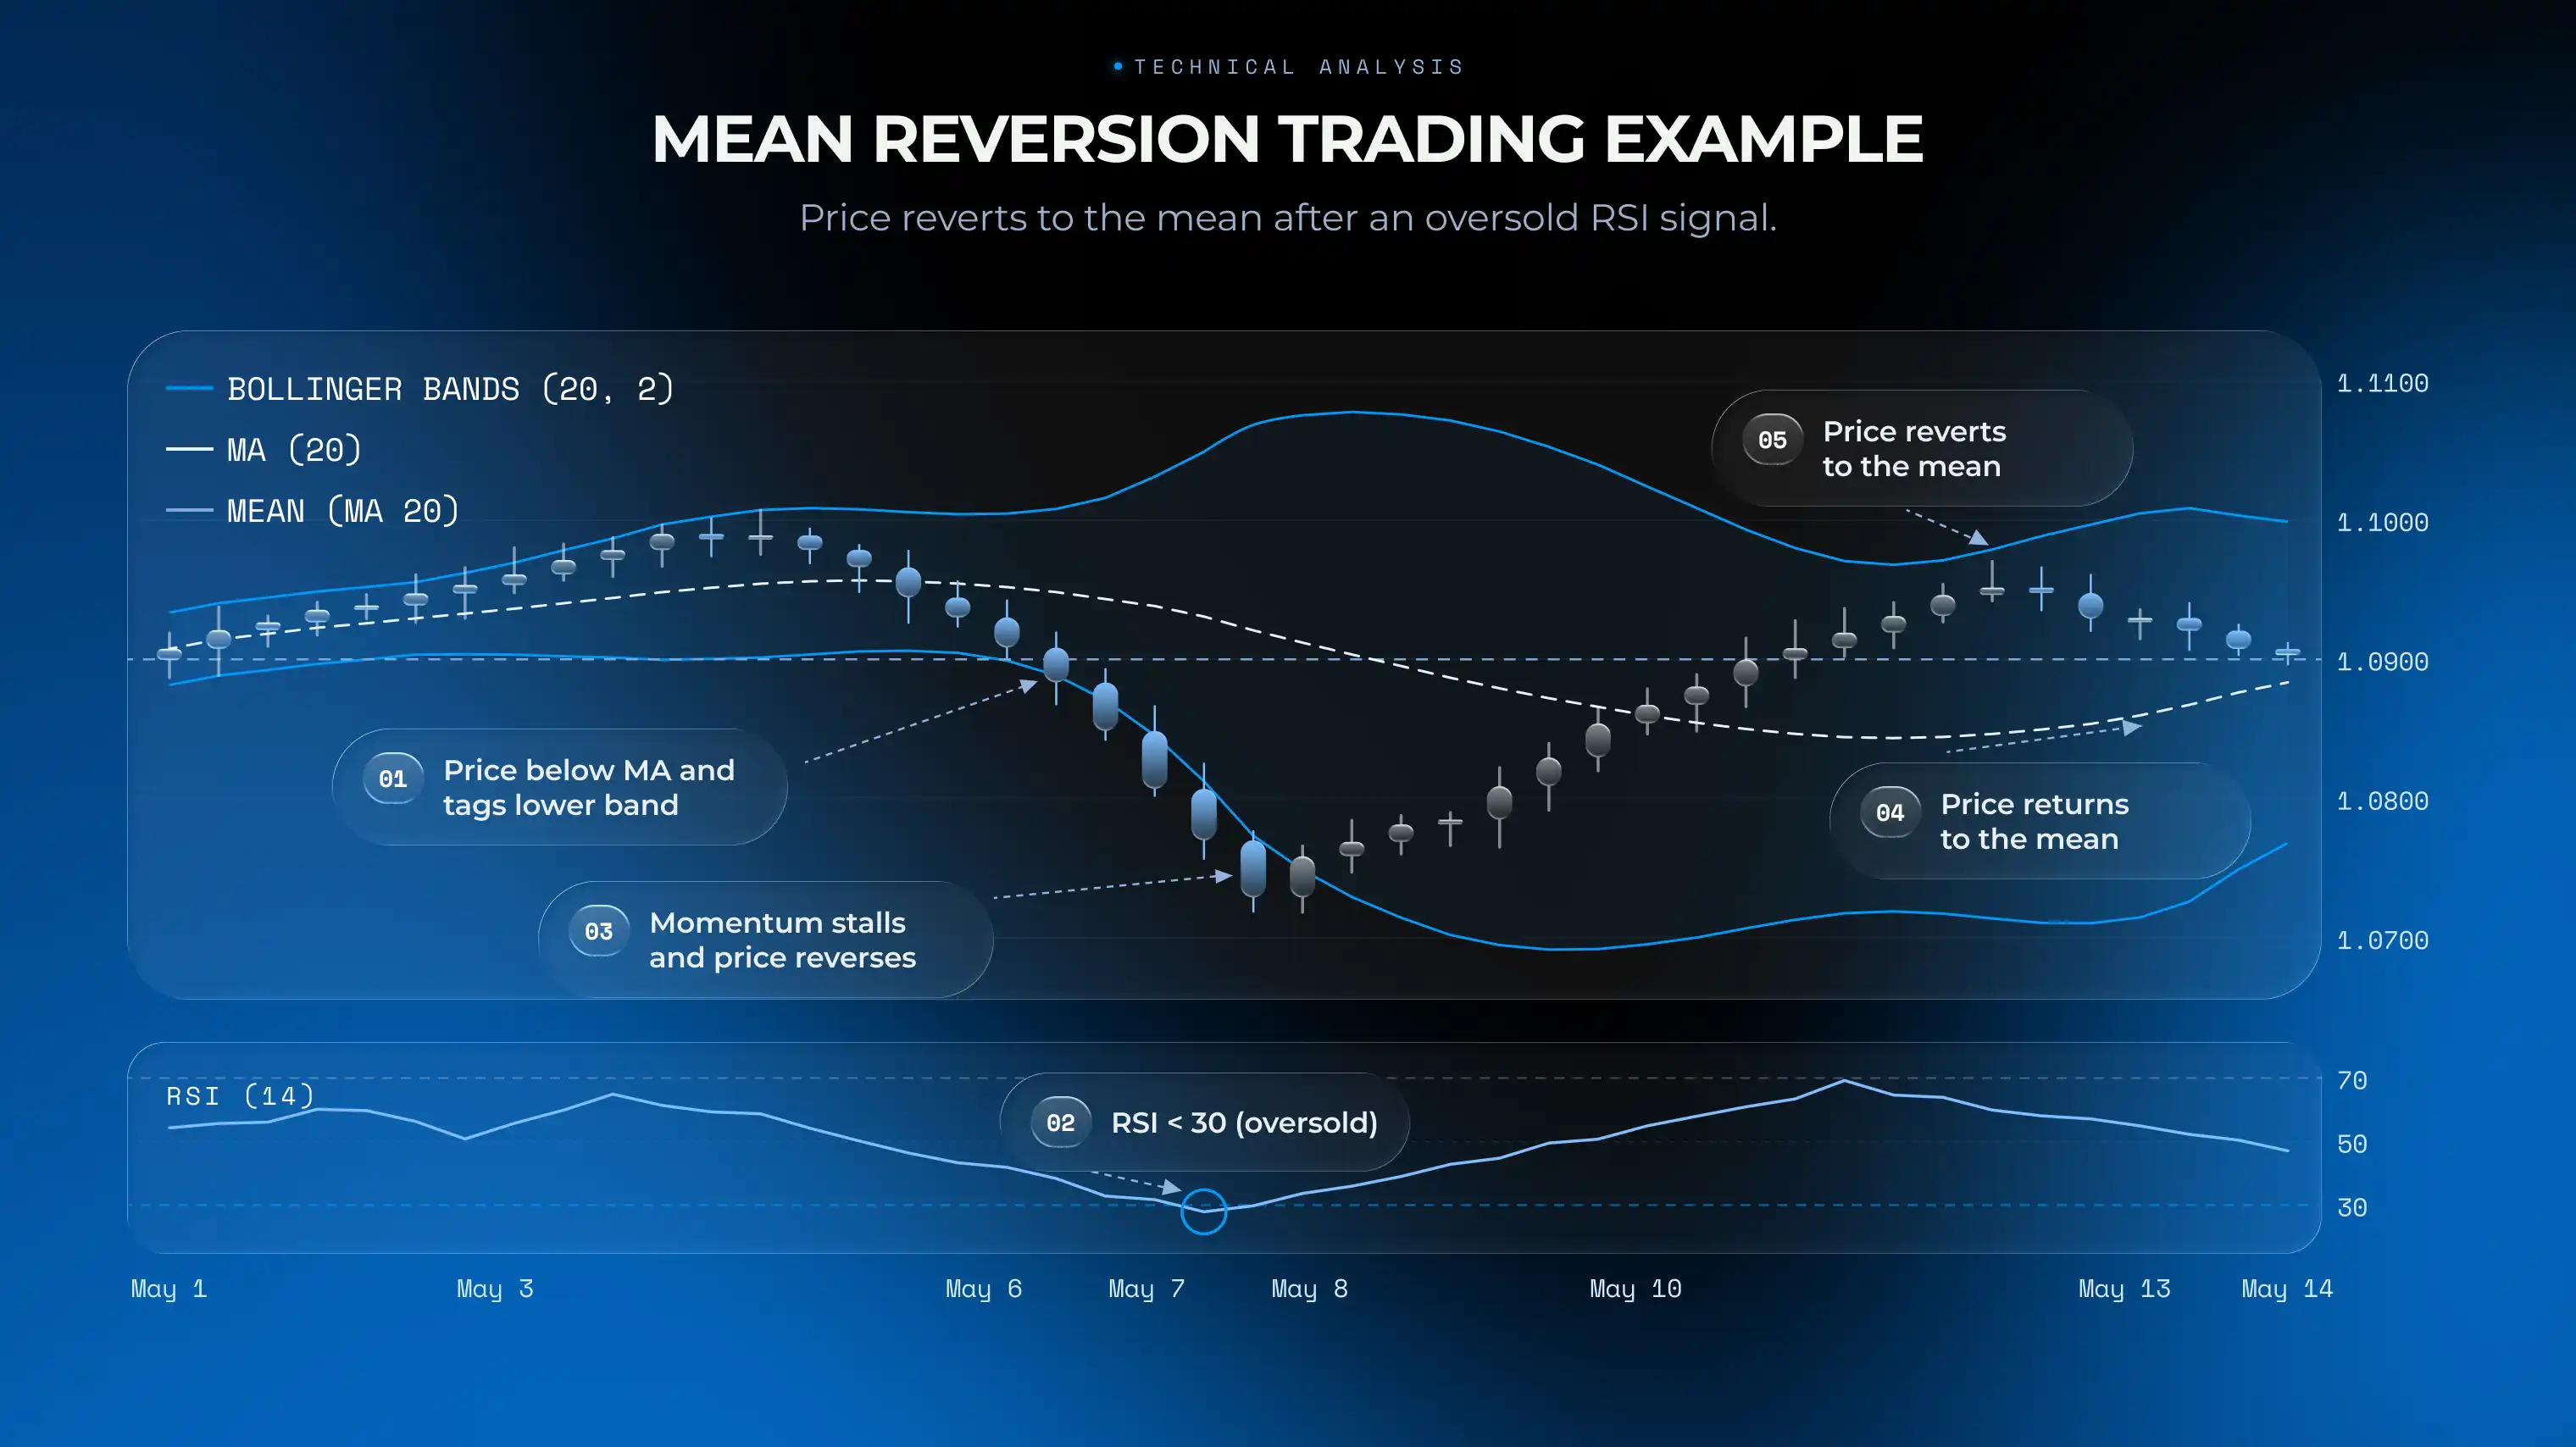
A plain mean reversion trading strategy definition is useful, but a real setup makes it click. Picture a currency pair ranging quietly for days. A scheduled data release hits and price rockets far above its 20-period moving average, tagging the upper Bollinger Band. No follow-through buying appears, volume fades. That is what this style watches for. The trader does not chase the spike. They wait for momentum to stall before considering a position aimed back toward the average.
Long Trade Example
Now the bullish case. Price dumps well under the moving average after a wave of panic selling, RSI slips beneath 30, and sellers look tapped out. A trader applying mean reversion in trading might hold off until a higher low forms, or a rejection candle prints near the lower band. Protection sits just under the latest swing low, a logical exit rides back toward the moving average. Outcomes are never promised, only a plan with capped risk.
Short Trade Example
Now the mirror image. Price surges well above the average, buyers look exhausted. Someone trading mean reversion waits for signs the push is running out of gas, a failed new high or a bearish engulfing candle near the upper band. The entry waits on confirmation, not the spike itself. Protection goes above the latest swing high, target set back toward the mean. Same caveat: if a real trend is starting, that overextended move can keep running and stop you out.
Mean Reversion vs Trend-Following
These two styles pull in opposite directions: one fades extremes, the other rides them.
Feature | Mean Reversion | Trend-Following |
|---|---|---|
Core idea | Price returns to an average | Strong moves tend to continue |
Best market | Range-bound, choppy | Strong directional trends |
Entry timing | After a stretched move | On breakout or trend confirmation |
Main enemy | A trend that keeps running | A choppy, sideways market |
Typical stop | Beyond the recent swing | Against the trend structure |
Mindset | Contrarian | Momentum-driven |
Neither is "better." Trend-followers get chopped up in a range. Reversion traders get run over in strong trends. Knowing which regime you are in matters more than the tools.
When Mean Reversion Works Best
This approach shines in calm, range-bound markets: an asset oscillating between clear support and resistance, no dominant direction, volatility present but not violent. There, stretches away from the center tend to fade, and the average acts like a rubber band. It struggles when a strong trend takes hold. During a powerful rally or a hard sell-off, overbought and oversold stop meaning much. Major news, sharp breakouts, and regime shifts are poison for this style. The rule of thumb: reversion likes boredom.
Common Mistakes in Mean Reversion Trading
Most blow-ups come from the same handful of errors. Watch for these:
Fading a strong trend too early, before any sign of exhaustion.
Treating every deviation as a signal, when most are noise.
Skipping the stop loss, the fastest way to turn a small loss into a big one.
Ignoring the news calendar and getting caught on a fundamental shift.
Leaning on one indicator with zero context.
Forgetting volatility and market regime, then wondering why the range broke.
Averaging down into a loser, hoping the reversion bails you out.
Averaging down deserves its own warning. Piling into a losing trade because "it has to come back eventually" is how accounts get emptied. The average owes you nothing, and conviction is no substitute for a stop order.
Risks of Mean Reversion Trading
Be blunt about the downside. Price may simply not return to the mean. A strong trend can extend for weeks while you wait for a bounce that never arrives. Overbought and oversold zones can persist far longer than any oscillator suggests. False signals are constant, and high volatility can blow through your stop before any reversion starts. None of this makes the style useless. It makes risk control non-negotiable. Position sizing, hard stops, and respect for the trend separate a workable method from a slow bleed.
Risk Disclaimer: Trading involves significant risk of capital loss. This article is for educational purposes only and does not constitute financial advice. Always conduct independent research and consider your risk tolerance before making any trading decisions.
See more:InterestingTrading Strategies