
MA, RSI, and MACD for Swing Trading on Pocket Option
A swing trade is usually held for several days, sometimes up to a few weeks. For such trades, an entry point is much more important than the total number of placed orders. One strategy combines Moving Average, RSI, and MACD to find the best entry points. It's one of the best technical indicators for swing trading setups, and can be freely tested on Pocket Option without any committed funds.

Why Combine MA, RSI, and MACD for Swing Trading
A single indicator is rarely enough. A moving average is used by most traders, both on scalping and daily setups, as it expertly shows the general trend of the price. But often it says next to nothing about where a trend is about to end. Same with RSI reading: it can flag an extreme point, an abnormal deviation, but that extreme can be ignored by price for longer than expected, because the price continues the trend. RSI in a vacuum rarely works. MACD can add a momentum layer to both MA and RSI, to see if a shift is actually taking place, or if not much is changing underneath.
That's why when these 3 indicators are read together, many false signals are excluded. The moving average can set your bias for general direction, RSI can time better entries, and MACD confirms if the tides are indeed turning, or if you're getting a false positive. This 3-factor approach is one reason MA, RSI, and MACD are considered the best technical indicators for swing trading, both by home traders and experts.
What Each Indicator Contributes
Moving Average: Identifying the Broader Trend
To see a general trend, a longer-period moving average (50 or 100 period) is often used. It can be either simple, or exponential. Traders use it to confirm their bias on the swing timeframe. If price sits above a correctly chosen average, the bias is treated as bullish. If it's below a falling average, traders adopt a bearish average, and their trades will be predominantly shorts (or sells, if they're trading in a Pocket Option Quick Trading mode).
The moving average is not used for entries here, because in swing trading orders are often held long enough that a general trend can counter-balance a mis-timed entry, and the trade will still end up in the red. If you want to treat MAs as entry points, you can see how moving averages for day trading work, but for swing trading, they provide only bias.
RSI: Timing Entries at Pullback Extremes
RSI indicator shows how fast and how far the price moved recently (over last 7, 14, 20 periods, or however much you set). It's set on a scale of 0 to 100. If the number is under 30, this means the price has been rapidly going down, and if it's above 70, it was rapidly going up. Most of the time RSI for a ranging asset stays around the 40-60 mark.
In the swing strategies, RSI is not used to call for reversals. People just watch for pullbacks in general trends (established by MA). If RSI dips to 30 or 40 during a general uptrend, this means a pullback might be in play, and a buy (a long) might be worth executing. The same logic applies in reverse: in a downtrend, a bounce to 70 is where people often start looking for signs of returning to the general trend.
Often for swing trading RSI settings are adjusted, according to the 'speed' of the asset. For some, 14-period RSI is fine, but some faster moving assets require 7-period RSI, for quick reactions.
MACD: Confirming Momentum Shifts
MACD shows how MAs (moving averages) relate to each other. How fast one responds to slow one, and which one is dominating.
For swing trading, when MAs cross, this is usually a signal worth watching, and MACD has all the intricacies of such a reaction built in. If a bullish crossover lines up with recent RSI pullback, and long-term MAs show uptrend, these are 3 layers of confirmation, which means a trade (or an investment) is much more likely to be successful.
Recommended Settings for Swing Trading Timeframes
Settings should be adjusted to each asset, and each timeframe, to see how well each one performs. It can be done through a demo account or backtesting.
Indicator | Recommended Setting | Timeframe |
|---|---|---|
Moving Average | 50-period EMA (trend filter) | 4H or Daily |
RSI | 14-period, sometimes 7-period | 4H or Daily |
MACD | 12, 26, or 9 (standard) | 4H or Daily |
The Daily chart gives the cleanest read on trend, but the 4H chart is often used to fine-tune the entry.
Buy Entry Rules
A long entry trigger is:
Price holds above the 50 EMA on the Daily, showing a clear uptrend.
RSI on the 4H has pulled back to 40 or even 30, but is now turning upward.
MACD on the 4H has a bullish cross.
Entry is then placed on the candle that confirms RSI turn + MACD alignment. It is not placed on the first sign of a dip, but on the confirmation of a reversal.
Sell Entry Rules
A short entry has the same trigger, but in reverse:
Price holding below 50-period EMA on Daily (downtrend!).
RSI on 4H goes into the 60 to 70 zone, but starts going downward (counter-move is exhausted).
MACD on the 4H has bearish signs.
When RSI and MACD both confirm the signal, an entry is cautiously placed.
Setting Stop-Loss and Take-Profit Levels for Swing-Trading Strategy
A stop-loss should be placed just beyond recent high or low. There's no fixed pip distance this time. Traders usually follow the market structure, and not some number.
Take-profit levels, on the other hand, follow the number! They are placed to keep the risk-reward ratio at least 1:2, preferably 1:3. You can count the pip distance to recent swing high or low, and then double or triple that number (depending on your strategy), and set that as your take-profit.
Keeping TPs at 1:1 raises the bar for how often the strategy needs to win to stay profitable, since spreads and commissions take a proportionally bigger bite out of a smaller target. Aiming for 1:2 or better leaves more room for error.
Position Sizing and Risk Management for Swing Trades
Swing positions encounter more price fluctuation than when you daytrade. Therefore, you have wider stops, and position size needs to account for that. The usual approach is to risk no more than 1-2% of the account on any given trade, meaning the loss if price falls to your stop-loss level should stay within that 1-2%, not the position size itself. Position size is then calculated backward from that risk amount and the distance to your stop. Adding on top of a losing position is usually a recipe for disaster.
Sound risk management means also limiting the amount of open swing trade order at any given point in time. Several ongoing trades for correlated assets can easily push you above 2% risk threshold. Then, a single unexpected market move can significantly hurt your account, even when each individual trade was sized correctly.
Best Time Frames and Markets for This Strategy
If you are doing swing-trading, 4H and Daily charts are the two standouts. Anything shorter is considered daytrading or even scalping. Those don't generate quite as strong RSI and MACD signals.
Best markets to trade are usually currency pairs and metals, because they have clear trending behavior. Large cap stocks and major indices are also famous for their clean price action. Ideally, they should be trending at the point of a trade, because if the market chops sideways, it can produce more whipsaw signals from all three indicators, even with finely-tuned settings.
Setting Up the Strategy on Pocket Option
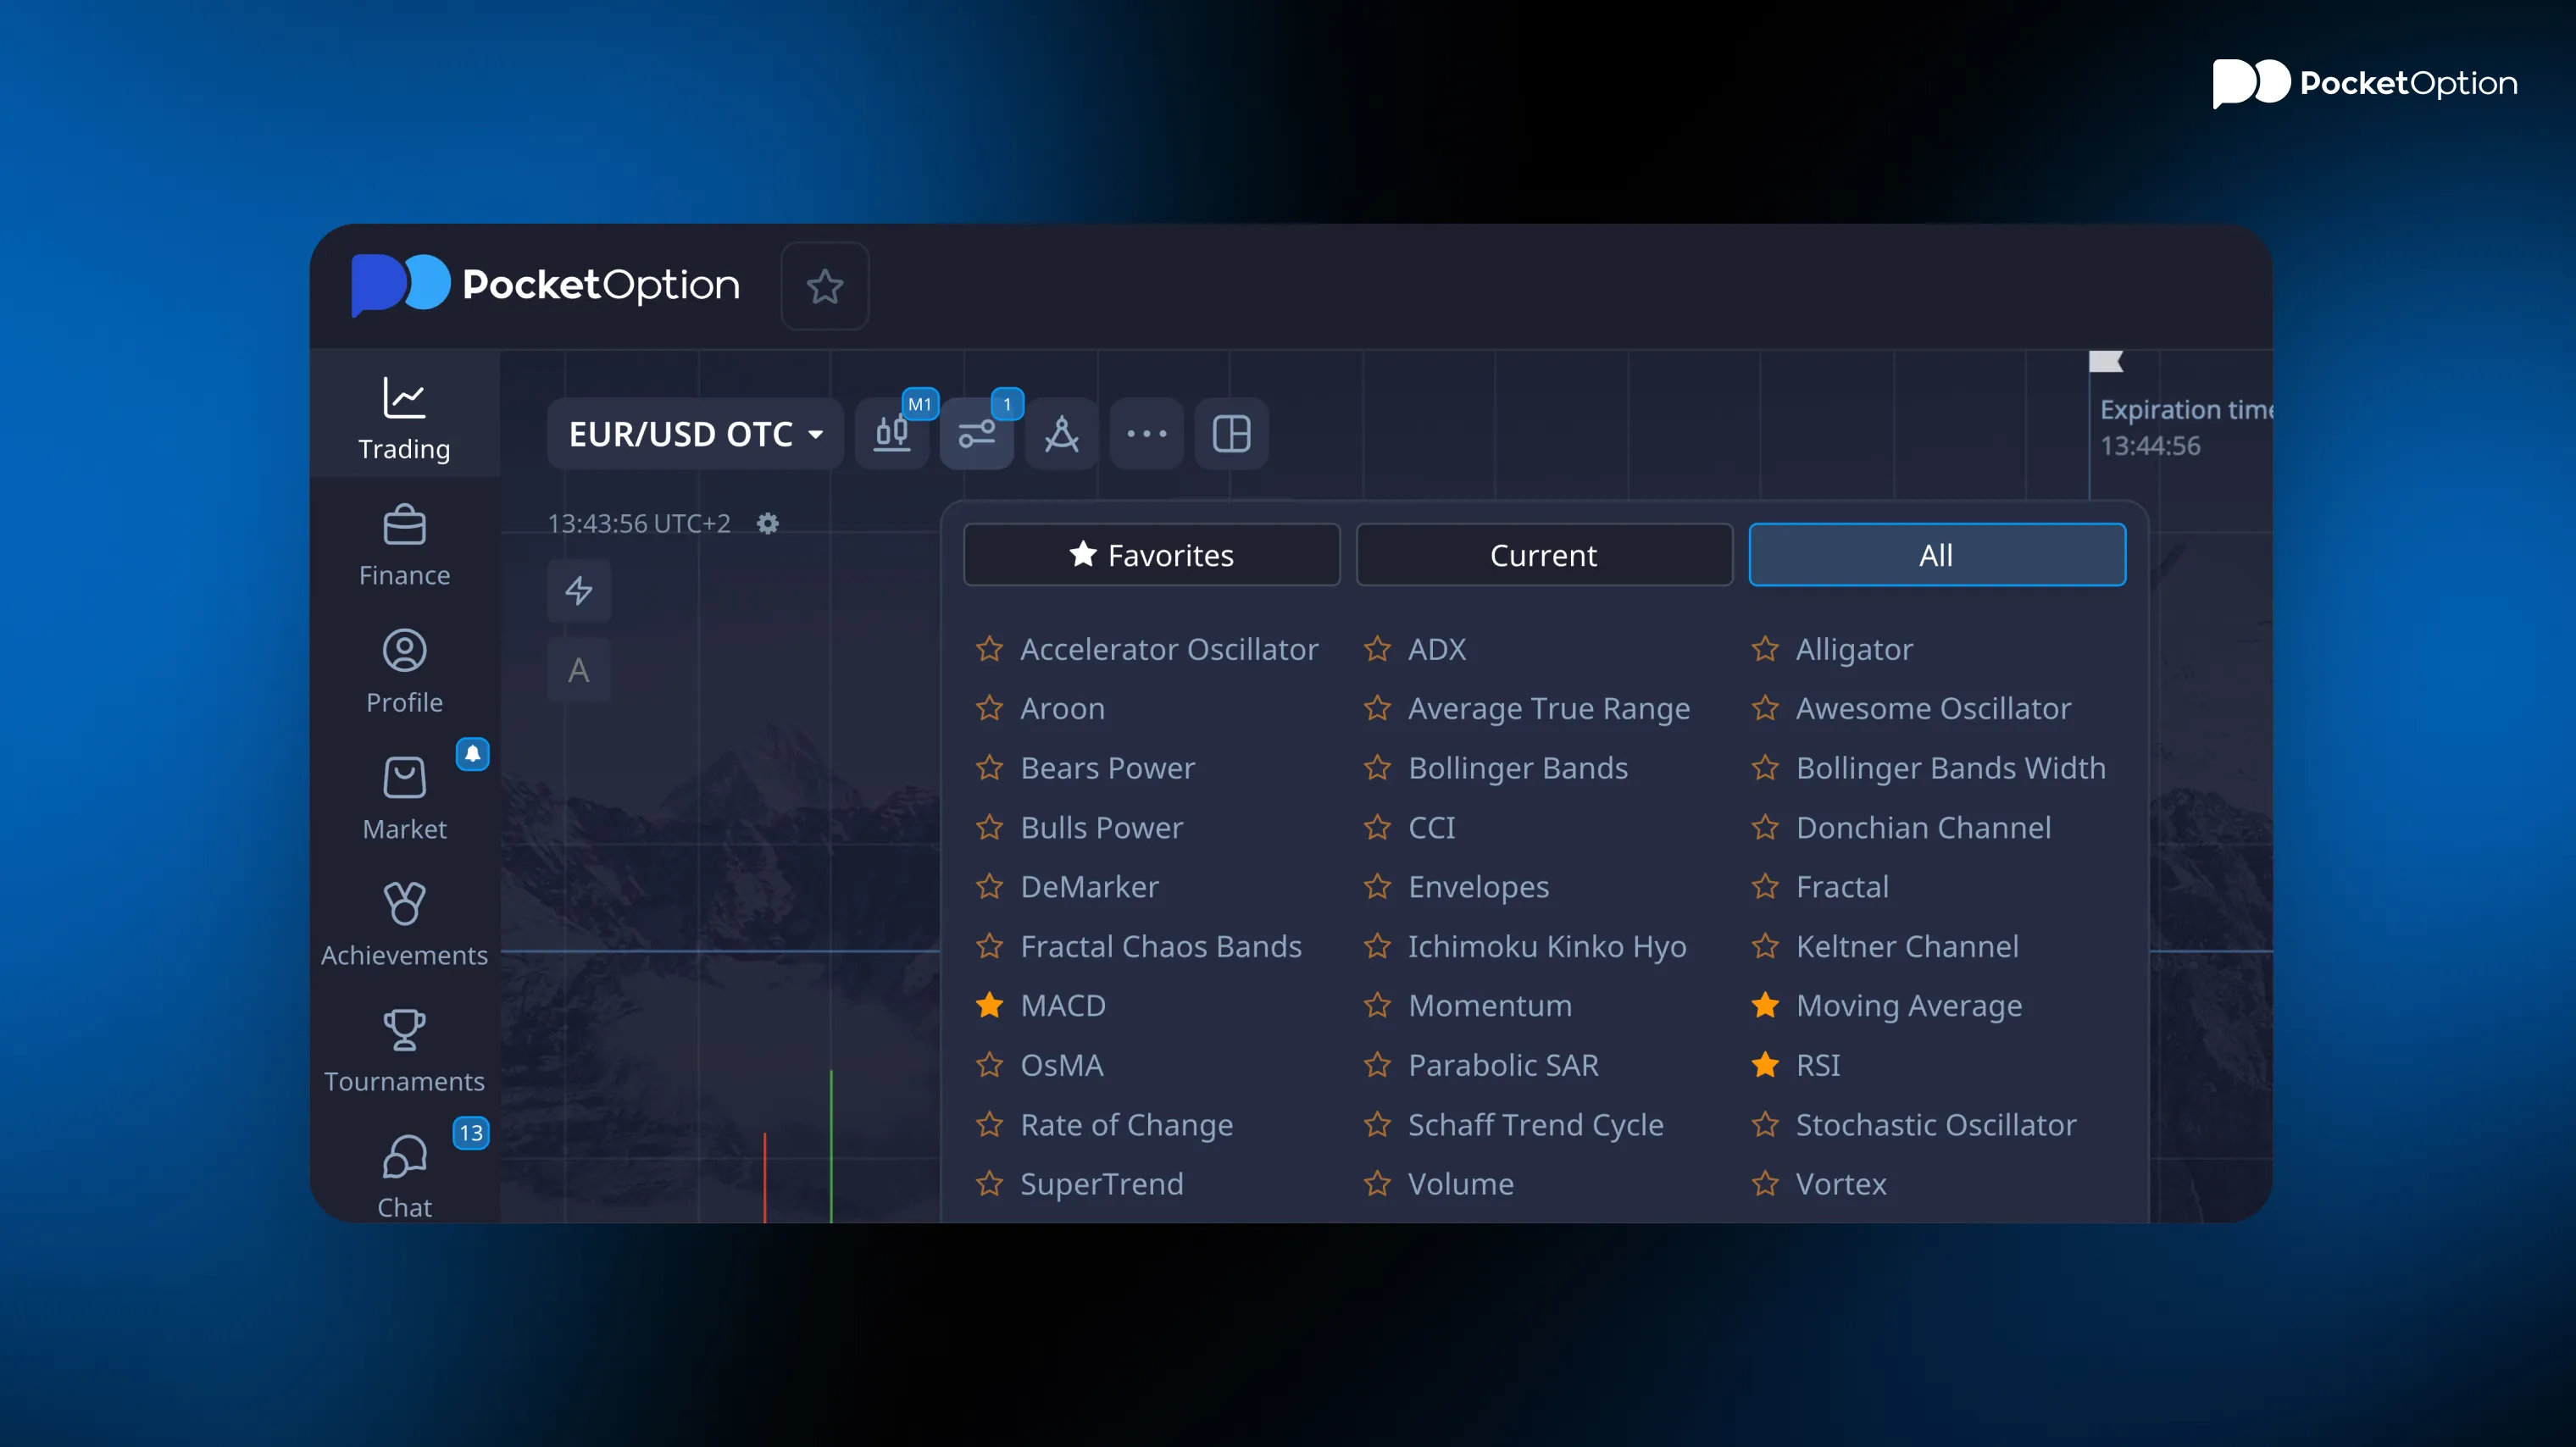
Open Pocket Option chart. Add the Moving Average, RSI, and MACD indicators to it. MA will be shown on the chart itself, while RSI and MACD will be set below it. Set the chart to the 4H or Daily timeframe in MetaTrader mode, matching the swing approach described throughout this guide.
Quick Trading on seconds or minutes timeframes is a fundamentally different, short-term adaptation of the same three indicators, not the swing strategy itself. It would need its own separate testing and rules, such as shortening the RSI to 7, or even 6 or 5, rather than simply reusing the settings described here.
Each indicator can be adjusted to fit your asset and current specific environment. There are no set rules for them. Some traders prefer a faster read on trend changes, so they shorten moving average period significantly too, and even change MACD levels. If you trade calmer markets, however, there might be no need for it.
With Pocket Option
Get StartedBacktesting Before Trading Live
Before any funds are placed behind any strategy, it's wise to test the entry and exit rules vs historical price data, across different market conditions. This can be done in MetaTrader, for free, in the backtesting tool. A demo account serves a different, complementary purpose: rather than rapidly testing years of historical data, it lets you practice executing the rules in real time, without historical shortcuts, before committing real funds.
An in-depth explanation of how to do this can be found in our guide on how to backtest a trading strategy. It walks through metrics worth tracking for understanding the strategy quality and its performance. You should also test your various risk management levels against those results, to see which position size seems to fit you the best over a long period of time.
Common Mistakes When Combining These Indicators
Trading against the moving average's trend, and then holding a position for a long time. This can lead to wiping all of the profits, from one trade gone wrong.
Entering as soon as RSI touches the pullback zone, and not waiting for it to turn back in the direction of the overall trend.
Treating every MACD crossover as a signal, and not connecting it with RSI for a double-confirmation.
Skipping a stop-loss for any reason, because 'you just feel it' or 'setup looks ideal' (though this mistake can only happen in the non-QT mode).
Practicing on the Pocket Option Demo Account
Demo account completely removes any financial consequence of early mistakes while finalizing the rules for your trading. You can comfortably review which signals are holding up, and which markets/timeframes you prefer, without losing any funds in the process.
General principles of position sizing and stop placements should carry over from demo to live trading 1 to 1, without the need for adjustment.
on a demo account with $50,000 funds
Try DemoConclusion
MA, RSI, and MACD can each cover a different weakness of the others. The moving average can set direction, RSI helps to narrow down the timing, and MACD confirms that momentum is indeed right for the trade. Combining these indicators can lead to better swing trading strategy, and that is why they are considered to be the best technical indicators for swing trading.
Sign up in minutes and start applying this strategy
Register NowDisclaimer: Trading involves risk of capital loss, and may not be suitable for all investors. Past performance of any strategy, including the one described here, does not guarantee future results. Always test strategies on a demo account and only trade with funds you can afford to lose.
See more:InterestingTrading Strategies