Head and Shoulders Pattern: Trading Strategy and Confirmation Signals
Chart patterns can feel like tea-leaf reading. Then one plays out right in front of you, and the doubt fades. This formation is the one that converts skeptics. Clear shape. Clear trigger. A clear way to plan a trade around it. So this guide stays simple. What the pattern is, how to read the neckline, which signals actually confirm it, and where a trader might enter, park a stop, and take profit.

What Is the Head and Shoulders Pattern?
The head and shoulders is one of the most watched reversal shapes out there. It turns up near the tail end of an uptrend, right when buyers start running low on fuel. The name is literal. Three peaks in a row, the middle one taller than the two beside it. Spot it, and traders read a warning: the trend may be about to flip from up to down. A crystal ball? No. But as reversal signals go, few are this recognised or this heavily traded.
Want to practice reading chart patterns on live prices? Open a free demo account and try it on 100+ assets with virtual funds.
Open DemoPatterns make far more sense on a live chart than in a diagram. Once you have watched a few form in real time, the shape starts to jump out at you, and so do the fakeouts that trap impatient traders. That kind of pattern recognition is a skill, and like any skill it is best built where a mistake costs you nothing.
A demo trading account lets you scan live markets with virtual funds, so you can hunt for setups and test your reads before real money is ever involved.
Anatomy of the Pattern
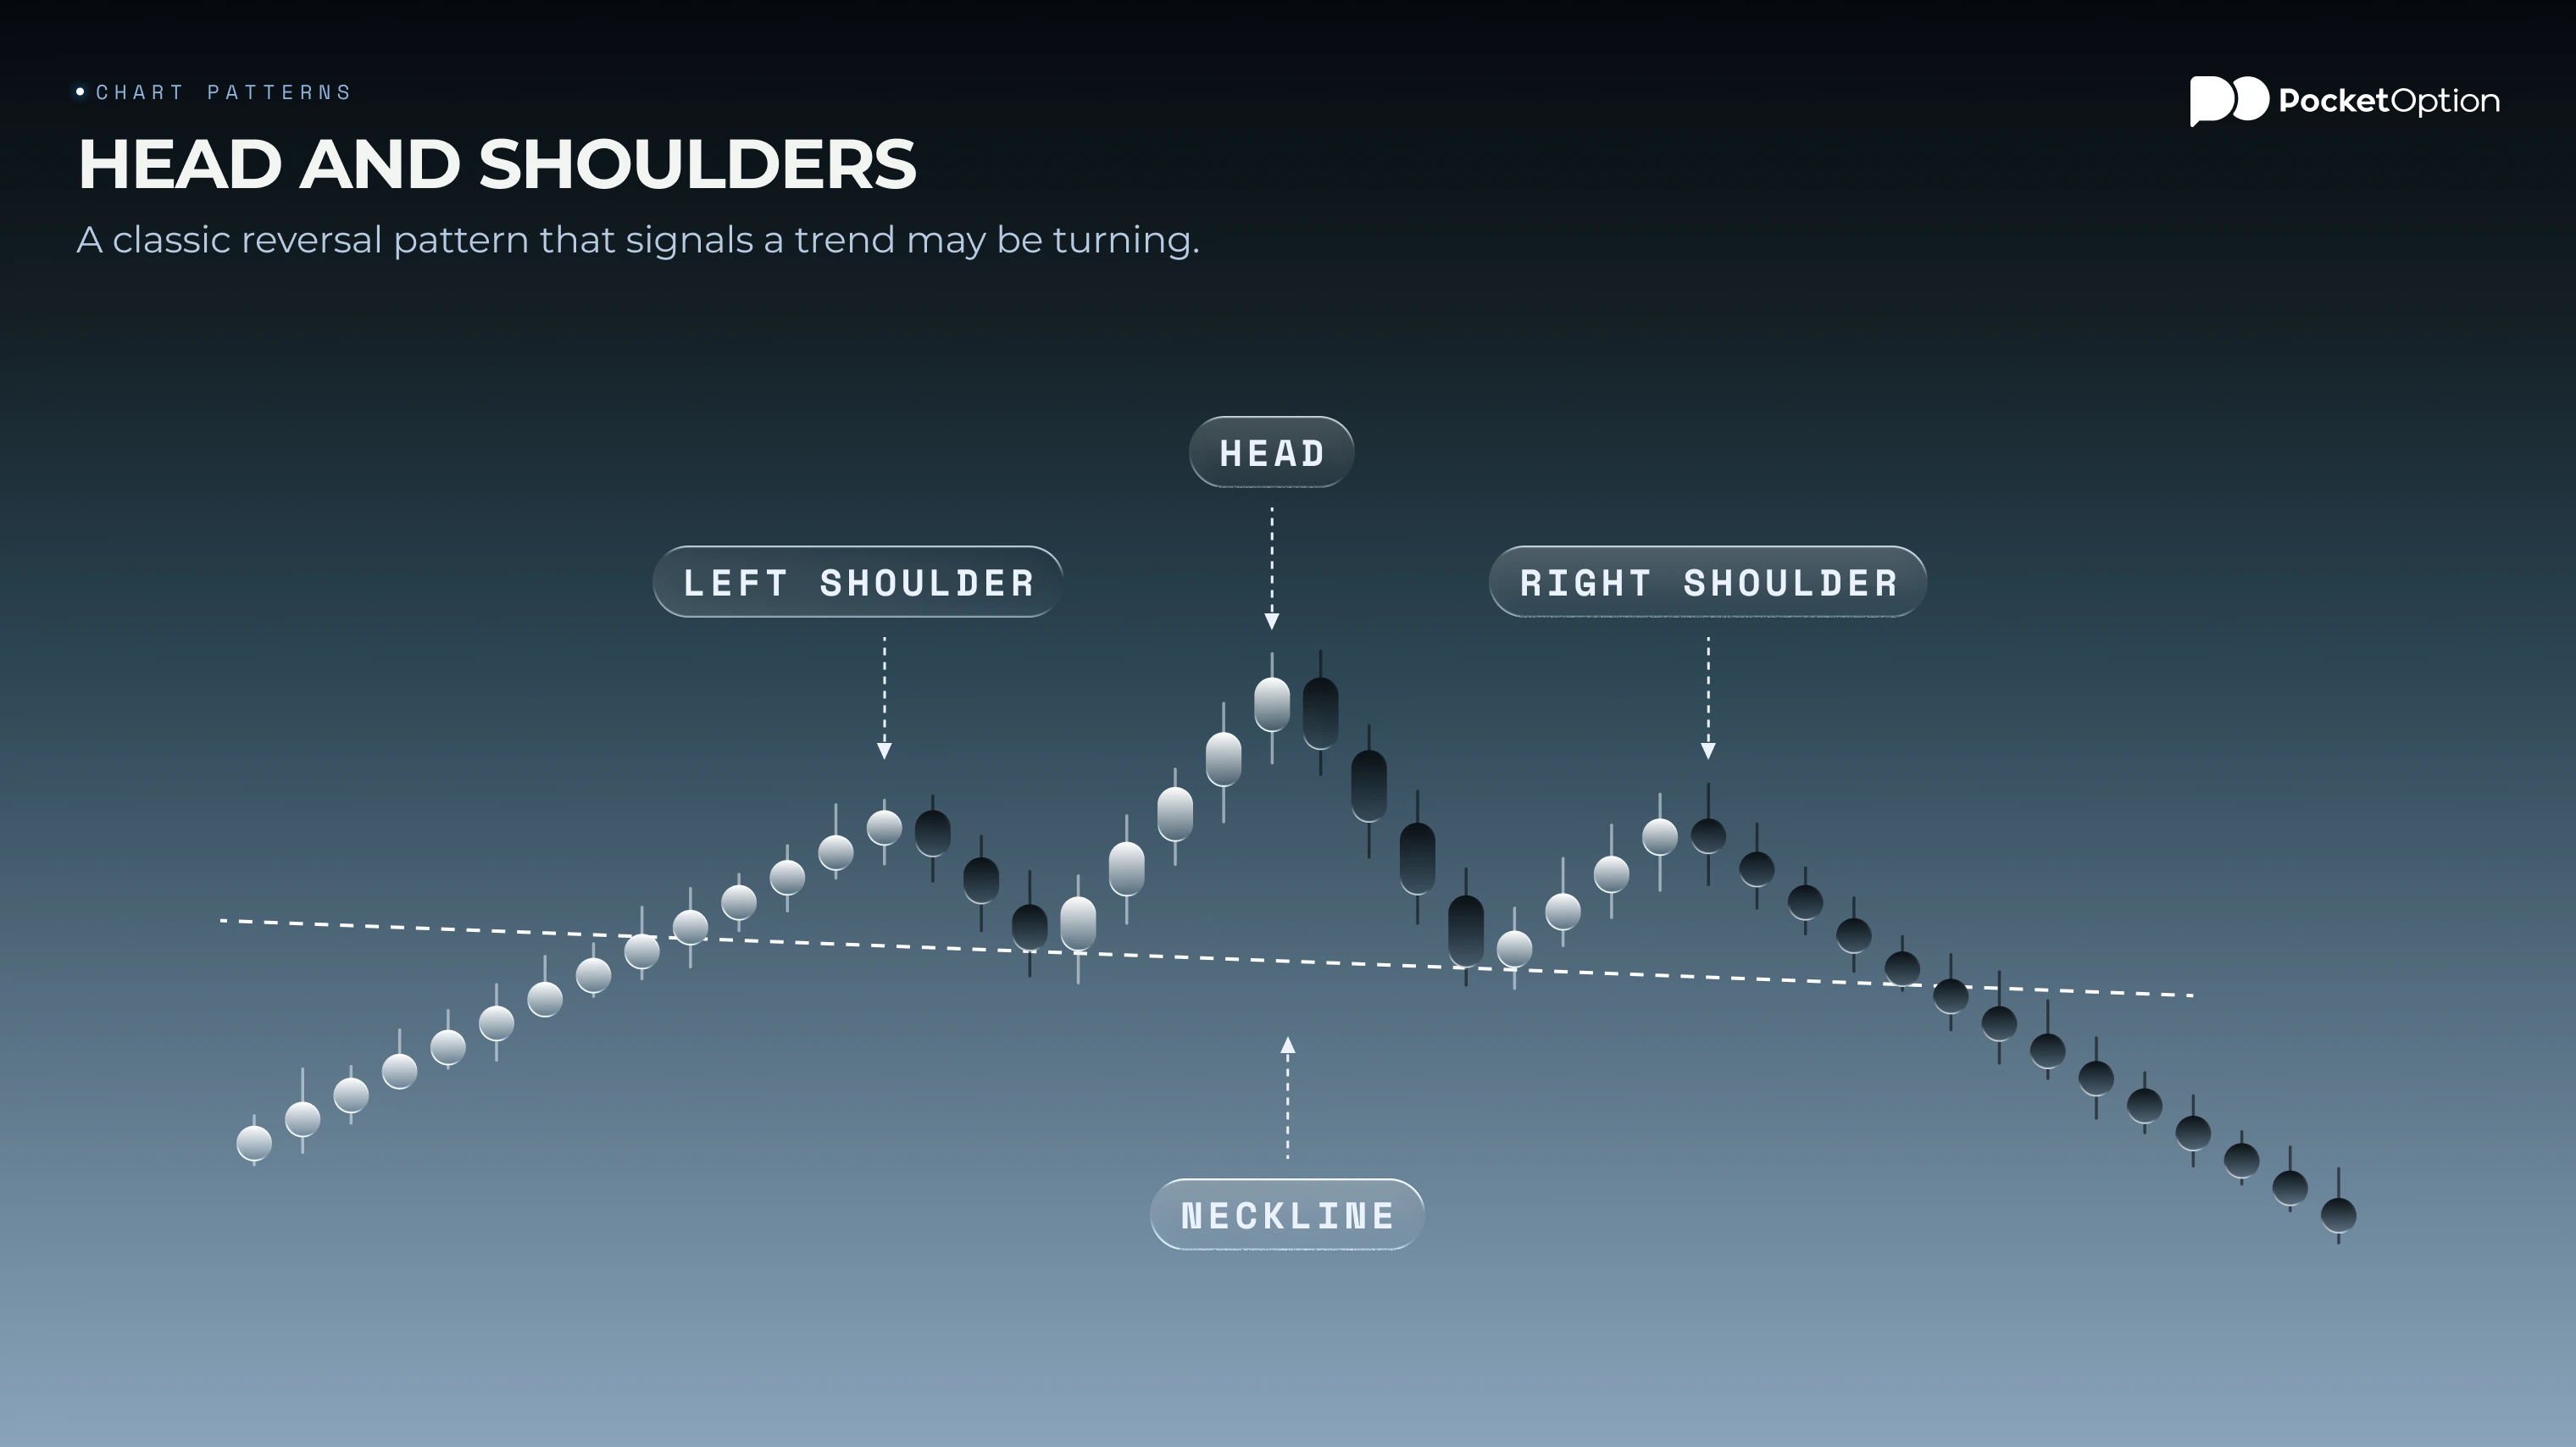
Every head and shoulders pattern is built from three parts, and knowing each one makes the whole thing easy to spot. The left shoulder forms first: price rises to a peak, then pulls back. Next comes the head, a higher peak, followed by another pullback. Then the right shoulder, a peak lower than the head and roughly level with the left shoulder. Volume often fades as the shape develops, a quiet clue that momentum is draining. Connect the two pullback lows and you get the neckline, the single most important line in the whole setup. If any of this feels abstract, the pocket option tutorial shows how to read price action step by step.
Understanding the Neckline
The neckline is where the pattern lives or dies. Draw it by joining the two lows that sit between the peaks. While price holds above that line, the shape is only forming, nothing is confirmed yet. Break and close below it, though, and the reversal signal fires. That break is what traders wait for. Now flip the whole thing. The inverse head and shoulders pattern forms at the bottom of a downtrend and mirrors everything. The neckline sits above the shape, and a break upward through it points to a move higher instead. Same line, same idea, opposite direction.
Head and Shoulders Trading Strategy
Trading the head and shoulders stock pattern follows a clear sequence, and rushing any step is how traders get burned. First, you identify the shape while it is still forming and mark the neckline. Second, you wait, without jumping the gun, for price to actually break the neckline. Third, you look for confirmation that the break is real, not a fakeout. Only then do you consider an entry, with a stop loss and a profit target already planned before you click. The pattern gives you a structure. Your job is to follow it with discipline instead of trading on hope the moment the shape looks close enough.
Entry, Stop Loss and Take Profit
Before placing anything, be honest about what does a head and shoulders pattern indicate: a likely reversal, never a certainty. With that framing, the trade plan gets simple. Entry usually comes right after price closes below the neckline, or on a retest of that line from underneath, which many traders prefer for a tighter risk. The stop loss typically sits just above the right shoulder, so if price climbs back there, you are out before real damage is done. For the target, you measure the vertical distance from the head down to the neckline, then project that same distance below the breakout point. That measured move is your take profit zone. Keep reminding yourself what does a head and shoulders pattern indicate, so you treat the target as a guide, not a promise.
Confirmation Signals Before Entry
A break of the head and shoulders neckline is only the first clue, not the full green light. Jump in on the break alone and you will get faked out more often than you would like. So what separates a real break from a trap? Three things worth checking:
A decisive candle close: price should close beyond the neckline, not just poke through it with a wick.
A rise in volume: a genuine break usually comes with a jump in participation, showing real conviction.
A successful retest: price often returns to the neckline, and if the old support now acts as resistance, that is strong confirmation.
Wait for these and you filter out a lot of noise. No single signal is perfect, but together they stack the odds in your favour.
Measuring Price Targets
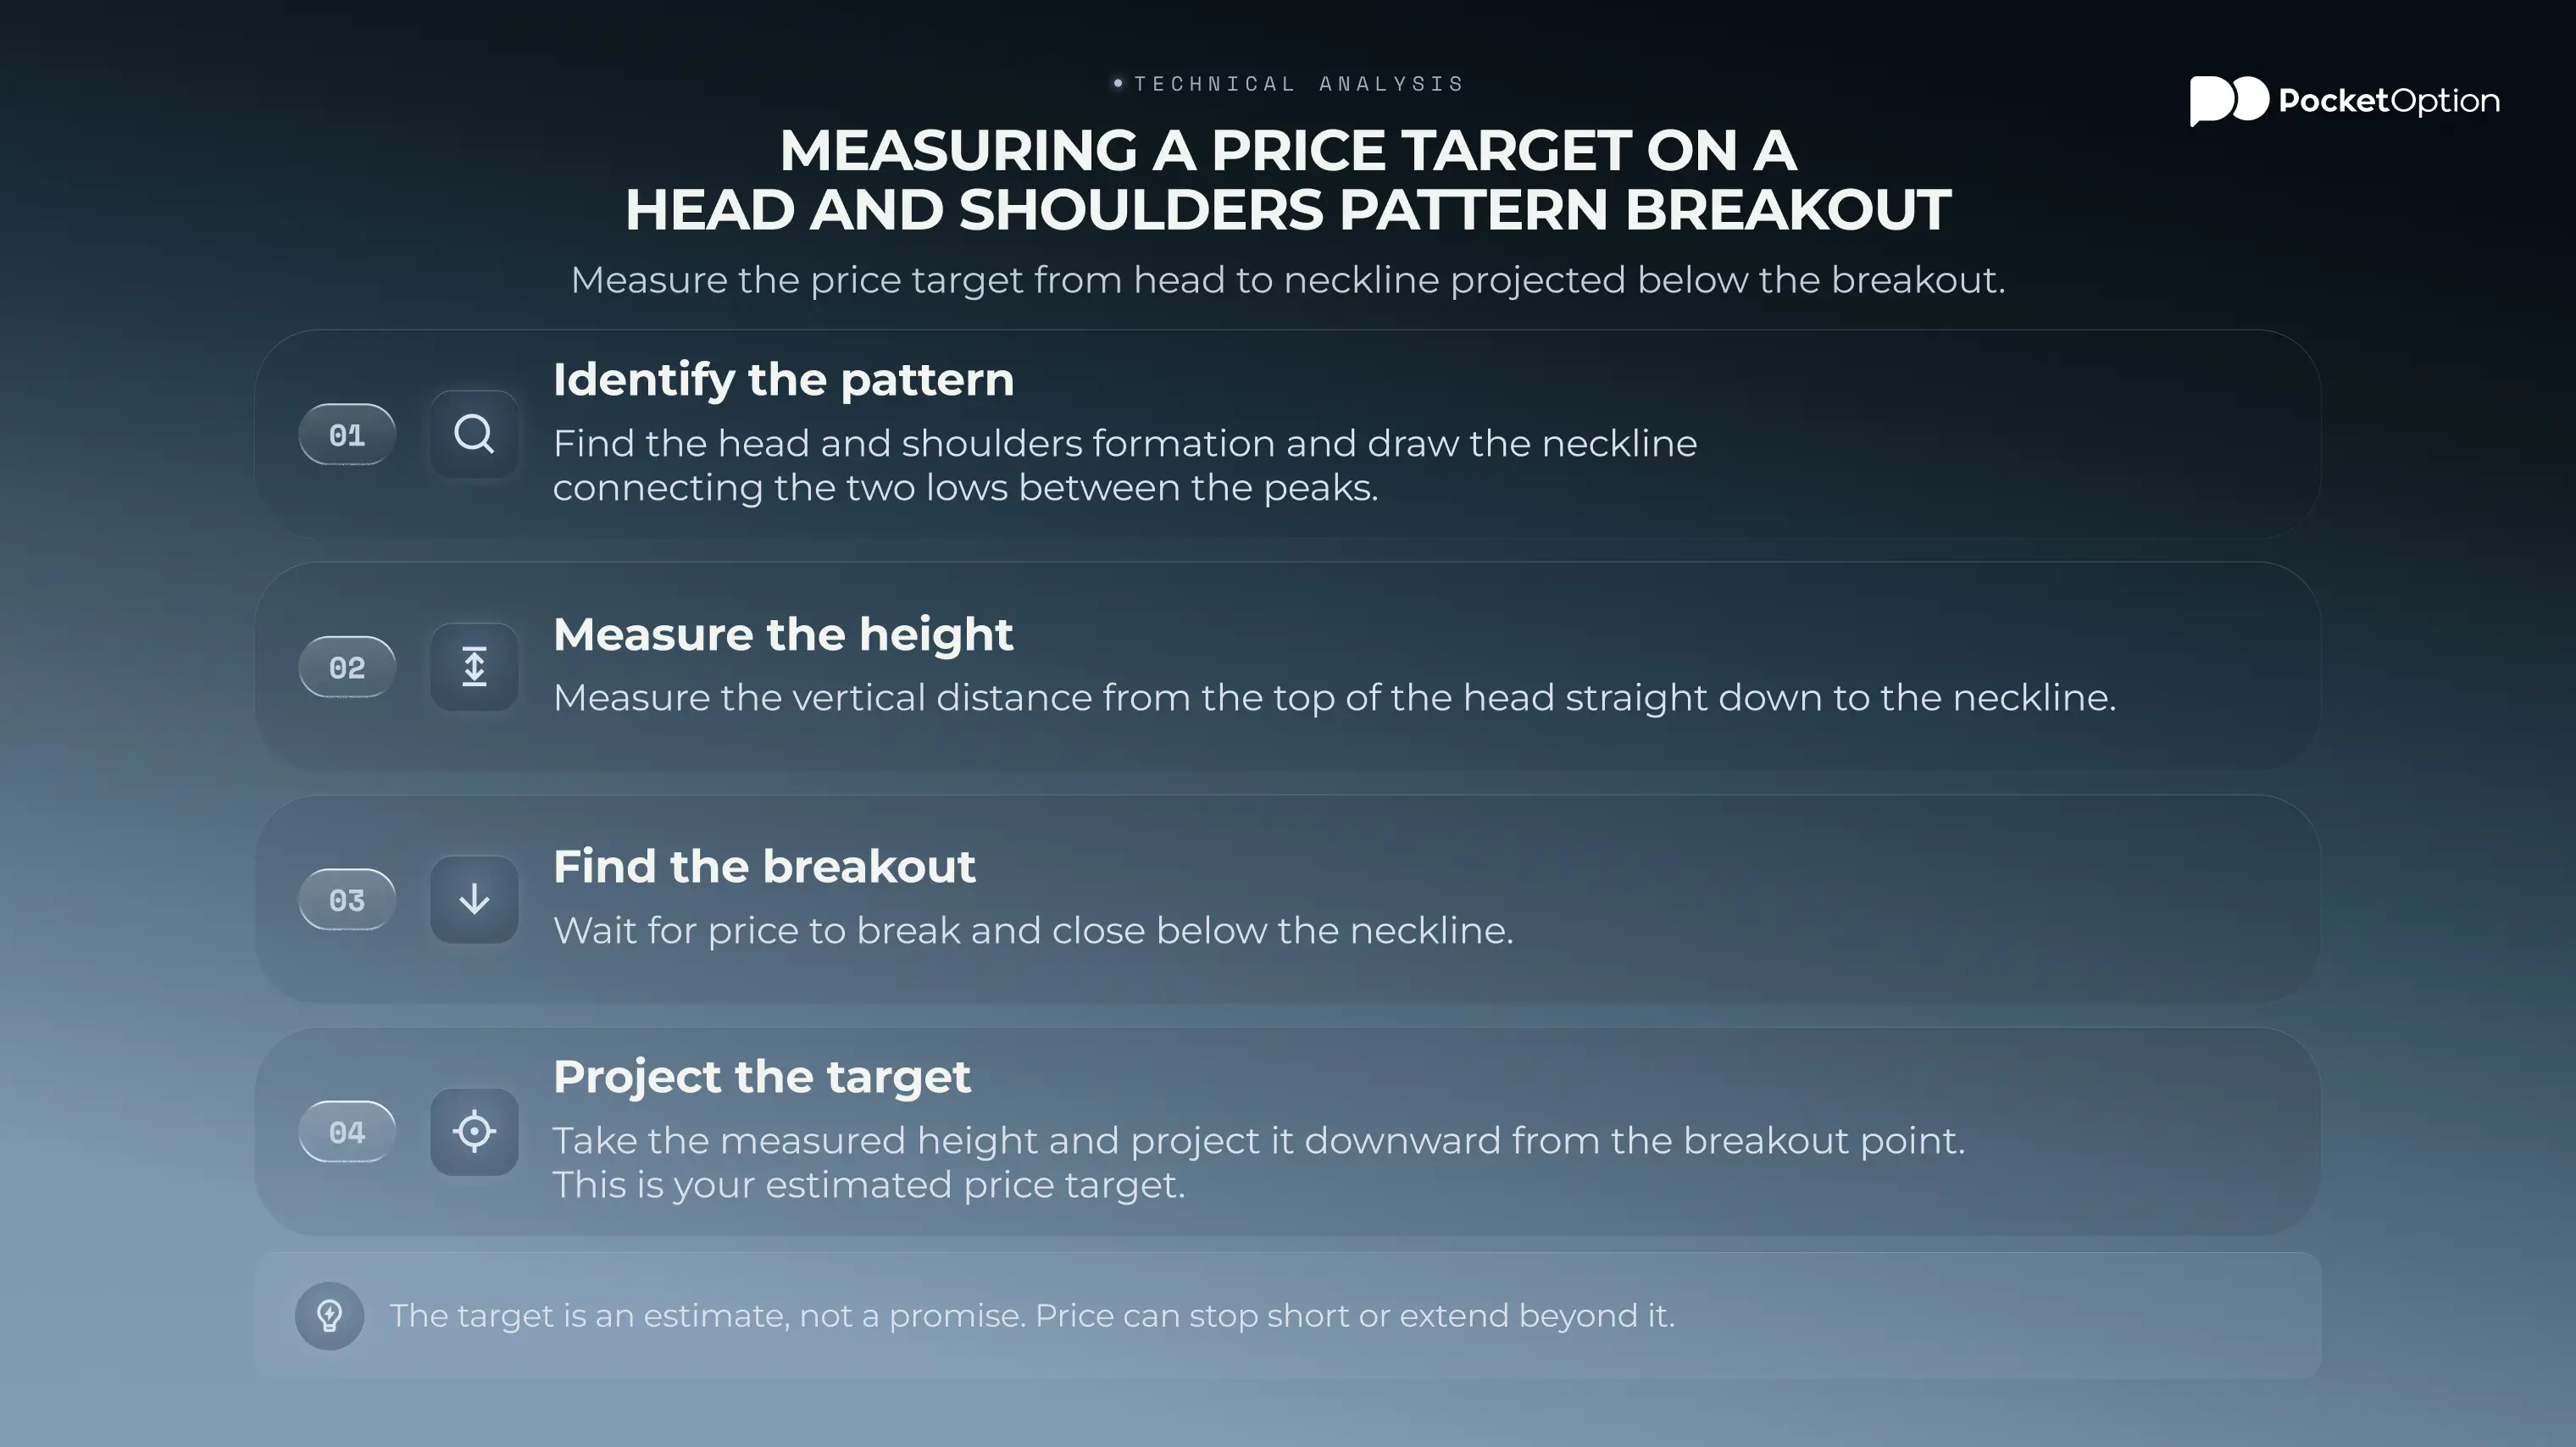
The pattern hands you its own ruler for a target, which is half the reason traders like it. The method is plain. Measure the height of the shape, straight down from the top of the head to the neckline. Take that exact distance and project it from the point where price broke the line, in the break direction. Classic top? You measure downward. What you get is a rough target for how far the move might travel. An estimate, not a promise. Price can stop short or blow past it. Even so, it beats guessing when it comes to planning an exit.
Is Head and Shoulders Bullish or Bearish?
The classic version is bearish. Full stop. It builds at the top of an uptrend and warns that the buyers behind the rally are losing their grip, so a slide lower may be next. That is why a confirmed break below the neckline reads as a sell signal. The bullish case? That belongs to the mirror image, the inverse shape, which forms at the bottom of a downtrend and hints at a move up. So the honest answer is: it depends where the shape sits. Classic at a top, bearish. Inverse at a bottom, bullish. Check the trend that came before, and the direction gives itself away.
Head and Shoulders vs Inverse Head and Shoulders
The two versions are mirror images, so learning one basically teaches you the other. The table below puts them side by side.
Feature | Classic Pattern | Inverse |
|---|---|---|
Forms after | An uptrend | A downtrend |
Shape | Three peaks, middle one highest | Three troughs, middle one lowest |
Neckline | Sits below the peaks, acts as support | Sits above the troughs, acts as resistance |
Signal | Bearish reversal on a break down | Bullish reversal on a break up |
Entry trigger | Close below the neckline | Close above the neckline |
Risk Management When Trading Head and Shoulders
No pattern wins every time, and this one is no exception. Solid risk management is what keeps a few losing trades from turning into a disaster. Keep these rules close:
Wait for confirmation: never enter before the neckline breaks and the signal is confirmed.
Always use a stop loss: place it above the right shoulder on a classic pattern, and size the trade so the loss is bearable.
Respect position sizing: risk only a small slice of your account on any single setup.
Plan for false breakouts: they happen often, so a retest and volume check are worth the extra patience.
Skip messy markets: in choppy, sideways conditions the pattern is far less reliable.
Treat the target as a guide: the measured move is an estimate, so manage the trade as it develops.
Risk Disclaimer: Trading involves significant risk of capital loss. This article is for educational purposes only and does not constitute financial advice. Always conduct independent research and consider your risk tolerance before making any trading decisions.
See more:InterestingTrading Strategies