
What Is Random Walk Theory and How Does It Describe Price Movements?
Look at a price chart long enough and shapes start appearing. Random walk theory says most of those shapes are not there. It is one of the more uncomfortable ideas in finance, and also one of the most tested.

What Is Random Walk Theory?
Random walk theory holds that price changes are essentially random and mostly independent of whatever came before. The core assumption is simple: prices move when new information arrives, and new information is by definition not knowable in advance. So the next move cannot be worked out from the last one.
The idea has a long history. Louis Bachelier wrote about it in 1900, the statistician Maurice Kendall found the same pattern in commodity and share prices in 1953, and Burton Malkiel put it in front of a general readership with A Random Walk Down Wall Street in 1973. The random walk hypothesis is the same claim stated as something testable rather than as a philosophy.
How Random Walk Theory Models Price Movements
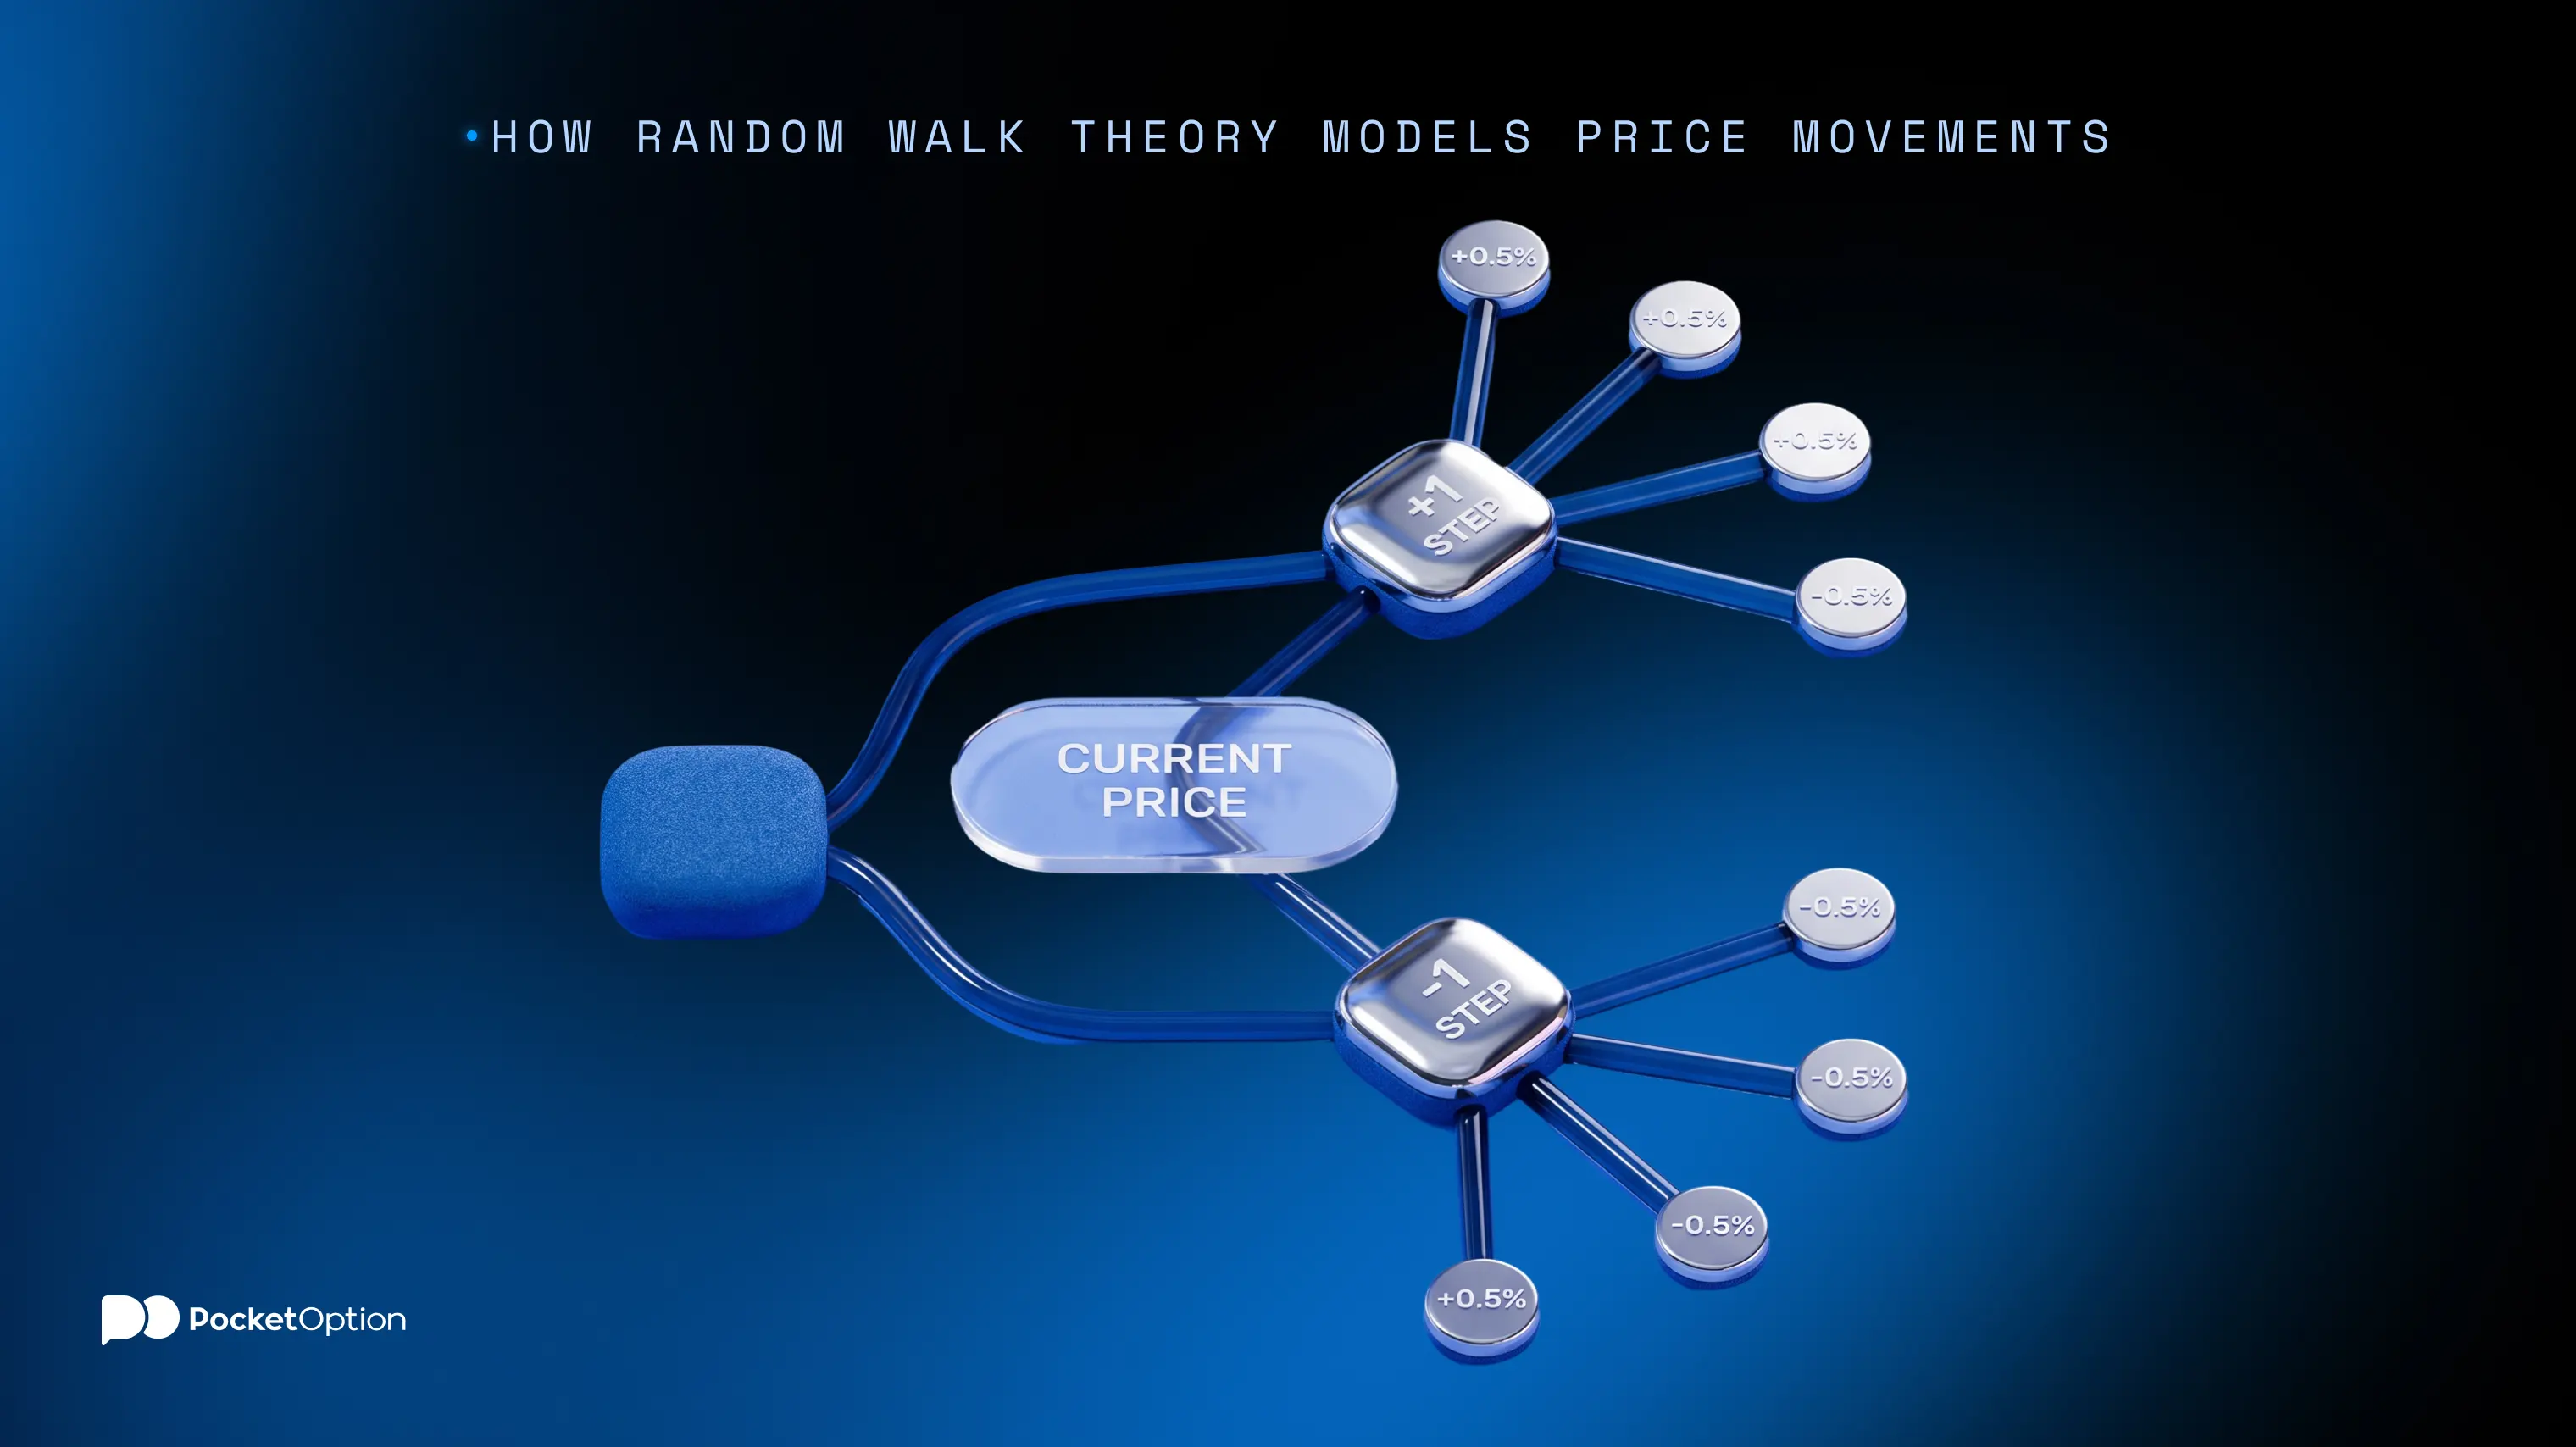
The model is almost embarrassingly small. Tomorrow's price is today's price plus a random shock. That shock has no memory of yesterday's shock, and its average is roughly zero, maybe with a slight upward drift for equities over long stretches.
That independence of price movements is the load-bearing part. If shocks were linked, a rise today would tilt the odds of a rise tomorrow, and you could trade on it. Under this model no such tilt exists, so unpredictable price changes are the normal state of a working market rather than a sign that something is broken. A chart of a genuine random walk looks remarkably like a real one, trends and reversals included, which is exactly the problem.
Link to Market Efficiency and Information
The efficient market hypothesis and the random walk hypothesis are close relatives, though not identical twins. Efficiency says prices already reflect the information available. Randomness follows from that: if everything known is priced in, only the unknown can move prices, and the unknown arrives at unpredictable times.
Eugene Fama sorted efficiency into three strengths in the 1970s. Weak form, where past prices carry no useful signal. Semi-strong, where public information is priced in too. Strong form, where even private information is. Most evidence sits somewhere between the first two. This is also why fundamental stock analysis and chart reading get judged by different standards under the theory: one is trying to price information, the other is trying to price history.
Implications for Technical Analysis and Forecasting
If prices really do wander, then past patterns say little about the future, and technical analysis limitations become the practical consequence. A few things follow from that.
Patterns can be real in hindsight and useless going forward. People are very good at spotting shapes in noise, and a random series produces plenty of shapes.
Backtested rules face a data-mining problem. Test enough rules on the same history and some will look excellent by luck alone.
Costs matter more than they look. A strategy with a small edge on paper can lose money once spreads, fees and slippage are included.
Forecast accuracy is hard to judge on a short sample. A few dozen trades cannot separate skill from a good run.
None of this proves chart work is worthless, and the theory does not claim to. It claims the burden of proof sits with the pattern, not against it. If you want to see how practitioners actually frame this, these notes on chart patterns in technical analysis set out the case from the other side.
What Random Walk Theory Means for Investors
The passive vs active investing argument leans heavily on this material. If consistent outperformance is difficult and expensive to attempt, then holding a broad, low-cost basket and leaving it alone starts to look sensible rather than lazy. That is roughly the case for index investing in one sentence.
For anyone trading actively, the theory reads more like a warning label than a prohibition. It suggests keeping expectations modest, watching costs closely, and treating a winning streak as weak evidence. A structured approach to technical analysis for day trading is not incompatible with any of this, so long as the results are measured honestly over a long enough run.
Criticisms and Alternative Views
Plenty of people disagree, and some of them have the data to argue with. Andrew Lo and Craig MacKinlay published A Non-Random Walk Down Wall Street in 1999, arguing that returns show statistically detectable structure. Momentum and value effects have been documented across many markets and decades, which is awkward for a strict reading of randomness.
Behavioural finance adds another objection. If investors act on fear, herding and overconfidence, prices should sometimes drift away from information rather than track it. Sanford Grossman and Joseph Stiglitz made a related point in 1980: if prices were perfectly efficient, nobody would be paid to gather information, and then prices could not stay efficient. Most working views land somewhere in the middle. Markets are hard to beat, not impossible, and the difficulty is the useful part of the lesson.
Long runs beat lucky streaks.
Open Demo AccountConclusion
The most useful thing random walk theory gives you is not a conclusion about markets. It is a null hypothesis. Before believing that a pattern, indicator or streak means something, ask what a purely random series would have produced over the same stretch. Quite often the answer is: something that looks a lot like this. Anything that survives that question is worth more attention than anything that has not been asked it.
Disclaimer: This article is for informational purposes only and does not constitute financial advice. Trading involves risk, and losses can exceed initial deposits.
See more:Glossary