What Is Order Book Depth and How Does Depth Show Liquidity?
Price tells you where the last trade happened. Depth tells you how much can happen next before the price has to move. Two different questions, and only one of them shows up on a candle chart.

What Is Order Book Depth?
The order book depth definition is fairly plain. It is how much size is resting in the book at each price, waiting to be traded against.
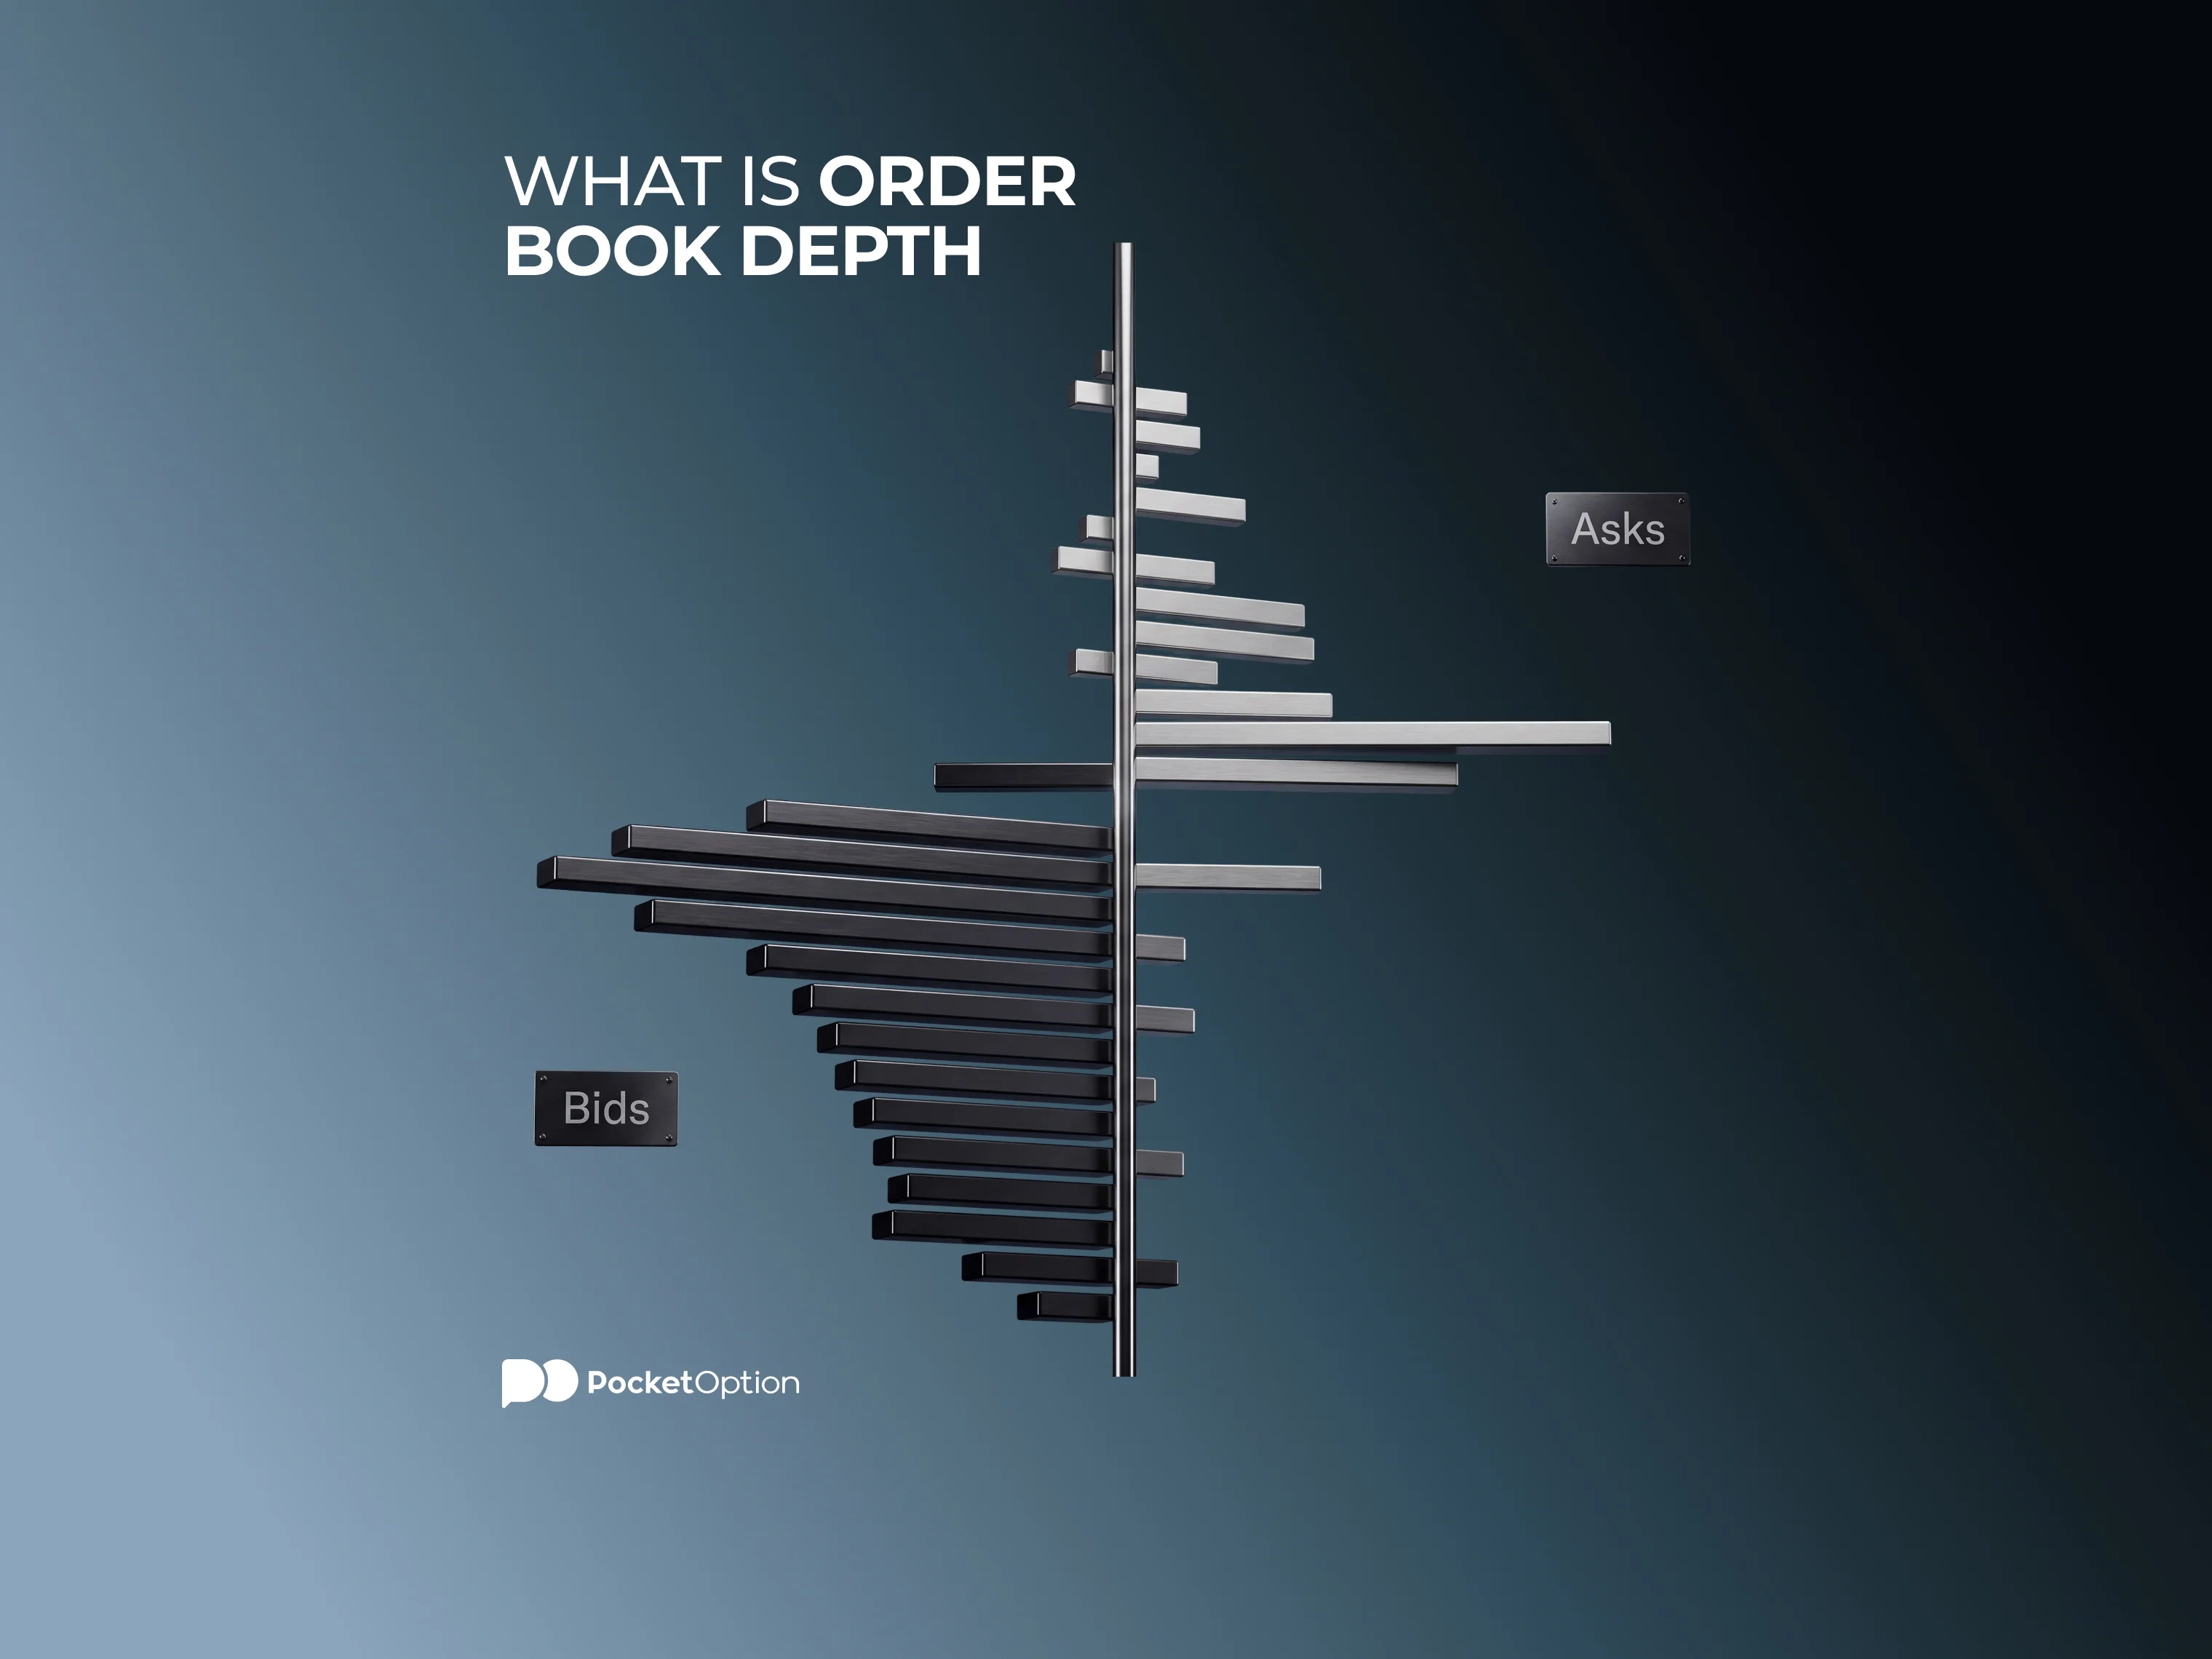
An order book is a list of unfilled limit orders. Buyers on one side, sellers on the other, sorted by price. Depth is the quantity sat at those prices. A thick book has size stacked across many levels. A thin one has a few small orders and a lot of empty space between them.
Market depth explained in a sentence: it measures how much the market can absorb before price has to move to find the next willing counterparty.
How the Order Book Shows Bids and Asks
Two sides, always.
Bids. What buyers are offering to pay, listed highest first.
Asks. What sellers are willing to accept, listed lowest first.
The gap between the best of each is the bid-ask spread.
Bids and asks never overlap. The moment they would, a trade happens and both orders come off the book. So what you are looking at is always a picture of what has not traded yet, which is a subtler object than it first appears.
Buy and sell orders sitting on the book are limit orders. Market orders never appear there at all, they arrive and immediately consume whatever is resting. Reading Level 2 takes some practice, and hidden liquidity and the ways Level 2 can mislead is worth going through before leaning on it too heavily.
Depth at Different Price Levels
Depth at one price and depth across the whole book are separate measurements, and confusing them leads to bad sizing decisions.
Price | Bid size | Ask size |
|---|---|---|
101.03 | 900 | |
101.02 | 400 | |
101.01 | 200 | |
100.99 | 300 | |
100.98 | 500 | |
100.97 | 1,200 |
At the top of the book there are 200 units offered at 101.01. That is depth at a level. Add the three ask levels together and 1,500 units are available up to 101.03, which is aggregate depth, and it is the figure that matters whenever an order is larger than the top level.
Buy 200 and you pay 101.01 for all of it. Buy 800 and you take the 200 at 101.01, then the 400 at 101.02, then 200 of the 900 sitting at 101.03. Average fill ends up above the price that was on screen when you clicked. Same order, different outcome, purely because of how the size happened to be spread out.
How Depth Shows Market Liquidity
Liquidity in trading is the ability to transact size without shifting the price much, and depth is the most direct view of it anyone gets.
A tight bid-ask spread with real size behind it usually means a liquid market.
A tight spread with almost nothing behind it is thinner than it looks, and it looks fine right up until an order goes in.
Depth that is roughly balanced on both sides absorbs flow in either direction.
Large clustered orders at a single price get called buy or sell walls. Sometimes that is real interest. Sometimes it vanishes the instant price comes near.
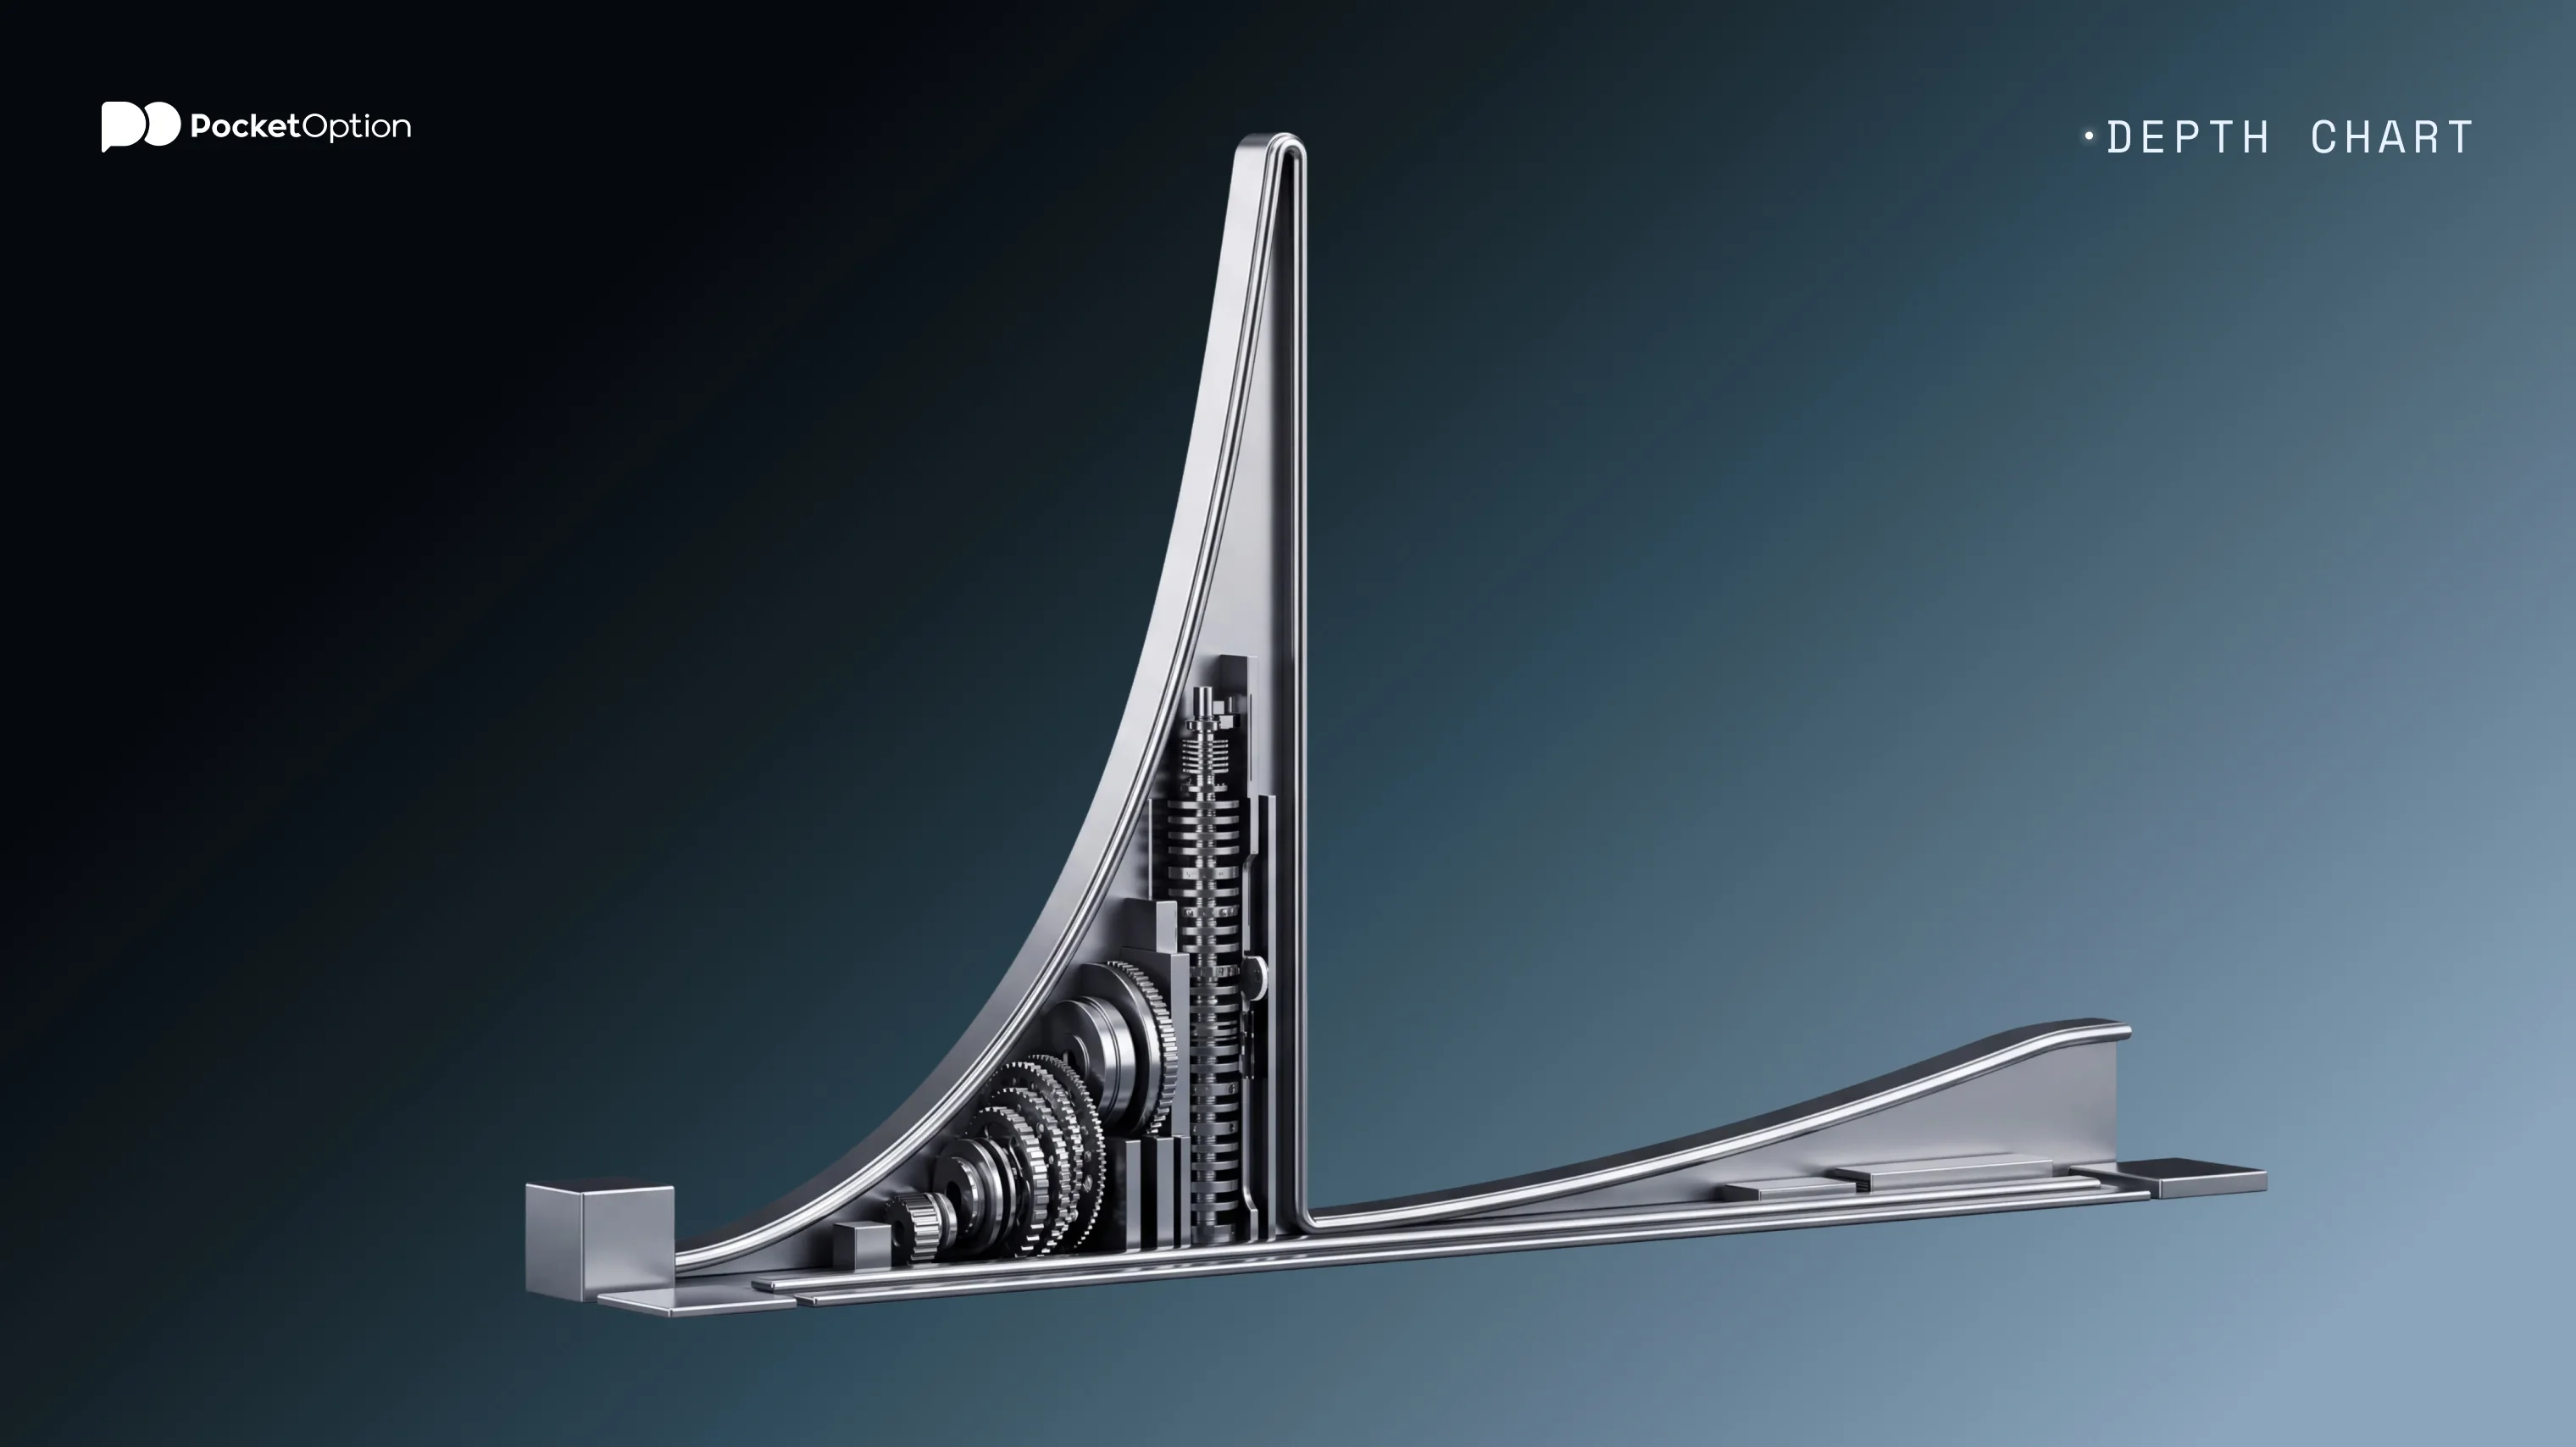
A depth chart plots the same data as a cumulative curve, one line climbing away on each side of the mid price. Steep curve, size arrives quickly as you move away from the mid. Flat curve, very little is there. The shape reads faster than the numbers do. Methods for checking how liquid an instrument really is tend to pair this with volume over longer windows, since a snapshot is only ever a snapshot.
Visible depth is not the same as total liquidity, though, and that is the part worth holding onto:
Iceberg and hidden orders show a fraction of their true size, or none of it.
Orders are cancelled and replaced constantly, so the book you looked at has already gone.
Liquidity is fragmented across venues and the book in front of you may be one of several.
Market makers can withdraw entirely, and they tend to do it exactly when volatility shows up.
Order Book Depth and Slippage
Slippage is the difference between the price expected and the price received. Thin depth is the usual reason for it.
The mechanism is the one from the example above. An order bigger than the top level walks up or down the book, filling at progressively worse prices, and the average lands away from where it started. Deeper books mean fewer levels get consumed, so less drift. Thin books mean the same order clears several levels and the drift is larger.
Conditions make it worse rather than better:
Volatility, which widens spreads and pulls size off the book at the same time.
News releases and market opens, where depth can disappear for a few seconds.
Low volume hours, overnight and across weekends.
Instruments that were thinly traded to begin with.
Splitting a large order into pieces is the standard response, and order flow tools such as heat maps and volume profile exist largely to make the distribution of resting size legible before anybody commits to a size.
Practice reading flow at no cost.
Open Demo AccountConclusion
Go back to the 800 unit order that filled across three levels. Nothing about that outcome appeared on the price chart, before or afterwards. It was sitting in the book in plain numbers and took about two seconds to read. Order book depth does not tell you where price is heading. It tells you what your own order is about to do to it.
Disclaimer: Trading involves significant risk of capital loss and may not be suitable for all investors. Displayed market data can change rapidly and may not reflect all available liquidity.
See more:Glossary