What Does Retracement Mean and How Do Retracements Work in Price Action?
You're watching a strong uptrend, then the price suddenly drops. Do you buy the dip, or is the trend over? It depends on whether this is a retracement or a reversal: get it wrong and the market turns against you; get it right and you enter at a better price. This guide covers what a retracement means, why it happens, and how traders use Fibonacci levels to find entries.

What Does Retracement Mean
A retracement is a short-term dip against a larger trend before price resumes its direction.
As long as the trend structure holds (higher highs and lows in an uptrend, or the reverse in a downtrend), it's a retracement, not a reversal.
Example: a stock rallies from $25 to $50, then pulls back to $37.50, a 50% retracement. If the trend is intact, it should continue higher.
Retracement vs Reversal: Where Fibonacci Fits In
A retracement doesn't change the trend: price holds support or resistance. A reversal breaks key levels and starts a new trend.
Factor | Retracement | Reversal |
Duration | Short-term | Extended |
Price action | Holds support / resistance | Breaks key levels |
Outcome | Trend continues | New trend begins |
This article focuses on the Fibonacci side: how far a pullback can go before it's more than a pause. For early reversal warning signs, see Trend Reversals and How Traders Spot a Change in Direction [3.4]. For reading swings once underway, see Reversal and Pullback Trading - How to Read Swings on Charts [2.13].
Why Retracements Happen
Profit-taking after a rally causes a dip until buyers step back in; institutions also use pullbacks to accumulate positions.
The 50% rule: retracements typically stay within 38.2%-50% of the prior move. Deeper ones (61.8% or 78.6%) may signal weakness.
Fibonacci Retracement Levels Explained
The Fibonacci retracement tool is based on the Fibonacci sequence (0, 1, 1, 2, 3, 5, 8, 13...), giving key ratios including the golden ratio (1.618) and its inverse (0.618).
23.6%: shallow retracement
38.2%: moderate retracement
50%: not a true Fibonacci ratio, but widely used
61.8%: the "golden ratio", considered the most significant
78.6%: deep retracement
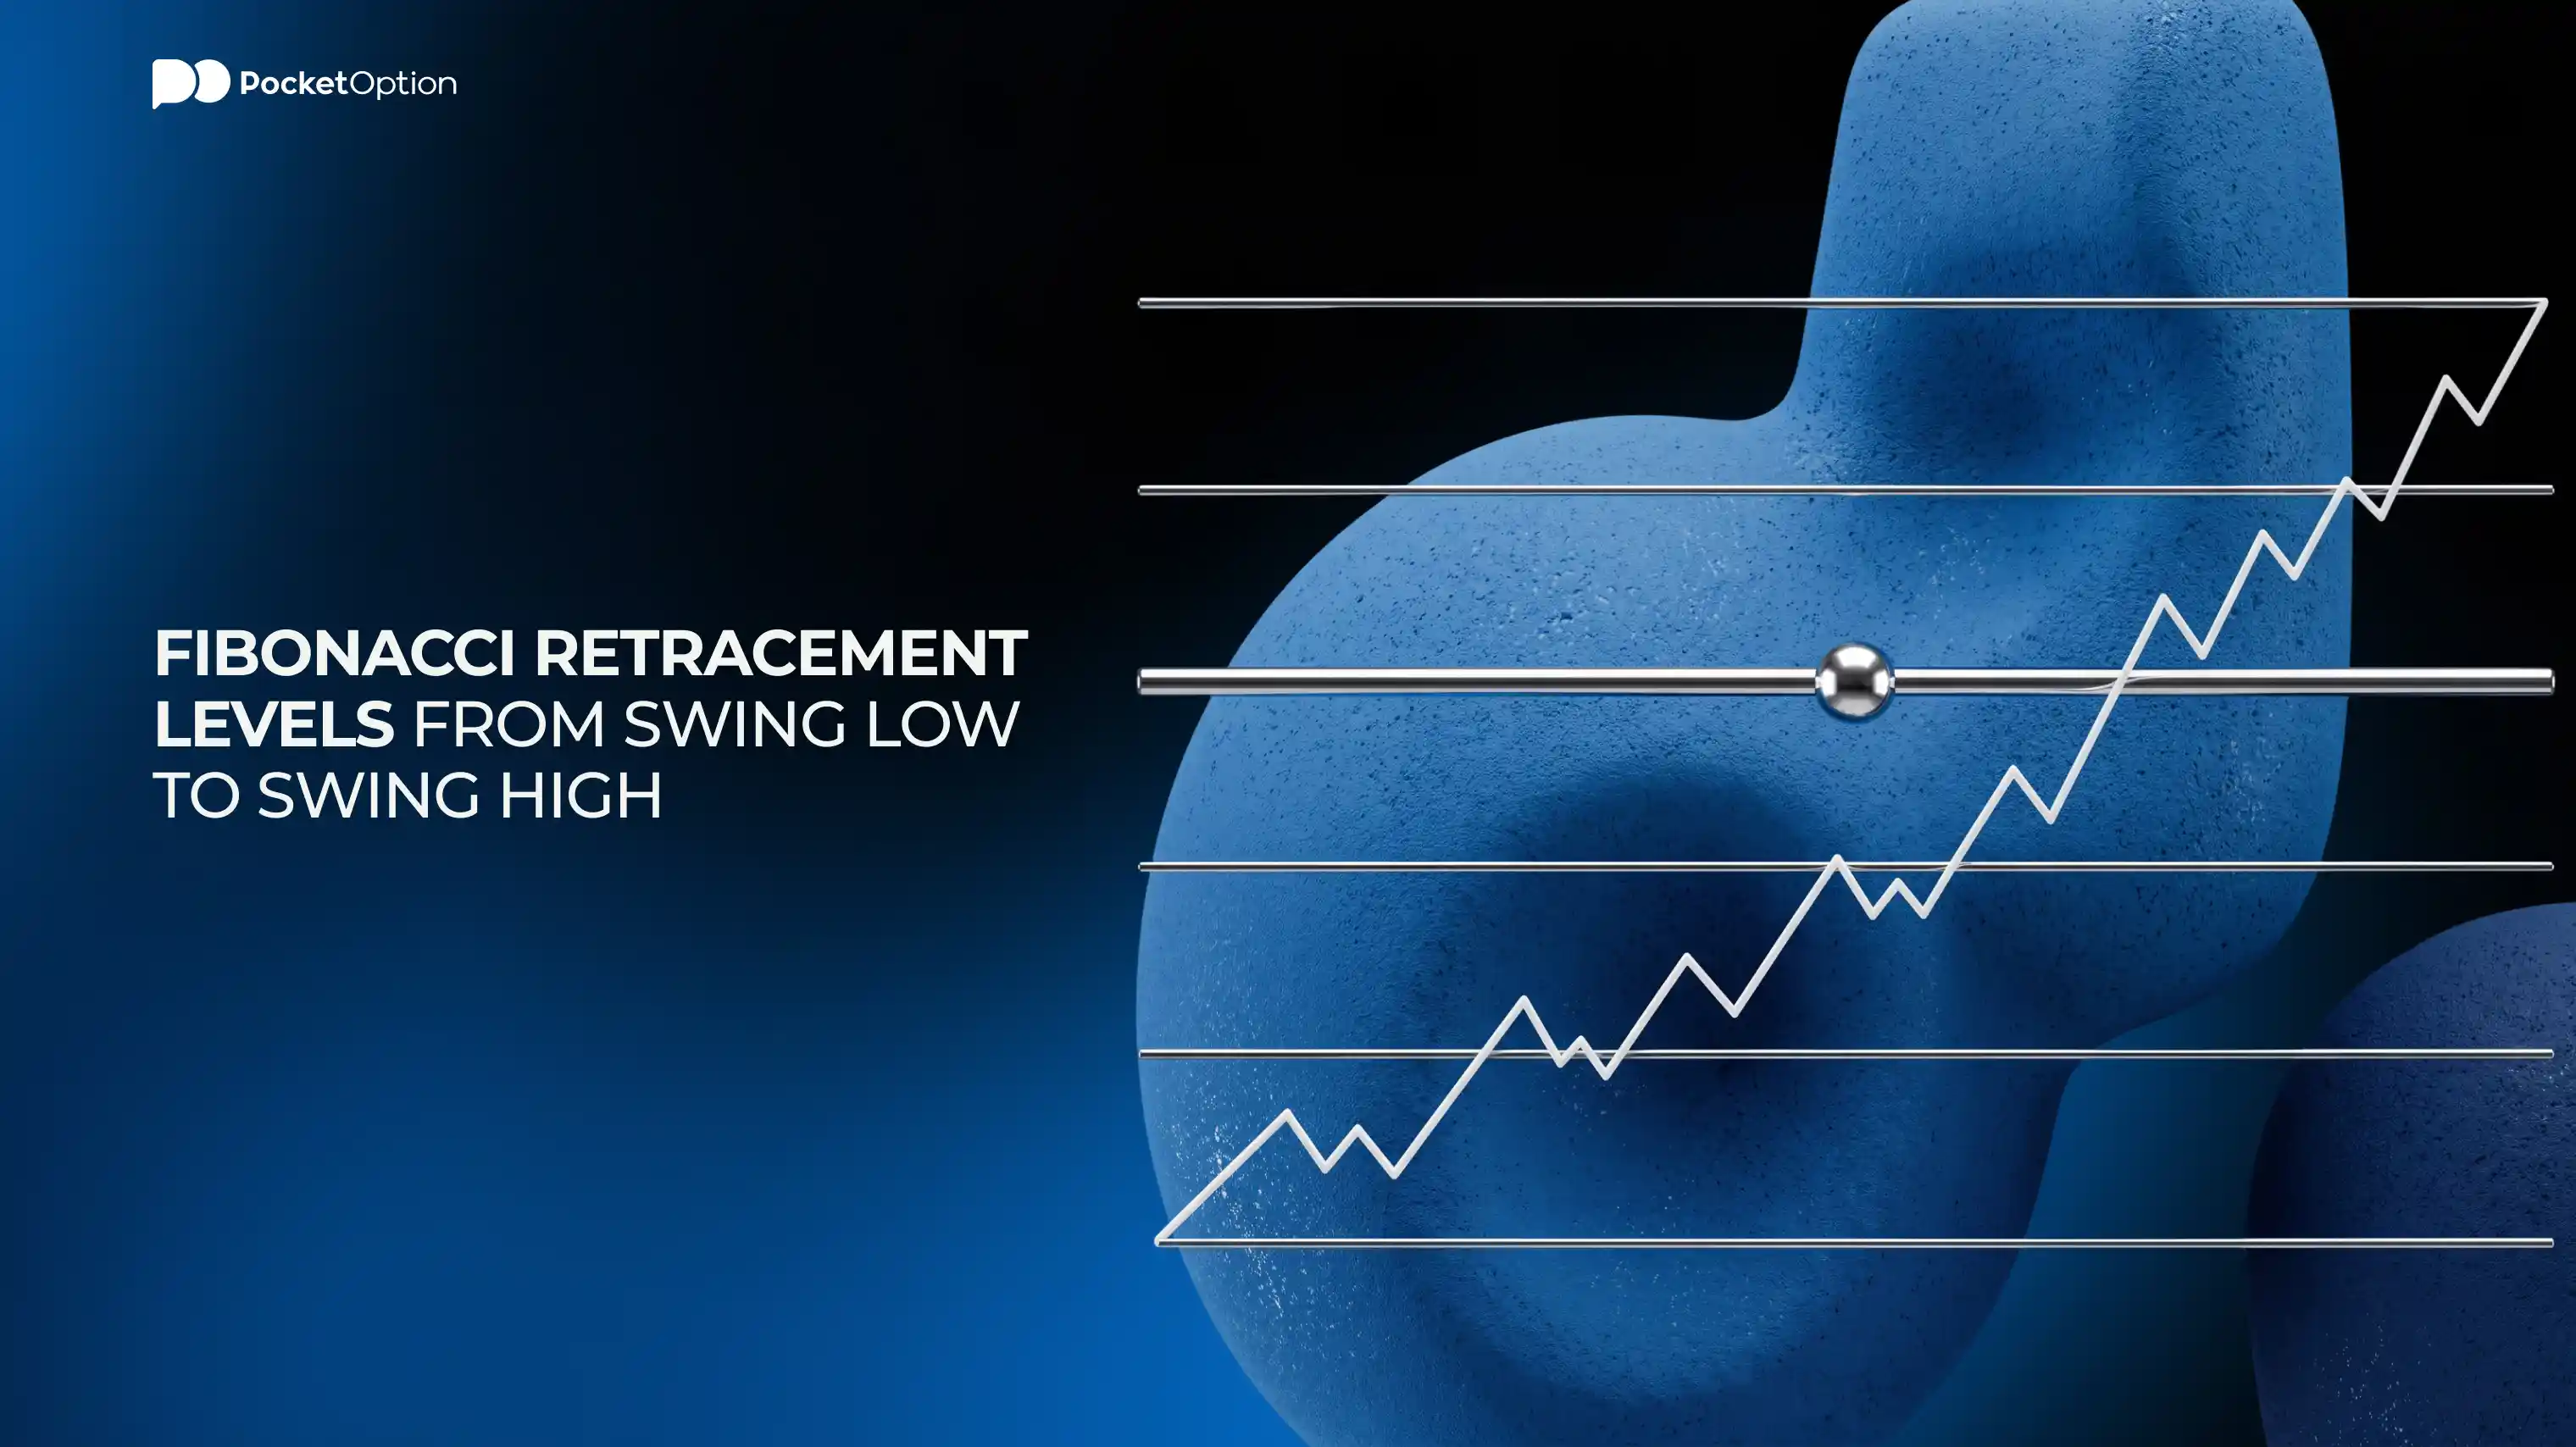
These levels plot as horizontal lines between a high and low, marking areas where price might find support or resistance before continuing.
Using Fib Levels to Plan an Entry
Step 1:Identify the trend: buy pullbacks in an uptrend, sell rallies in a downtrend.
Step 2:Mark a clear swing high and swing low.
Step 3:Apply your platform's Fibonacci tool to plot the levels.
Step 4:Watch for price to reach 38.2%, 50%, or 61.8% with a reversal candlestick pattern.
Step 5:Look for confluence with support/resistance or a trendline.
Step 6:Place your stop beyond the next level, with a small buffer.
Other Ways Traders Spot Retracements
The 50% level, though not a true Fibonacci ratio, is widely watched as a support/resistance zone. Moving averages (50-day or 200-day) strengthen a zone when combined with Fibonacci.
Applying Retracement Analysis on Pocket Option Charts
Practice retracement trading risk-free. On Pocket Option, draw Fibonacci retracements on any chart, identify swings across timeframes, and track results on a demo account.
Practise Fibonacci Retracement Trading on a Demo Account
Learn to draw Fib levels, spot high-probability entries, and test retracement strategies without risking real money.
CTA Block
Title: Practise Fibonacci Retracement Trading on a Demo Account
Banner format: Learn to draw Fib levels, spot high-probability pullback entries, and test retracement strategies on real charts, without risking real money.
Button text: Open Demo Account
Link to:https://pocketoption.com/en/register/
Conclusion
A retracement is a temporary pullback, not a reversal, and confusing the two can be costly. Fibonacci levels, especially 38.2%, 50%, and 61.8%, are the primary tool for measuring retracements, but work best with confluence and disciplined stops.
Risk Disclaimer: Trading involves significant risk of capital loss. This article is for educational purposes only and does not constitute financial advice. Always research independently and consider your risk tolerance before trading.
See more:Glossary