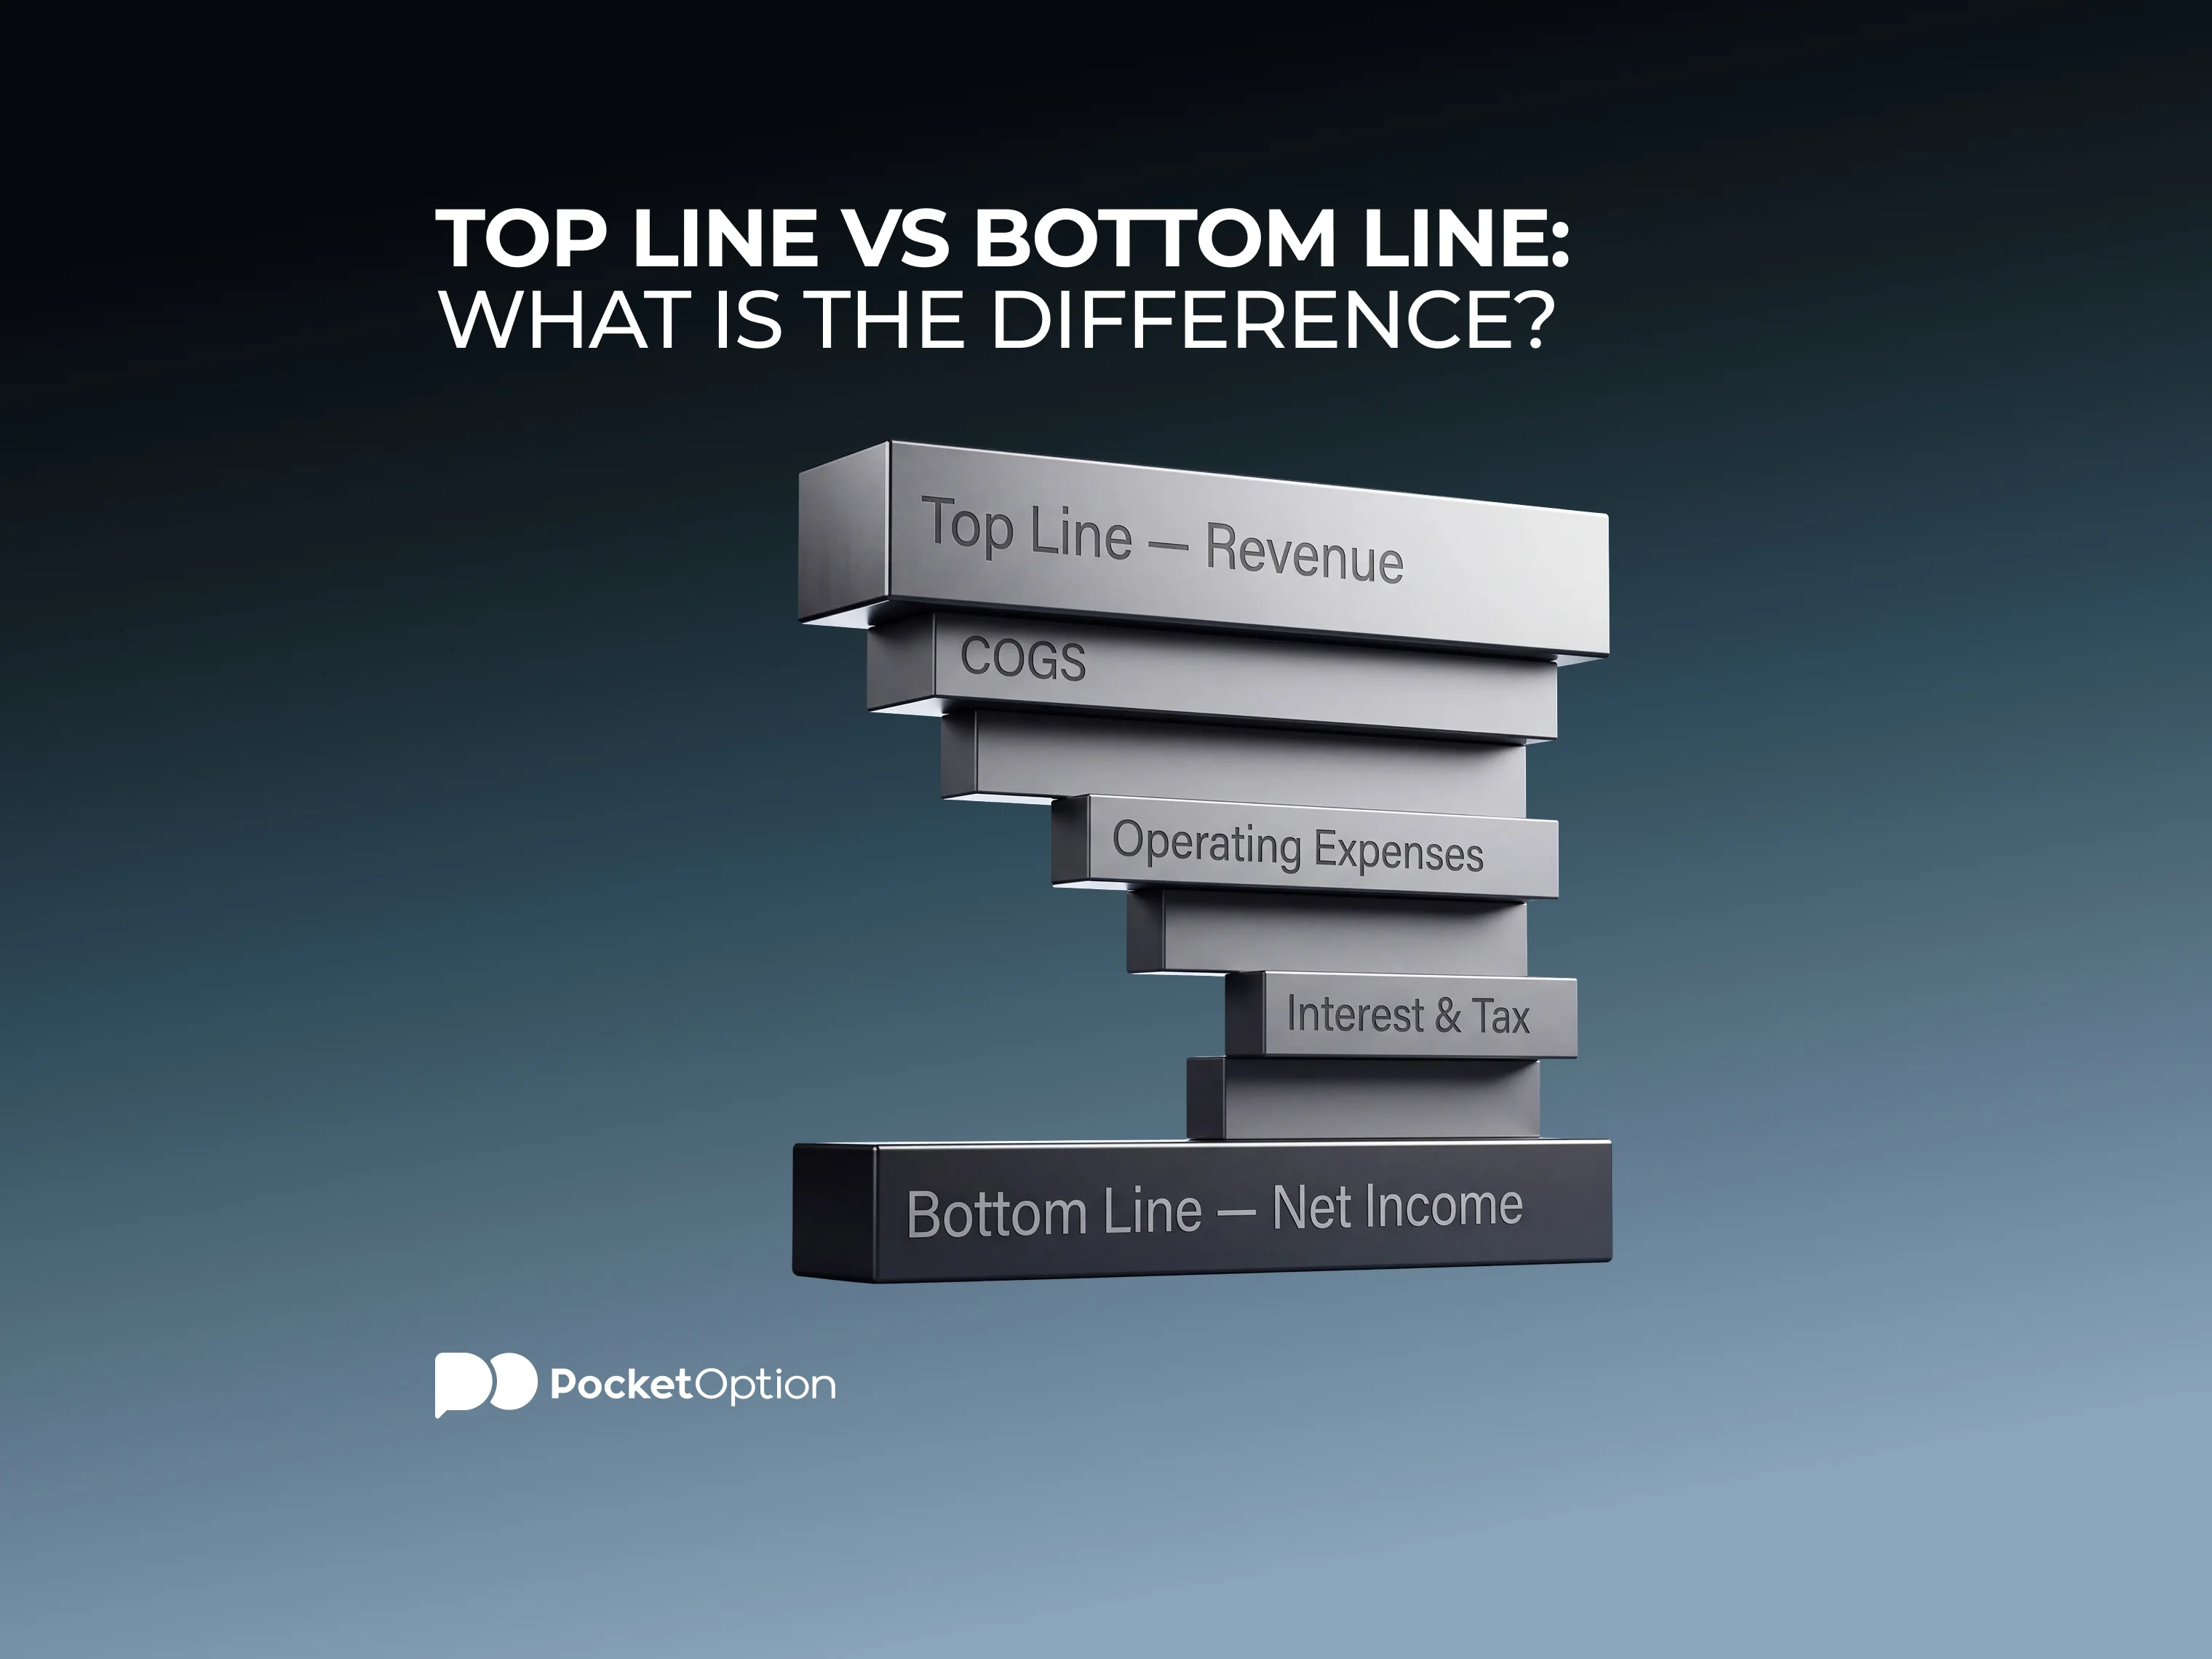
Top Line vs Bottom Line: What Is the Difference?
A company's top and bottom lines sit at opposite ends of the same income statement. One shows how much money came in. The other shows what is left once every cost has been paid. A company can grow one while the other shrinks, and knowing which number is moving, and why, matters more than either figure alone.

What Is Top Line: Definition
Top line refers to a company's total revenue for a given period, the figure printed on the very first line of the income statement before any cost is subtracted. It reflects sales volume and pricing, nothing else. A rising top line means the company is selling more, charging more, or both, but it says nothing yet about whether that activity is profitable once a company's financial statements account for the cost of producing and delivering it.
What Is Bottom Line: Definition
Bottom line refers to net income, the figure left on the final line of the income statement after every expense, tax, and interest payment has been deducted from revenue. The bottom line meaning that matters most to investors is simple: how much profit is actually left for shareholders once every obligation has been paid. Where top line answers how much a company sold, bottom line answers how much of that selling it actually kept.
How to Calculate Top Line and Bottom Line
Top line is the simpler of the two: total units sold multiplied by price, summed across every product line, with no deductions. Bottom line requires working down the full income statement, subtracting the cost of goods sold, operating expenses such as salaries and rent, interest on debt, and tax, in that order. Two companies can post the same top line and land on very different bottom lines once their cost structures and profit margins diverge.
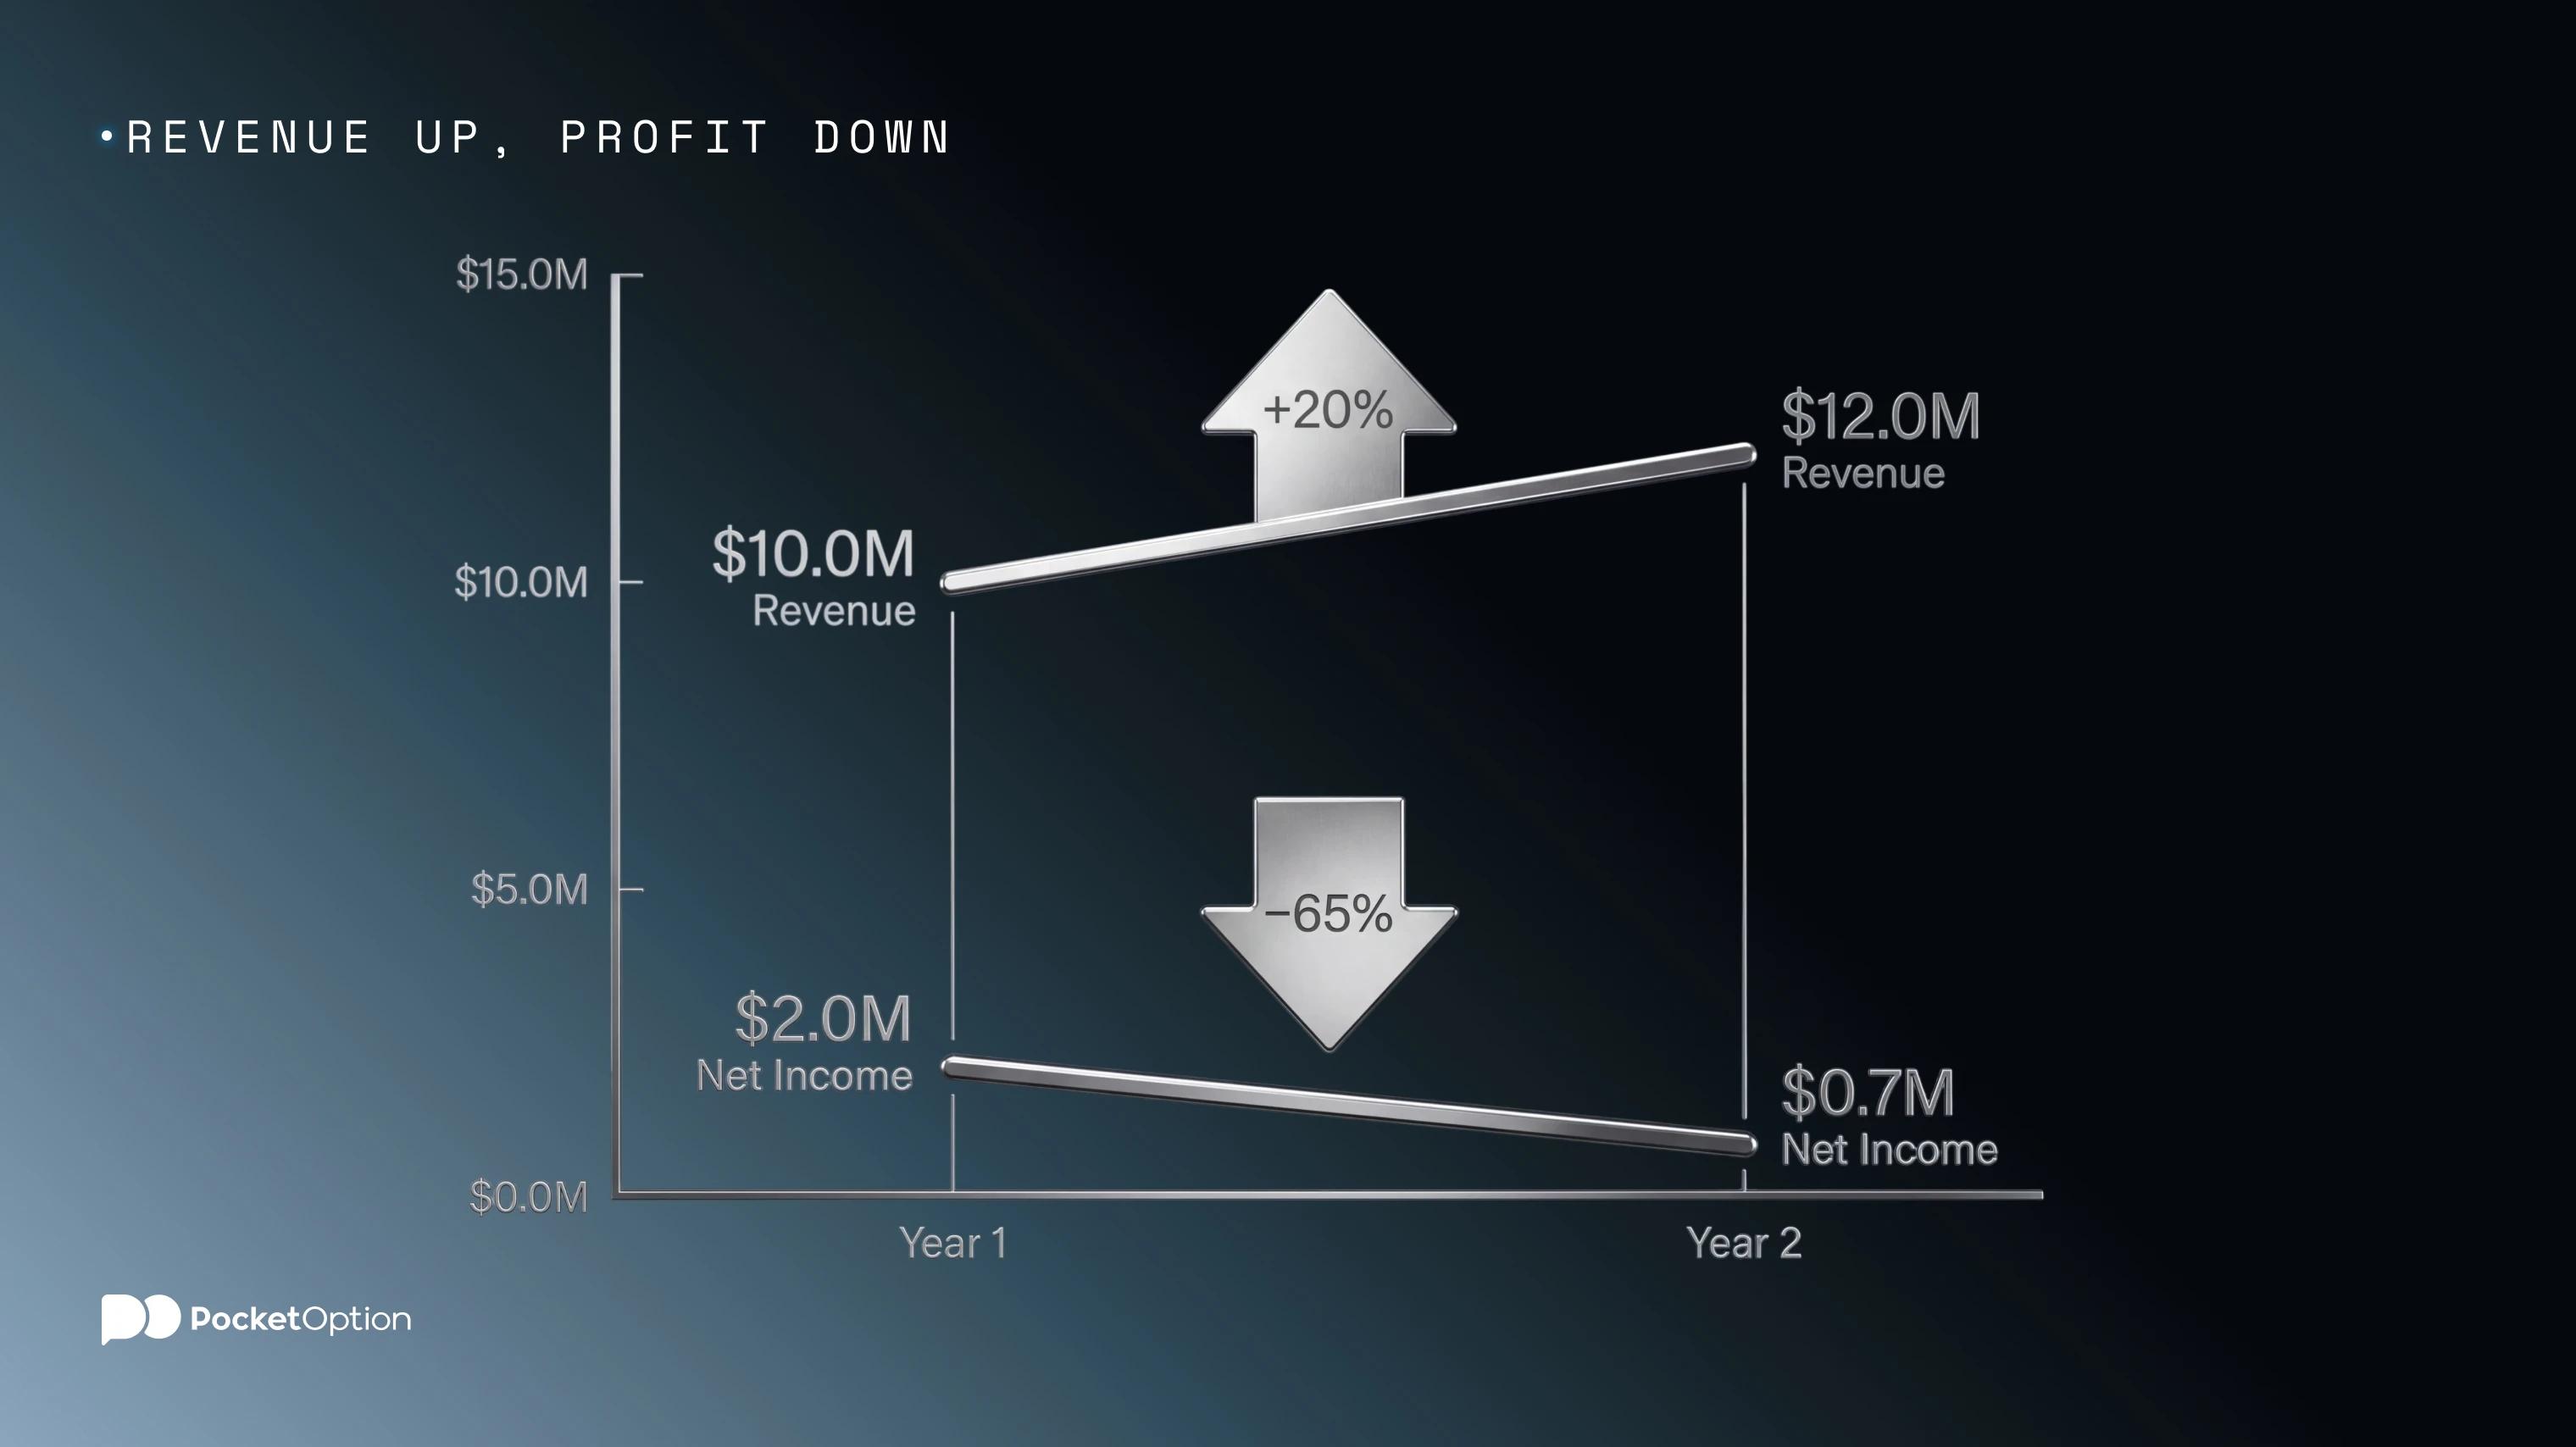
A Worked Example: Revenue Up, Profit Down
Line item | Year 1 | Year 2 |
|---|---|---|
Revenue (top line) | $10.0M | $12.0M |
Cost of goods sold | $4.0M | $5.5M |
Operating expenses | $3.0M | $4.2M |
Interest and tax | $1.0M | $1.6M |
Net income (bottom line) | $2.0M | $0.7M |
Revenue grew by 20 percent between the two years. Net income fell by nearly two thirds over the same period, because costs, especially operating expenses and interest, grew faster than sales did. A reader who only checked the top line would have concluded the company had a strong year. Checking both numbers, using valuation ratios like EPS alongside the raw figures, tells a very different story.
Why the Two Metrics Can Move in Opposite Directions
Several forces can push top and bottom line results apart in the same reporting period:
Rising input costs or wages that outpace price increases
A one time charge, such as a write down or legal settlement
Higher interest expense following new borrowing
Heavy spending on growth, such as marketing or new hires, ahead of the revenue it is meant to produce
None of these forces are unusual on their own. Together, in the same period, they can turn a headline revenue increase into a profit decline.
Why Investors Should Check Both Before Trading a Stock
A stock price often reacts to the top line first, since revenue is reported early and is easy to compare against expectations. Bottom line takes longer to parse and is easy to overlook in a quick read of the headline numbers. Judging a company on revenue growth alone can mean buying into a business that is selling more while making less on every sale it books. Checking top line vs bottom line before trading a stock is a basic habit, not an advanced one.
Your next stock idea starts here.
Get StartedConclusion
Top line and bottom line answer two different questions. One measures how much a company sold. The other measures how much of that selling it actually kept. Reading only one of them, especially only the top line, risks missing the moment when rising sales stop translating into rising profit. The two numbers are most useful read side by side, not in isolation.
Disclaimer:Trading involves significant risk of capital loss and may not be suitable for all investors. Past performance does not guarantee future results.
See more:Glossary