What Is Risk-Reward Ratio in Trading?
Put two weights on a balance scale and the scale doesn't care what either one represents, just how they compare against each other. Risk reward ratio does something similar with money instead of weight, comparing what a trade could cost against what it could return, before either number becomes real.

Why Traders Check the Numbers Before Entering
A risk reward ratio helps evaluate a trade before entering it, not after. It weighs the amount a trader risks against the amount they stand to gain if the trade works out. None of this guarantees anything. A favorable risk reward ratio simply means the potential payoff justifies the potential cost, on paper, before the trade actually plays out.
Open a free demo account and practice setting stops and targets, using virtual funds.
Try Demo AccountCurious how this actually plays out once real numbers are attached to a live chart? Reading about the ratio in theory only goes so far. Watching an actual entry, stop, and target play out teaches the concept faster than any formula alone.
Open a demo trading account and practice setting stops and targets on real charts, with virtual funds and nothing real on the line.
The Formula in Plain English
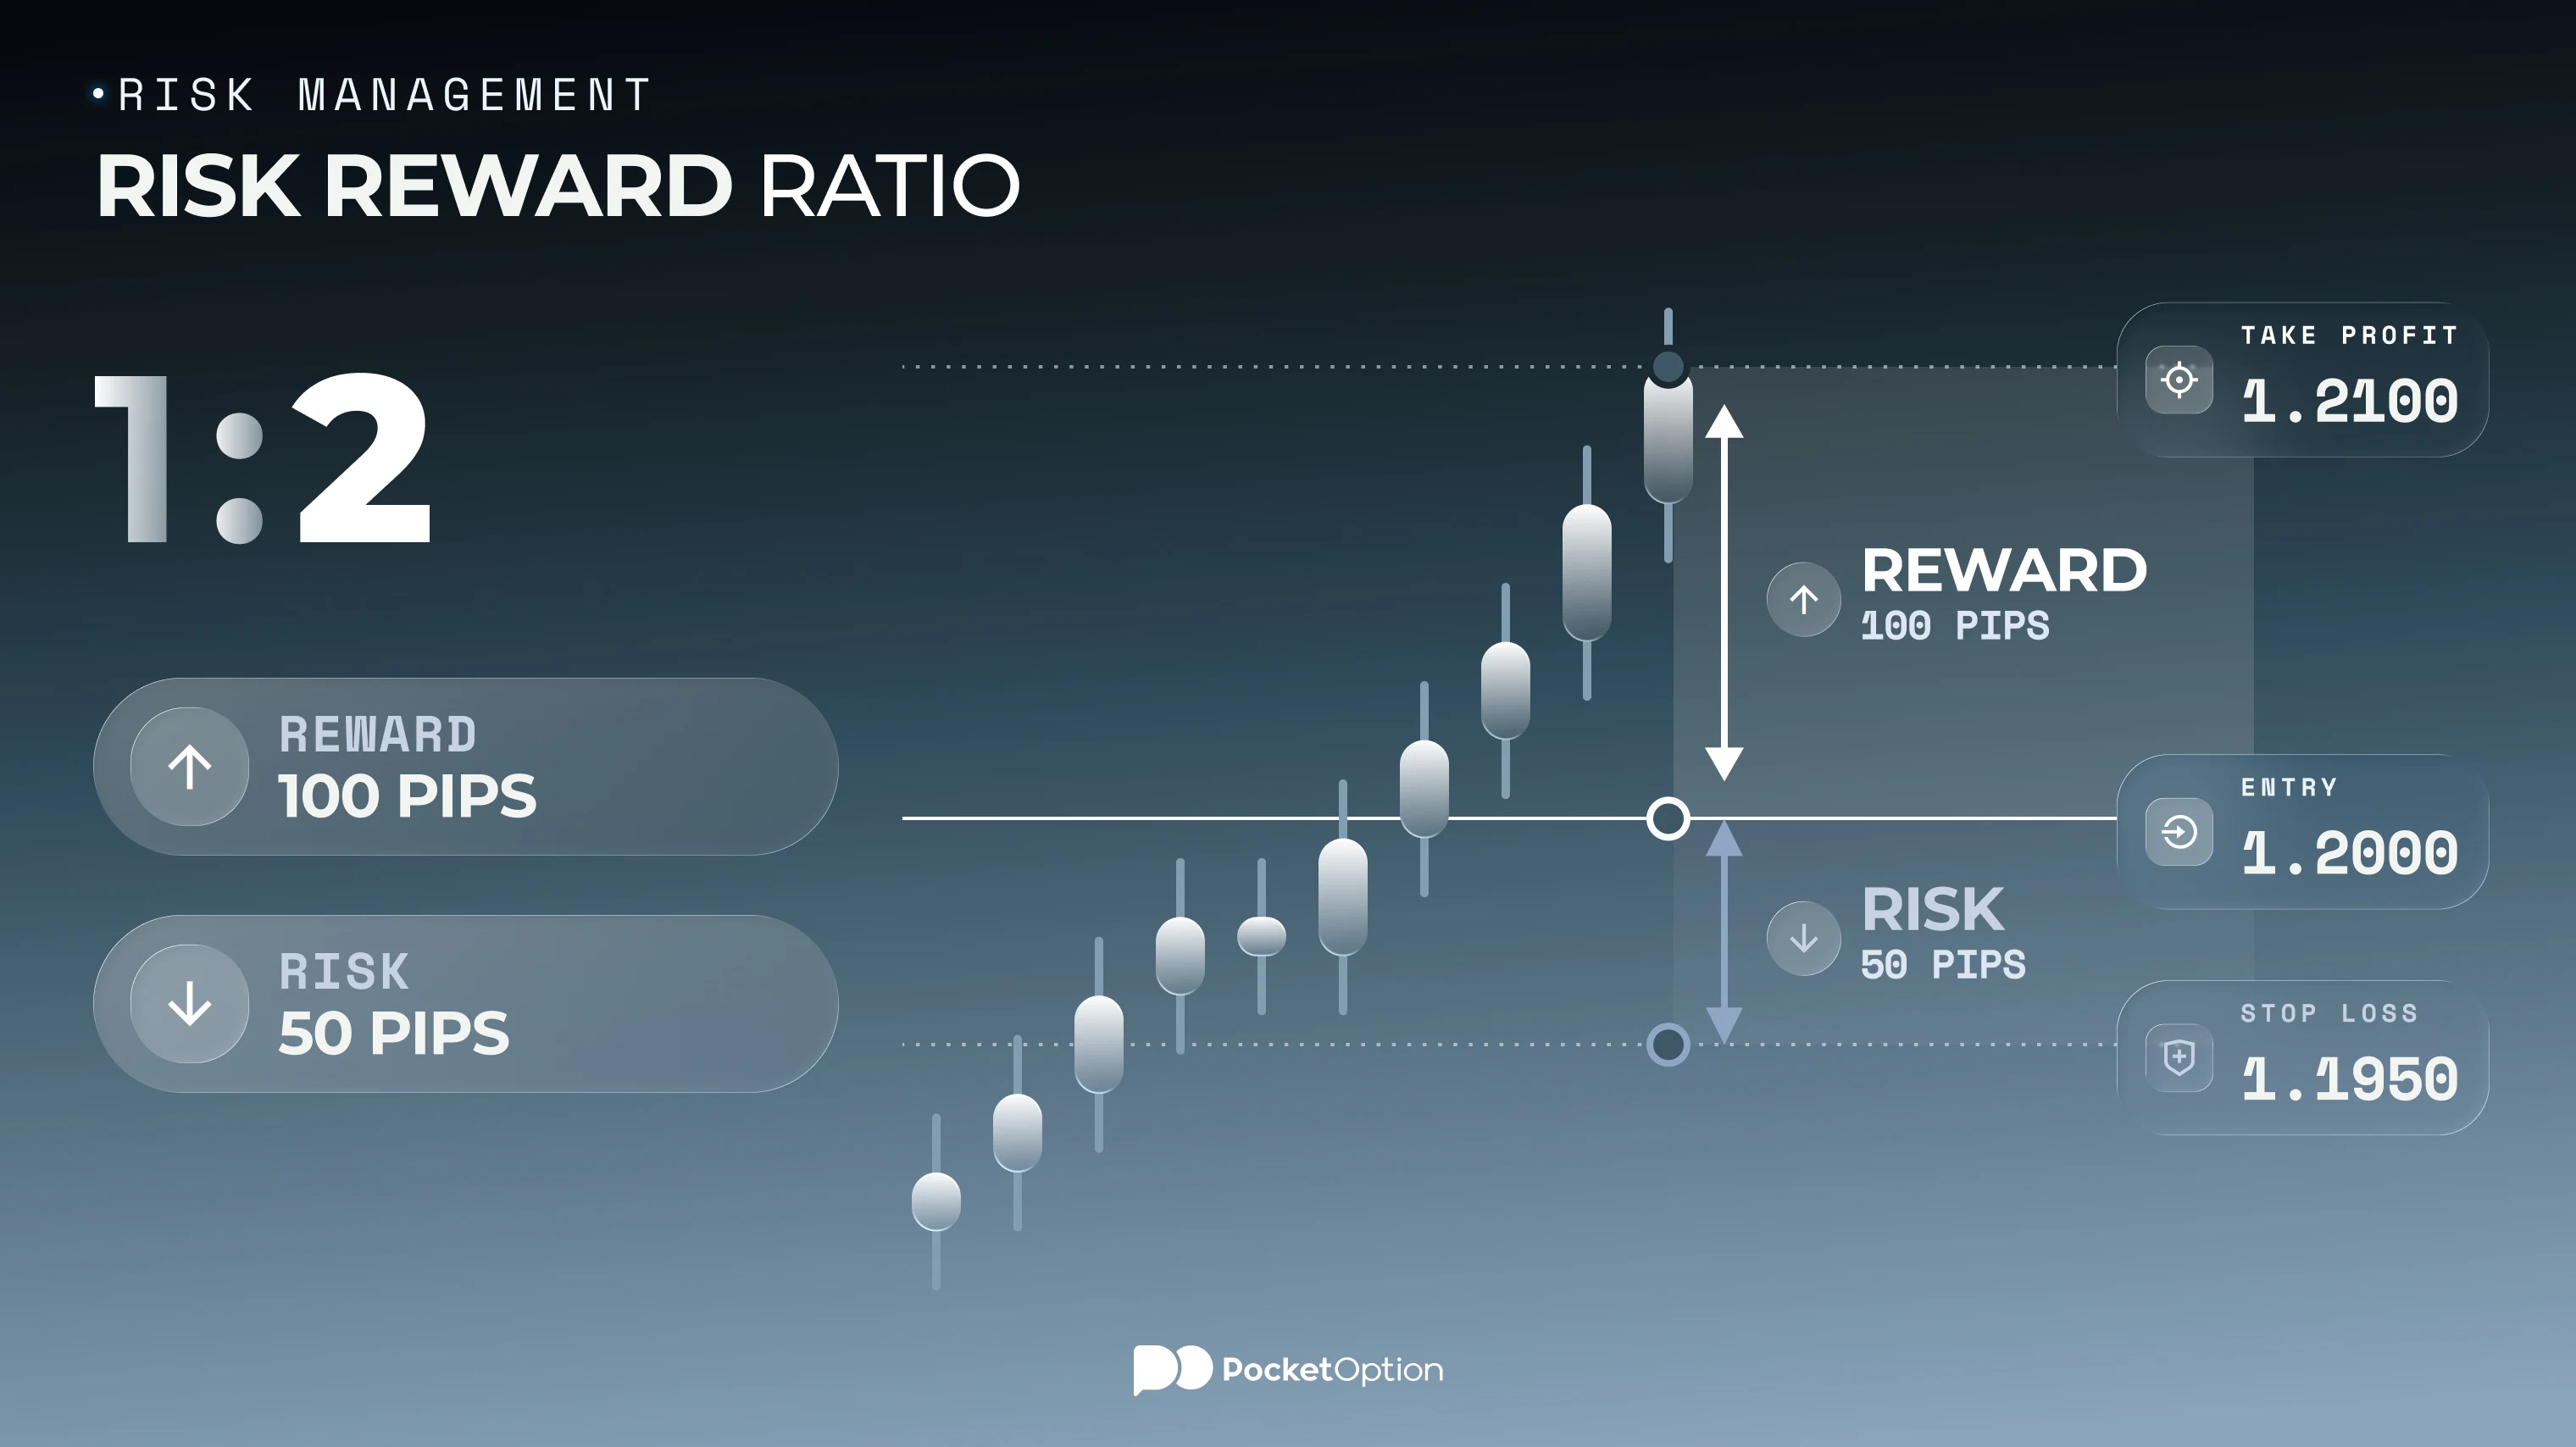
The math behind risk to reward ratio is deliberately simple: divide the amount at risk by the potential reward, or equivalently, compare the distance to the stop loss against the distance to the take profit. Risk $50 to potentially make $100 and the risk to reward ratio comes out to 1:2, half a dollar risked for every dollar of potential gain. Watching that same math play out on a live chart sticks better than reading it, and the pocket option tutorial covers chart basics first if any of this still feels new.
How to Read 1:2 and 1:3
1:2 means risking one part for two parts of potential reward. 1:3 stretches that further, one part risked for three parts potential reward. Neither number is a forecast. Both describe a possible scenario built around a specific entry, stop, and target, nothing more. Punching the same numbers into any risk reward ratio calculator produces the identical ratio, since the math itself never changes, only the inputs feeding it do.
Where Stop Loss and Take Profit Fit
Risk gets measured to the stop loss. Reward gets measured to the take profit. Say a trade enters at 1.2000, with a stop loss at 1.1950 and a take profit at 1.2100. Risk equals 50 pips, reward equals 100 pips, and the ratio comes out to 1:2 again. Any risk to reward ratio calculator does exactly this same subtraction and division, just faster.
When a Big Target Can Mislead You
A big number on its own proves nothing. An impressive risk-reward ratio built on a target sitting far outside any realistic price range looks great on paper and rarely plays out the way the math suggests. The setup itself, market context, and how far price realistically tends to move all matter just as much as the ratio attached to a trade idea.
Why Win Rate Changes the Whole Picture
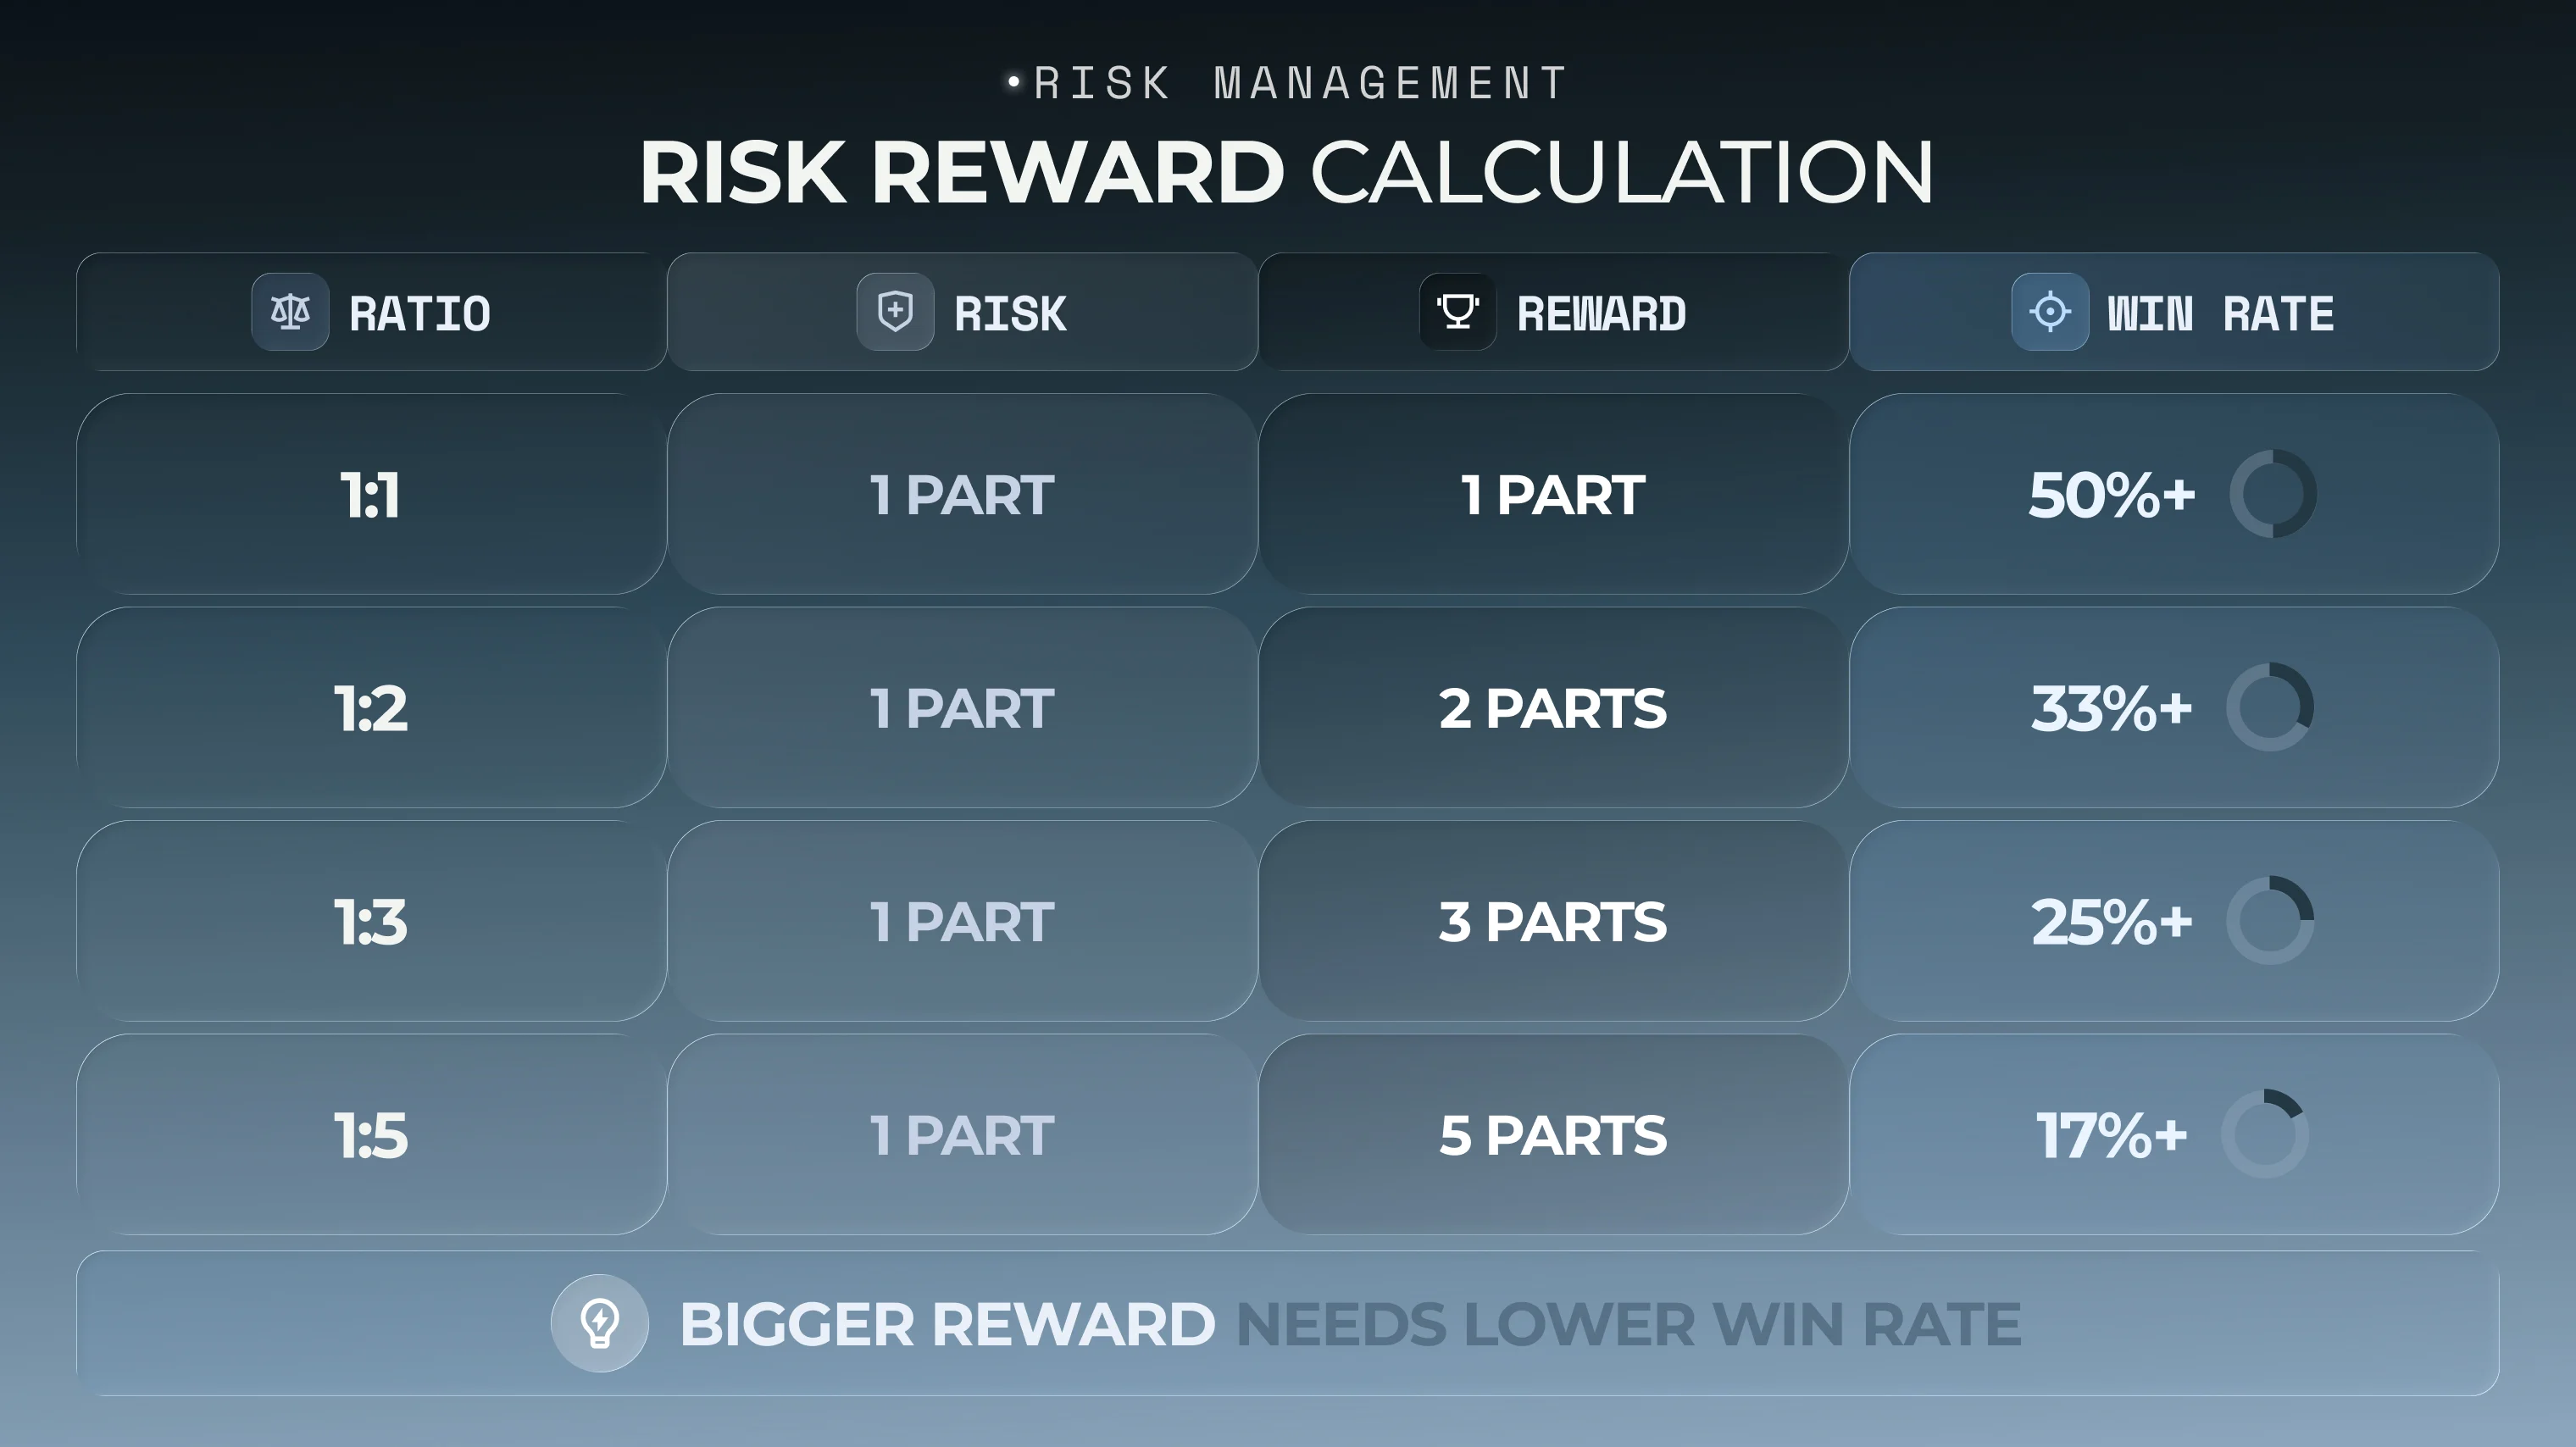
A reward to risk ratio never stands alone. A strategy with a low win rate might genuinely need a larger reward relative to risk just to stay profitable over time. A strategy with a high win rate can still lose money overall if the reward relative to risk on each trade runs too thin.
Ratio | Risk Share | Reward Share | Win Rate Needed to Break Even |
|---|---|---|---|
1:1 | 1 part | 1 part | Above 50% |
1:2 | 1 part | 2 parts | Above 33% |
1:3 | 1 part | 3 parts | Above 25% |
1:5 | 1 part | 5 parts | Above 17% |
Neither number tells the full story without the other sitting next to it.
How This Connects to Trading Expectancy
Trading expectancy pulls win rate, average win, and average loss together into a single number describing whether a system holds up over many trades, not just one. Risk reward ratio trading decisions feed directly into that calculation, since the ratio on each individual trade shapes what the average win and average loss actually end up being once enough trades have accumulated.
What a Calculator Can and Cannot Tell You
A calculator speeds up the arithmetic, nothing more. Feed it entry price, stop loss, take profit, and position size, and it returns a risk/reward ratio instantly. What it cannot supply is whether the stop and target actually make sense for the setup, whether the position size fits the account, or whether the underlying trade idea holds up at all. The math is the easy part.
Mistakes That Make the Math Look Better Than It Is
A handful of habits make the reward to risk ratio formula look better on a screen than the trade actually is in practice.
Counting only the potential profit while ignoring how the risk side actually gets measured.
Placing a stop loss at a random distance rather than a level that genuinely invalidates the idea.
Choosing a take profit target with no real logic behind where price might actually stall.
Chasing 1:5 or higher without a realistic scenario for price actually reaching that target.
Ignoring win rate entirely and treating the ratio as the whole picture.
Confusing a favorable ratio with a guaranteed return, when it describes a possible outcome, not a promised one.
Risks Before You Apply the Numbers in Real Trades
A calculated ratio can fail for reasons that have nothing to do with the math itself. Volatility can blow through a stop loss before it ever triggers cleanly. Gaps and slippage can fill an order at a worse price than planned. An emotional exit, closing early out of fear or holding too long out of hope, can override the original plan entirely. A low win rate can erode even a favorable ratio over enough trades. And leverage magnifies every one of these outcomes, favorable or not.
Risk Disclaimer: Trading involves significant risk of capital loss. This article is for educational purposes only and does not constitute financial advice. Always conduct independent research and consider your risk tolerance before making any trading decisions.
ดูเพิ่มเติม:Glossary