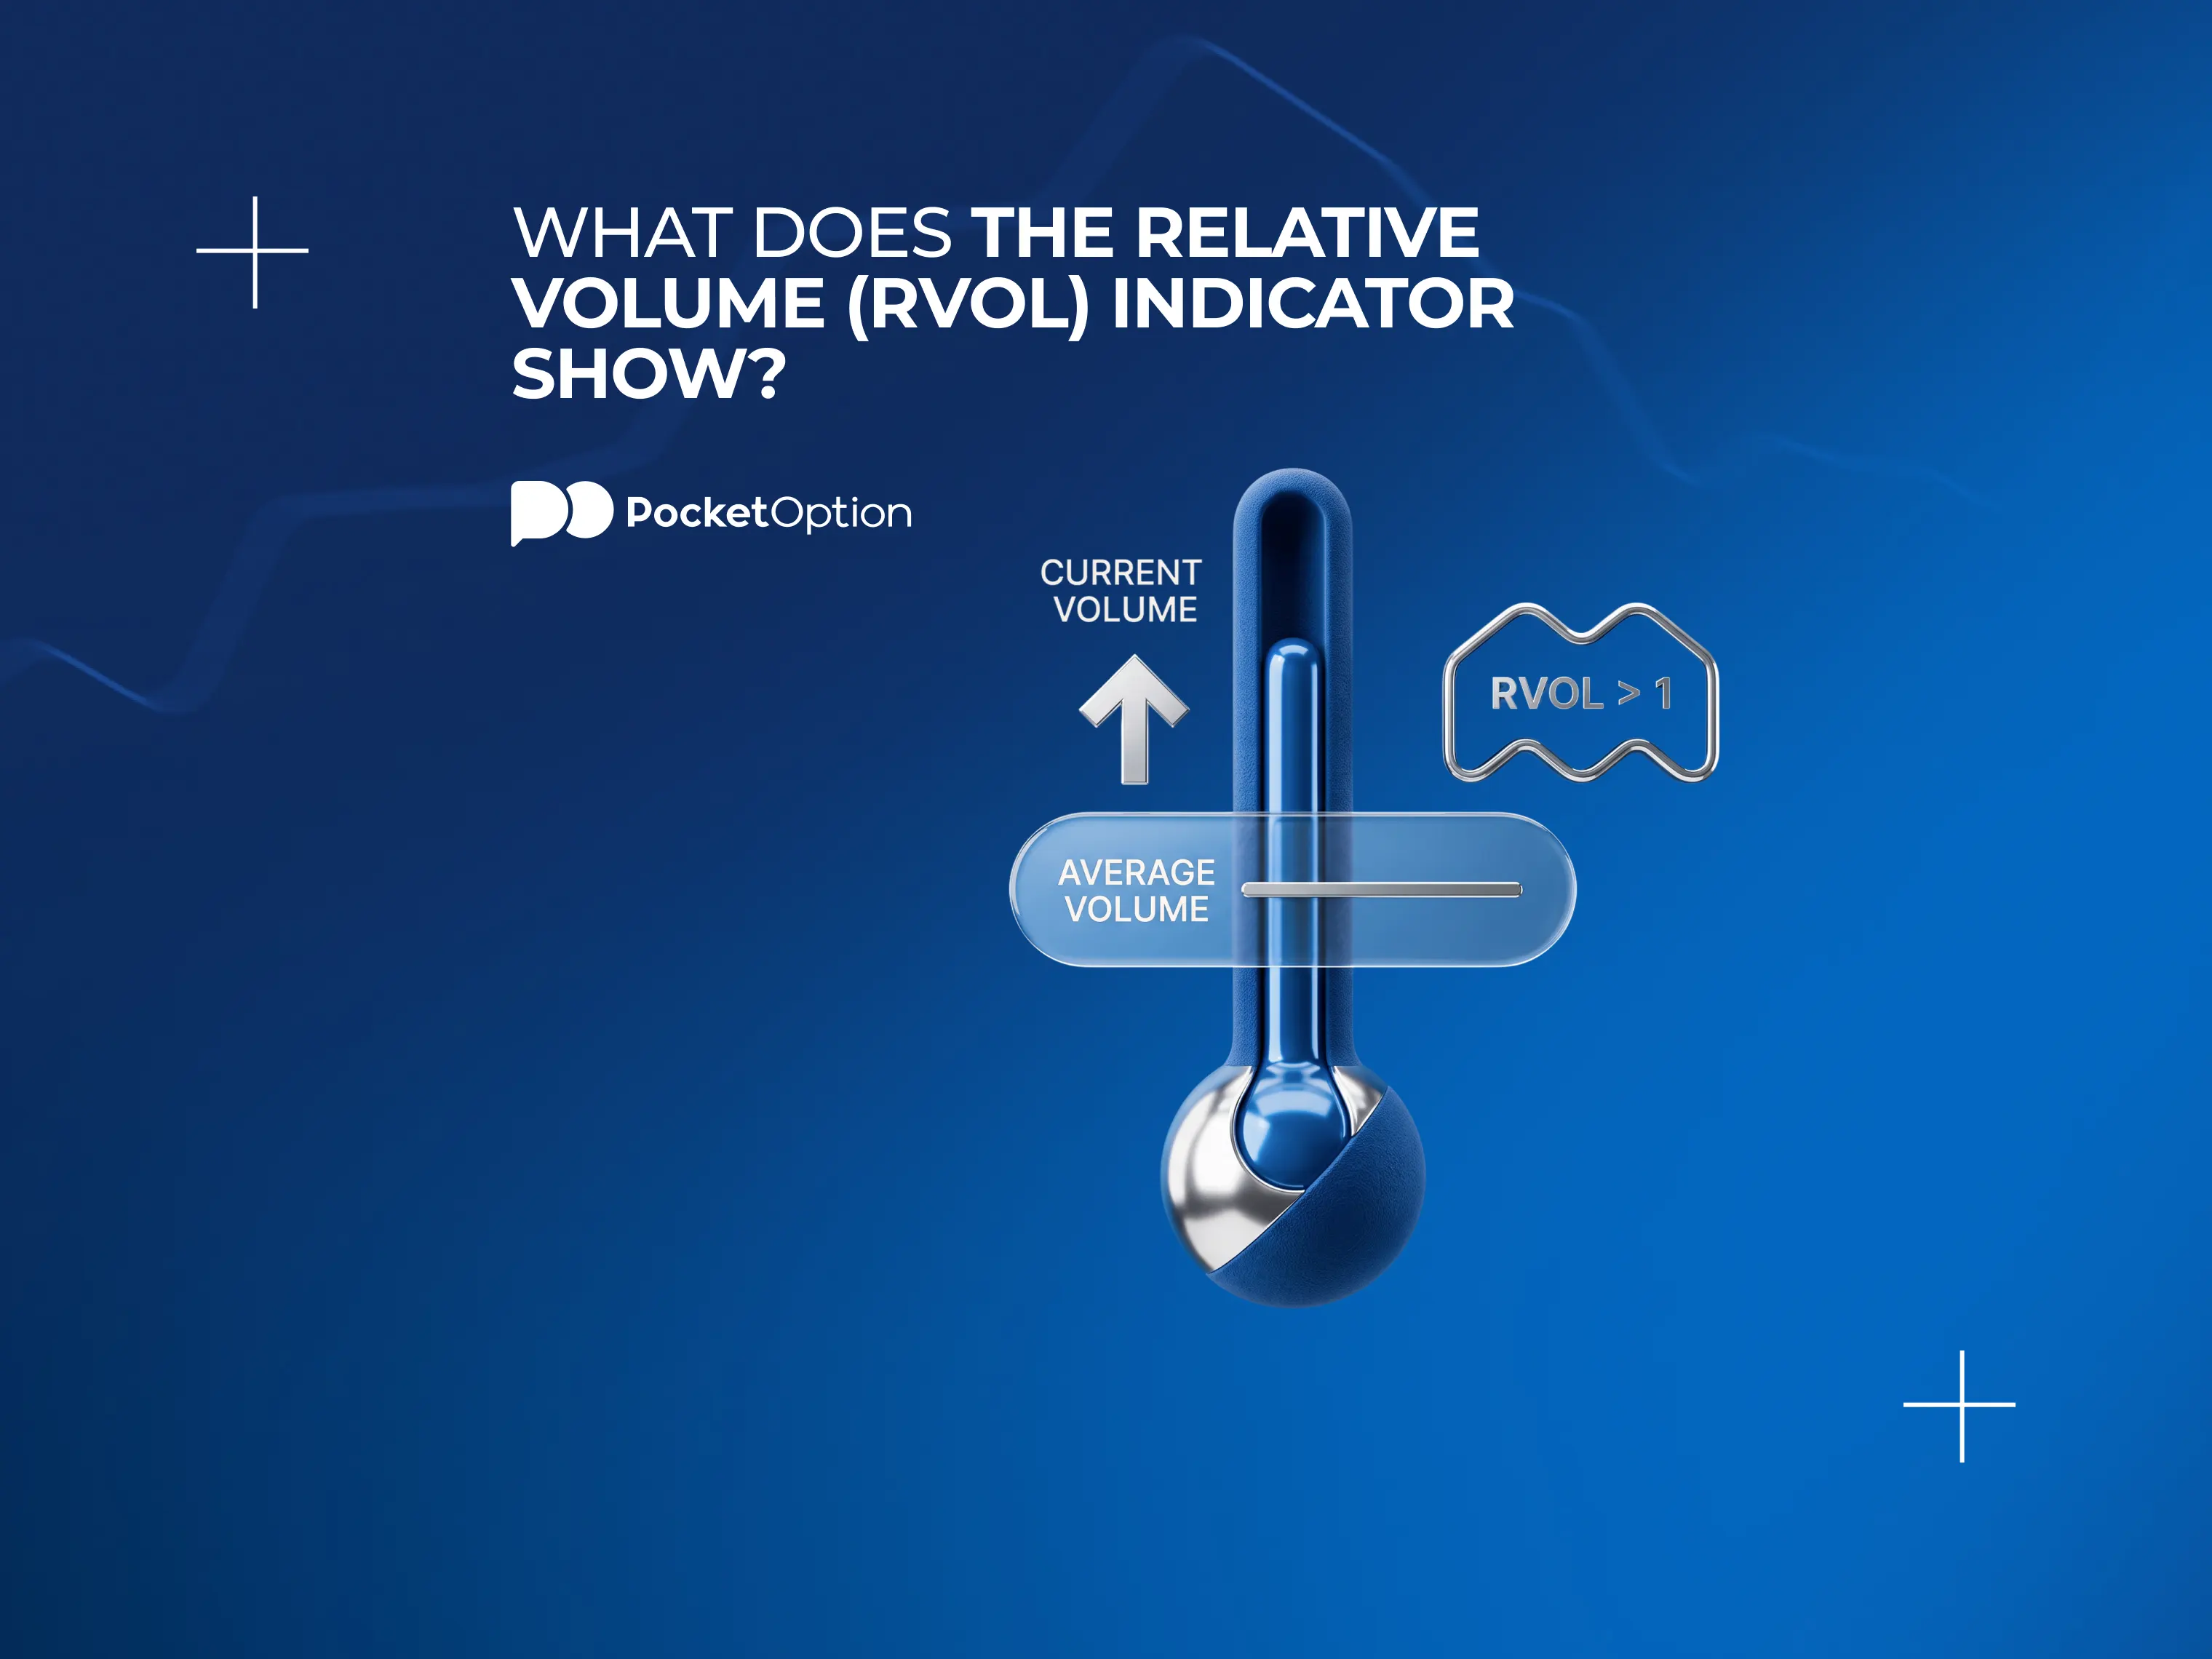
What Does the Relative Volume (RVOL) Indicator Show?
Relative volume compares current trading activity to an instrument's typical level, using the formula current volume divided by average volume. This guide covers the formula, how to read values above and below 1, how RVOL differs from regular volume, and its limits.

Relative Volume: When Volume Needs Some Context
Walk down the same street at the same hour often enough and a baseline forms in your head, how busy it normally gets at that particular time. Some days it's dead quiet. Other days a crowd shows up that's noticeably bigger than usual. Relative volume applies that same comparison to trading activity, measuring what's happening right now against what a given instrument typically sees.
A high reading on relative volume means more activity than usual is showing up, nothing more specific than that. It doesn't say which direction price is heading, and it doesn't guarantee the elevated activity continues. Relative volume flags that something unusual is happening. Reading the rest of the chart is still necessary to figure out what.
Open a free demo account and get a feel for volume in real time, using virtual funds.
Try Demo AccountCurious how this actually moves alongside price on a live chart? Reading about the concept only goes so far. Watching activity spike or fade in real time shows the pattern faster than any description can.
Open a demo trading account and get a feel for how volume actually behaves, with virtual funds and nothing real on the line.
How the RVOL Indicator Does the Math
The rvol indicator runs on one simple formula: current volume divided by average volume. Current volume is whatever activity is showing up right now, over whatever period the chart is measuring. Average volume is the typical level for that same instrument over some longer stretch, a baseline built from past sessions.
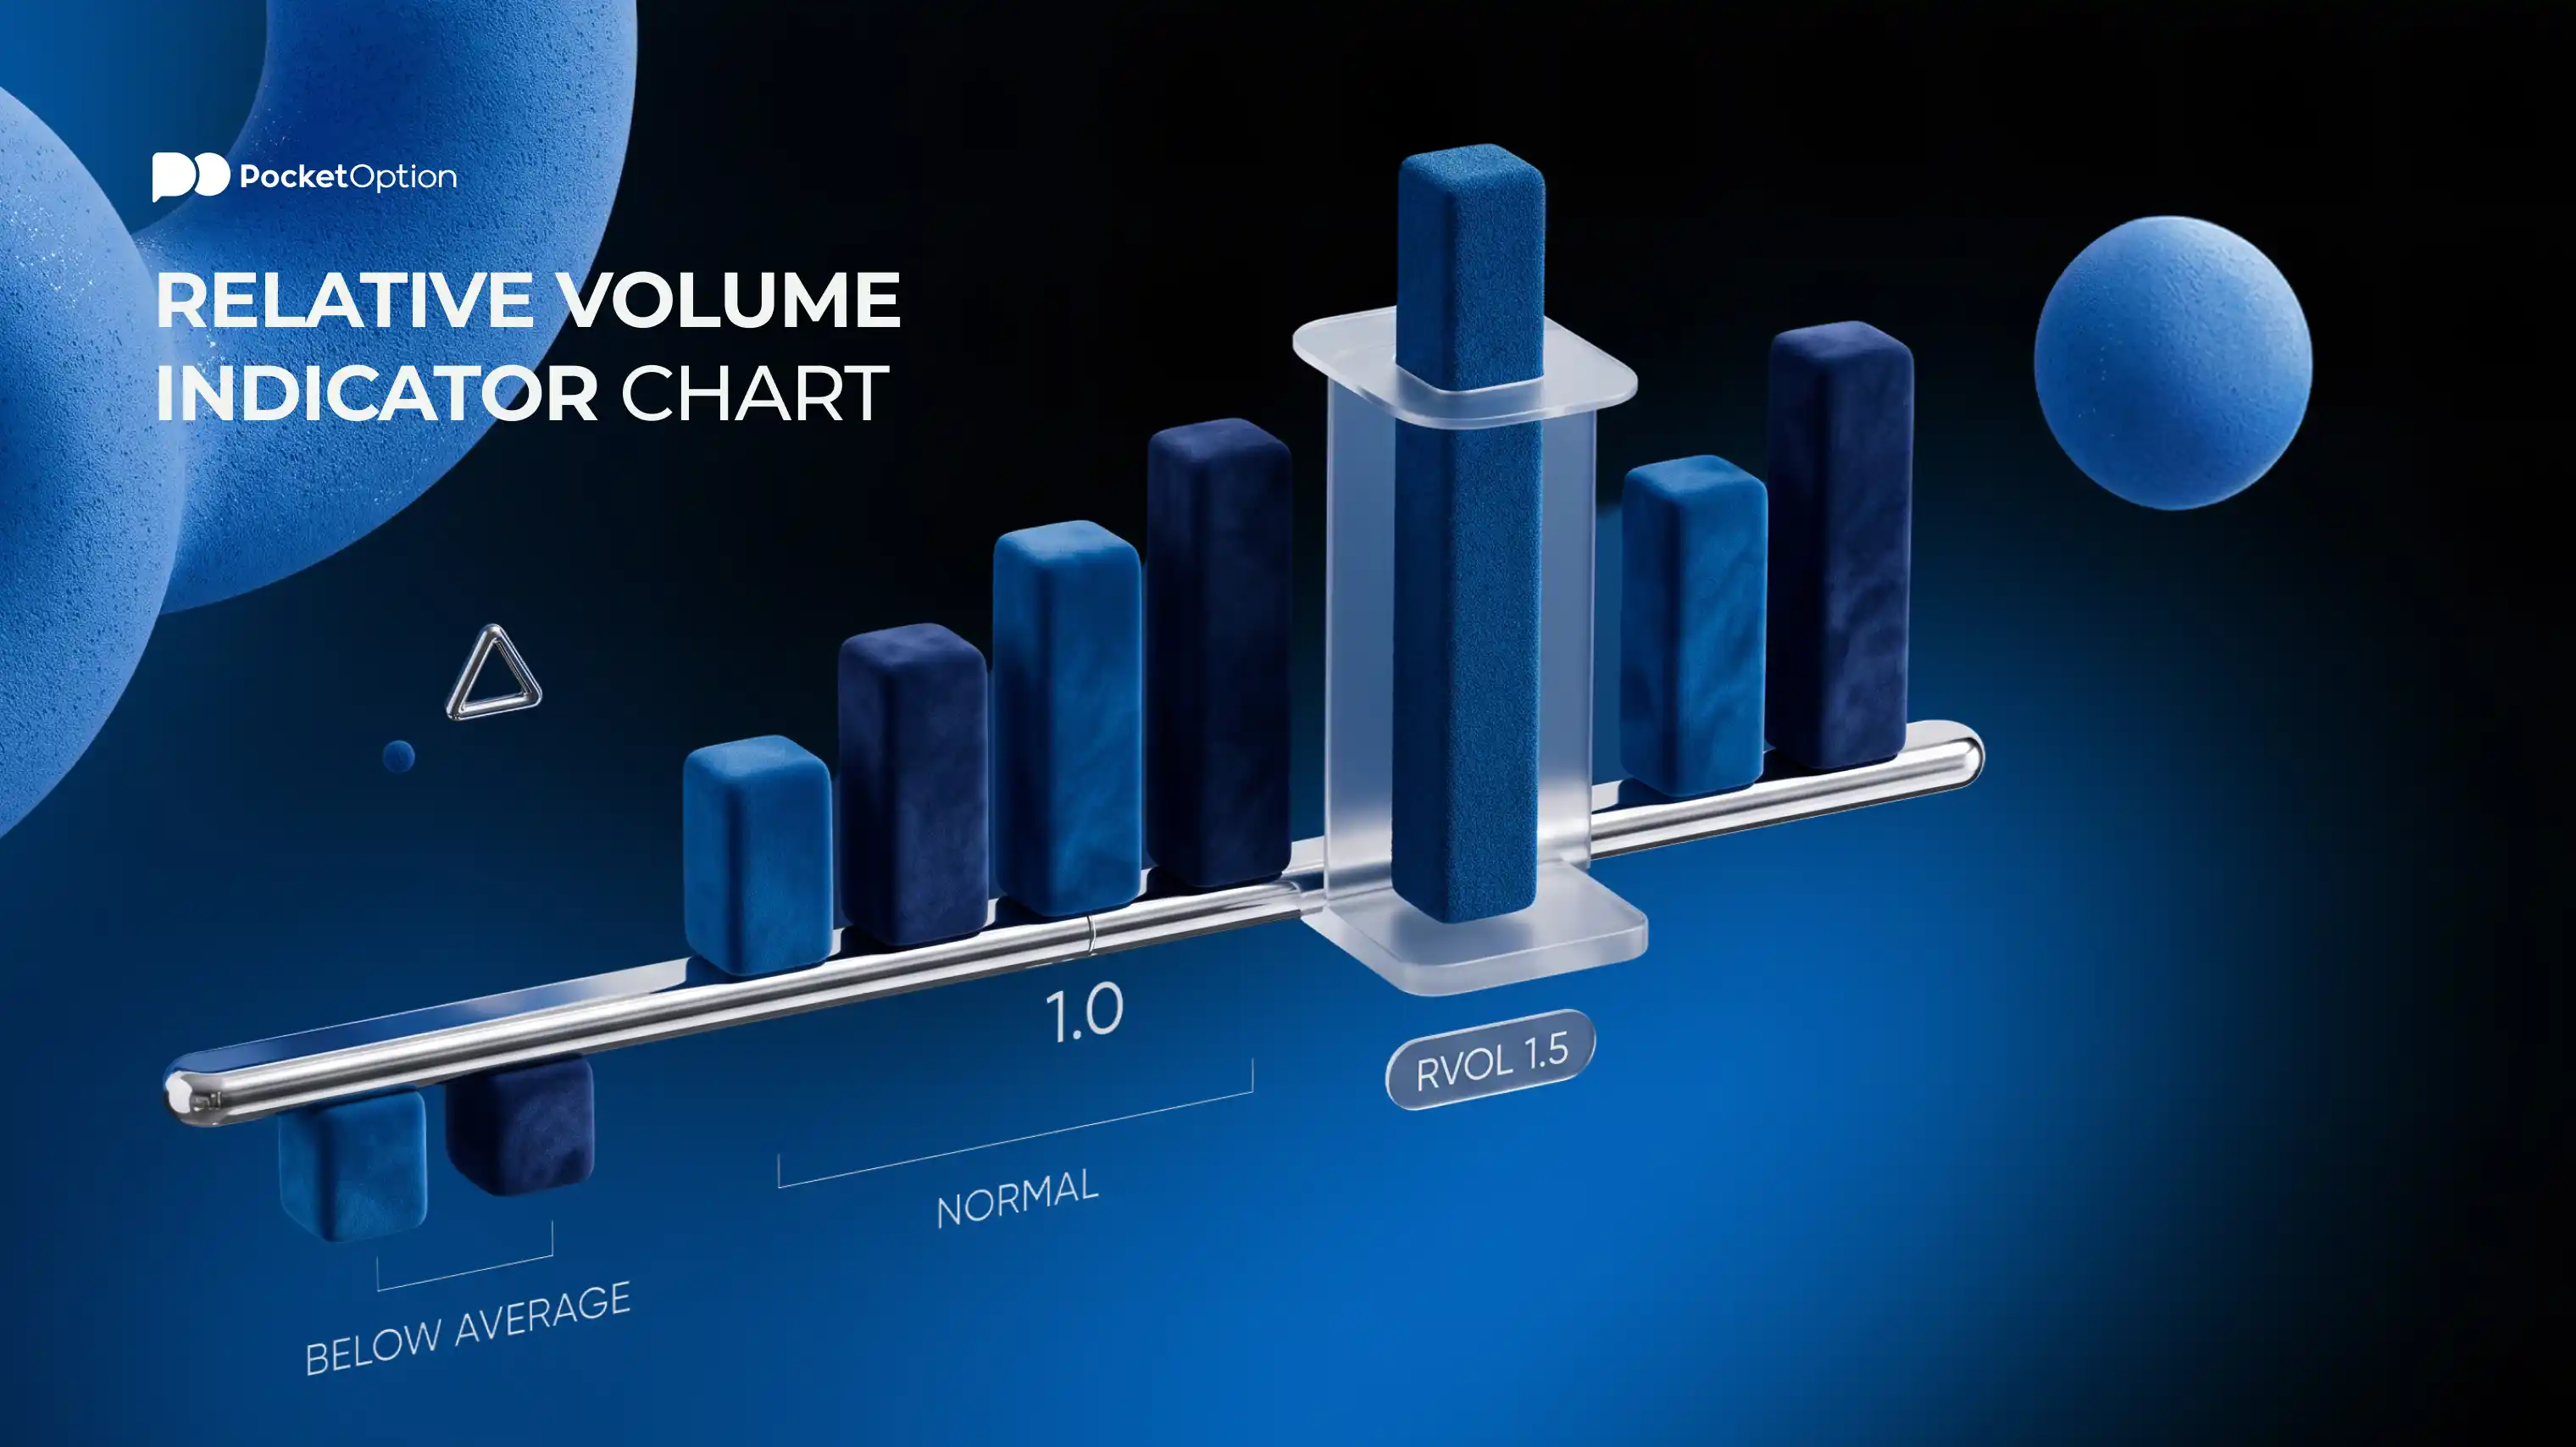
Say current volume comes in at 150,000 shares and average volume for that stock normally sits around 100,000. Divide the two and the rvol indicator reads 1.5, meaning activity is running 50% above typical. The exact method for calculating both numbers varies by implementation. Intraday versions often compare activity to the same point in previous sessions rather than a full-day total, and checking how your Pocket Option login platform specifically defines them is worth doing before relying on the reading.
What an RVOL Reading Actually Means
Reading the relative volume indicator comes down to where the number sits relative to 1. Below 1 means activity is running quieter than typical. Around 1 means activity looks roughly normal. Above 1 means more activity than usual, with the size of the number reflecting how much more.
RVOL Reading | What It Suggests | What It Does Not Tell You |
|---|---|---|
Below 1 | Activity is quieter than typical for this instrument | Whether that quiet continues or reverses |
Around 1 | Activity looks roughly normal | Anything unusual about current conditions |
Above 1 | Activity is running above the typical level | Which direction price will move next |
None of these readings come with a fixed threshold attached. A relative volume indicator value that counts as notable on one asset might be unremarkable on another, since typical activity levels differ from instrument to instrument and even session to session.
Regular Volume and RVOL Are Not the Same Thing
Regular volume counts activity over whatever period gets selected, a single number with no built-in comparison attached. RVOL takes that activity and measures it against a typical or average level, turning a raw count into a relative read. Depending on the market, the underlying data can come from actual traded volume or from tick volume, a count of price changes used as a stand-in where true volume isn't available.
When RVOL Can Be Misleading
A handful of situations can distort what RVOL actually shows. Low liquidity instruments can produce wild swings in the reading from small changes in activity. Different points in a session naturally carry different typical volume levels, so comparing across sessions without accounting for that skews the picture. A news spike can inflate the reading without saying anything about where price goes next. The averaging period chosen affects the baseline itself, and differences in data source or method mean the same activity can produce different readings across platforms. RVOL flags that something unusual is happening. It doesn't forecast direction or say anything about how a trade built around that activity would turn out.
Risk Disclaimer: Trading involves significant risk of capital loss. This article is for educational purposes only and does not constitute financial advice. Always conduct independent research and consider your risk tolerance before making any trading decisions.
Vedi di più:Glossary