What Is Open Interest in Trading?
A parking lot tells you two different things depending on which number you check. Count how many cars are parked right now and you get one number, a snapshot of who is still there. Count how many pulled in and out over the whole day and you get a different number, possibly much higher even if the lot never filled up. Trading has a version of that same split, one number counting what's still open, another counting everything that moved.

Why Open Positions Matter to Traders
Open interest counts the number of contracts, futures, options, or other derivatives, that remain open at a given moment: not closed, not exercised, not expired. It is a headcount of positions still sitting on the table, not a measure of how busy trading has been.
A rising or falling open interest number says something about how many participants are engaged with an instrument right now. It does not, by itself, say which direction price will move next. Open interest works as one input among several, useful for gauging interest and liquidity, not as a standalone signal. Getting comfortable reading open interest alongside price pays off across options, futures, and crypto derivatives alike.
Open a free demo account and practice reading contract data on real charts, using virtual funds.
Try Demo AccountCurious how this number actually moves alongside price on a live chart? Reading about the concept only goes so far. Watching this metric and price move together, or apart, teaches the relationship faster than any explanation can.
Open a demo trading account and get familiar with reading contract data on real charts, with virtual funds and nothing real on the line.
The Contract Count Behind the Metric
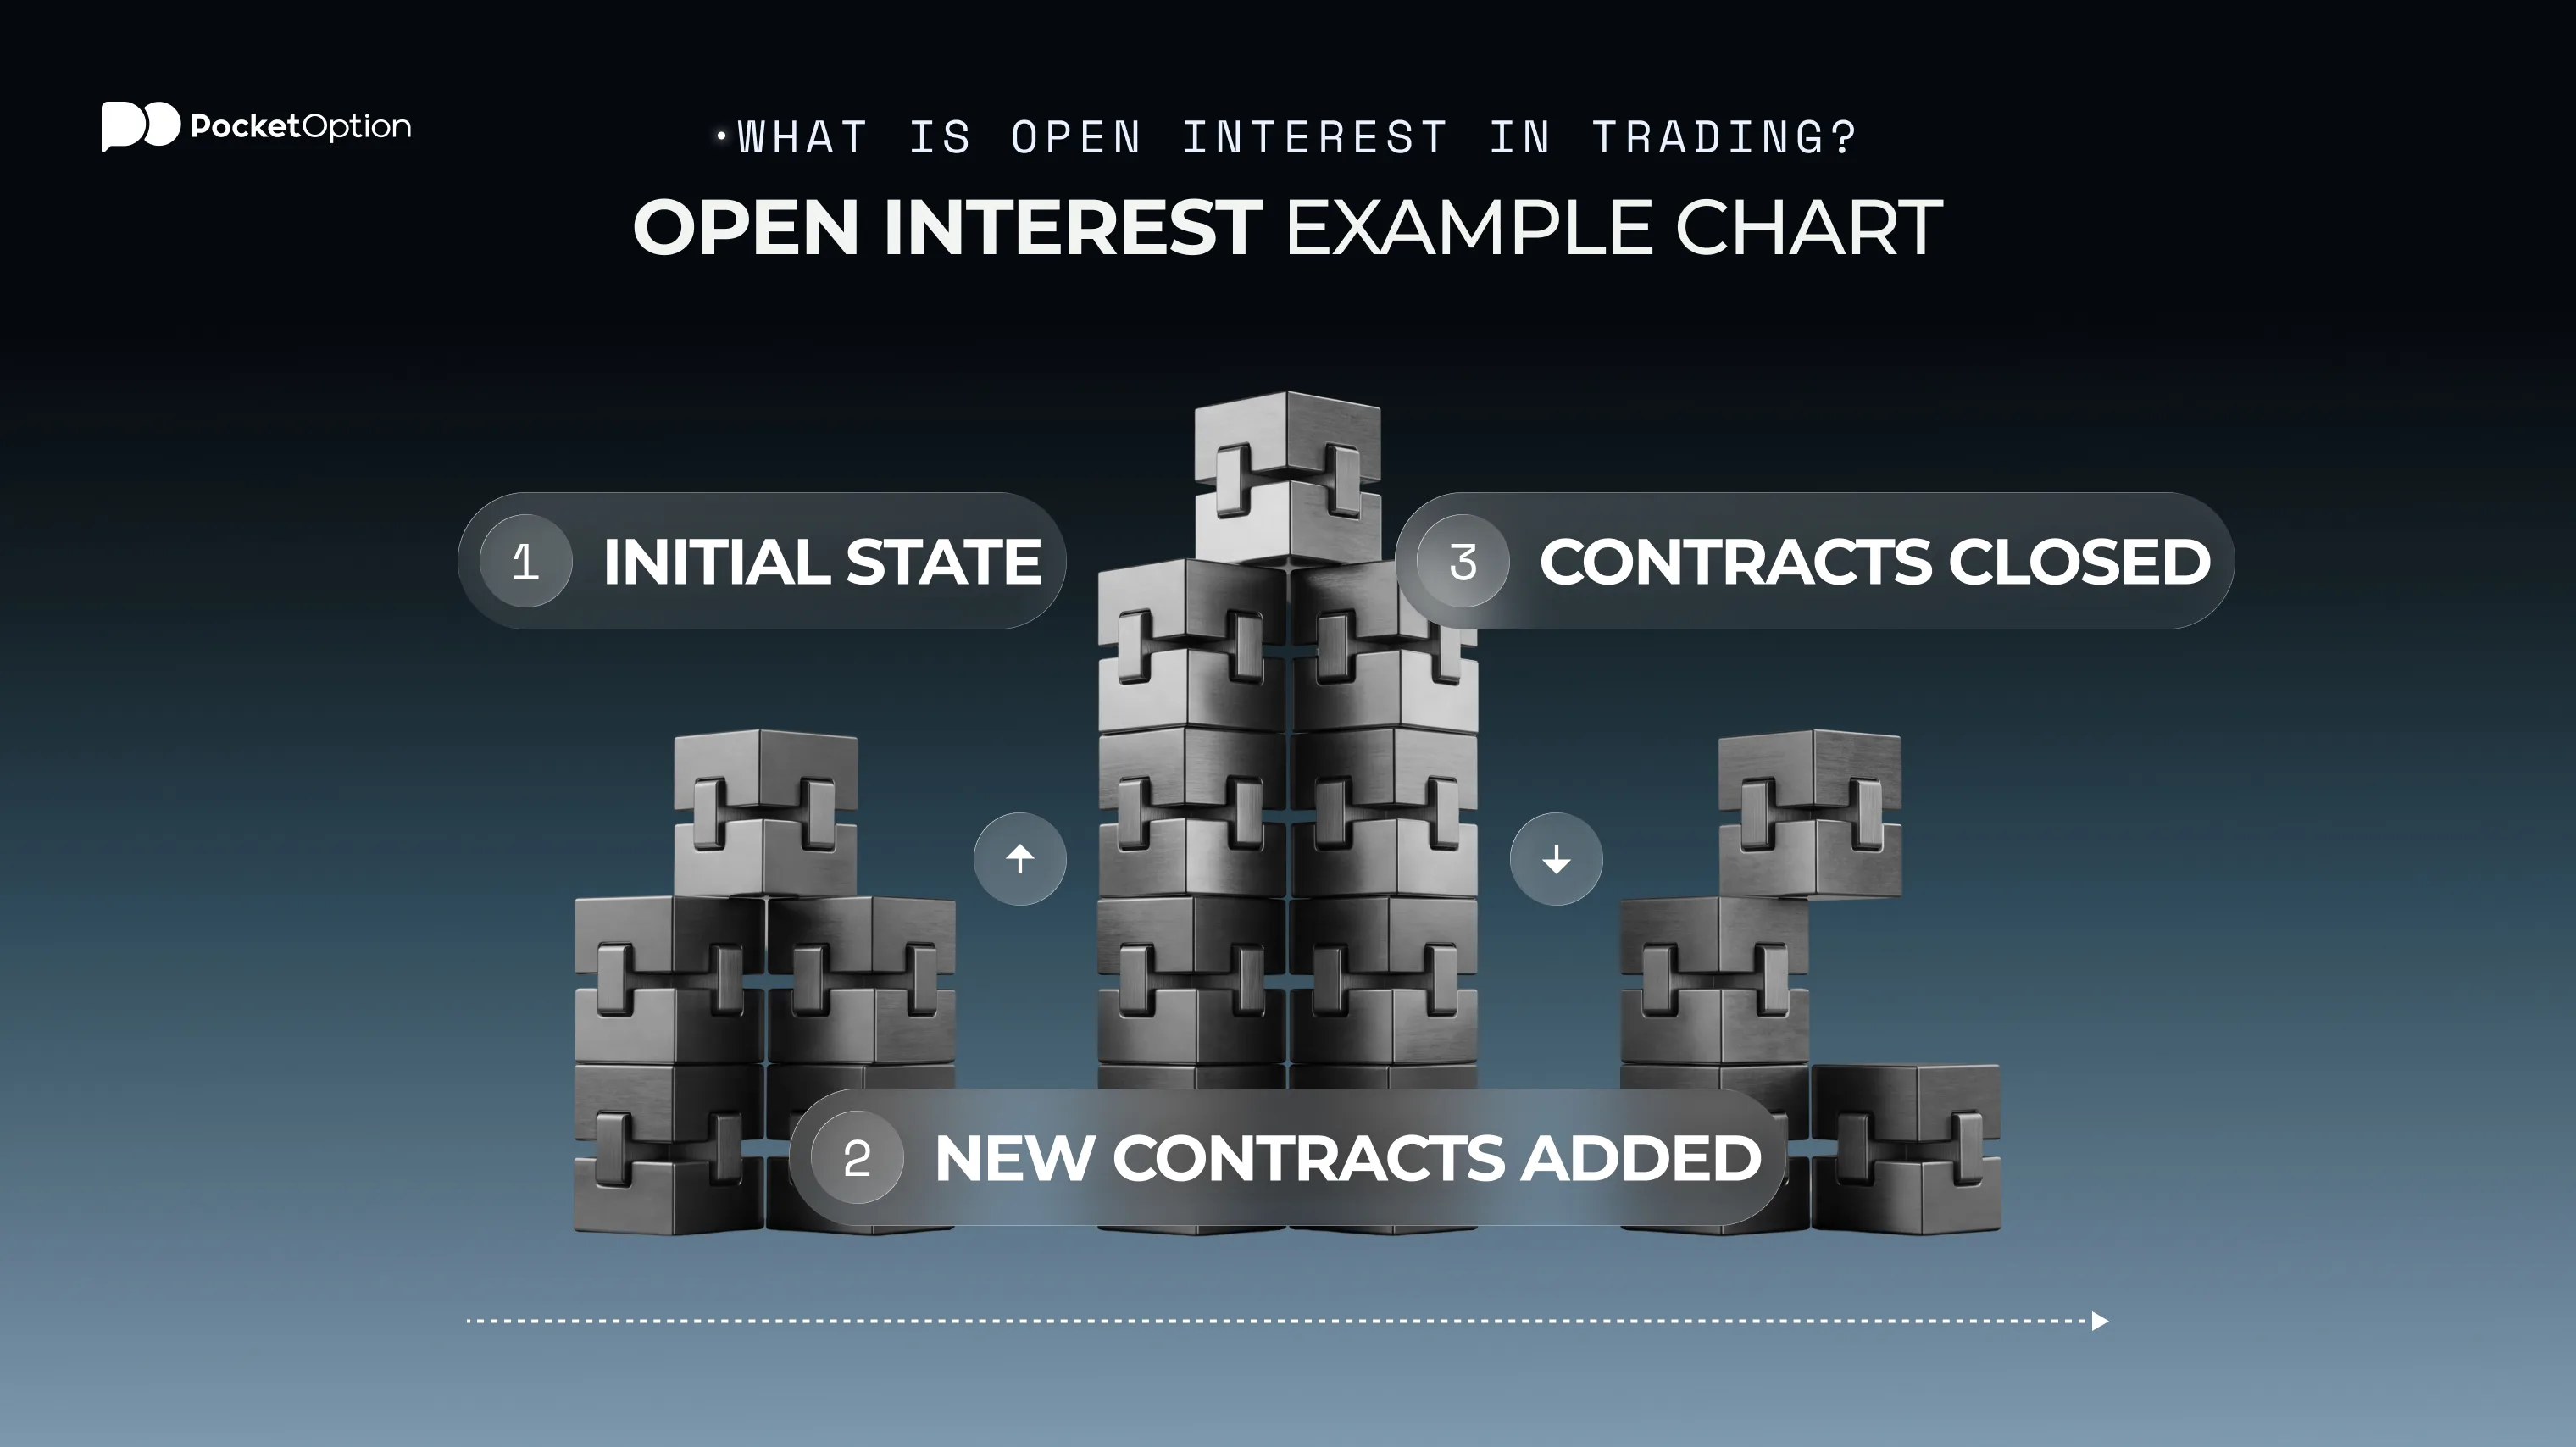
Open interest options data grows when a new contract gets created between a buyer and a seller, one opening a fresh long position, the other a fresh short one. It shrinks when an existing contract closes out or expires. Nothing about that mechanic is complicated, though the number itself gets discussed as if it were.
Reading open interest options data on a real chart, watching it climb or fade alongside price, makes the concept click faster than any written explanation, and the pocket option tutorial covers chart basics first if any of this still feels unfamiliar.
Why One Deal Adds One Contract, Not Two
Every contract involves two sides, a buyer and a seller, but this figure counts the contract itself, not the people involved. One new futures contract adds exactly one to that count, never two. Answering what does open interest mean in options terms comes down to that detail: a count of agreements outstanding, not participants.
What Changes When a Position Is Closed
Closing a position can lower the count, but only if both sides of an existing contract actually close out against each other. A trader selling to close while another buys to close removes that contract from the total. The same open interest definition futures crypto markets use applies identically whether the underlying is an option, a futures contract, or a perpetual crypto derivative.
Volume Shows Activity, This Shows Commitment
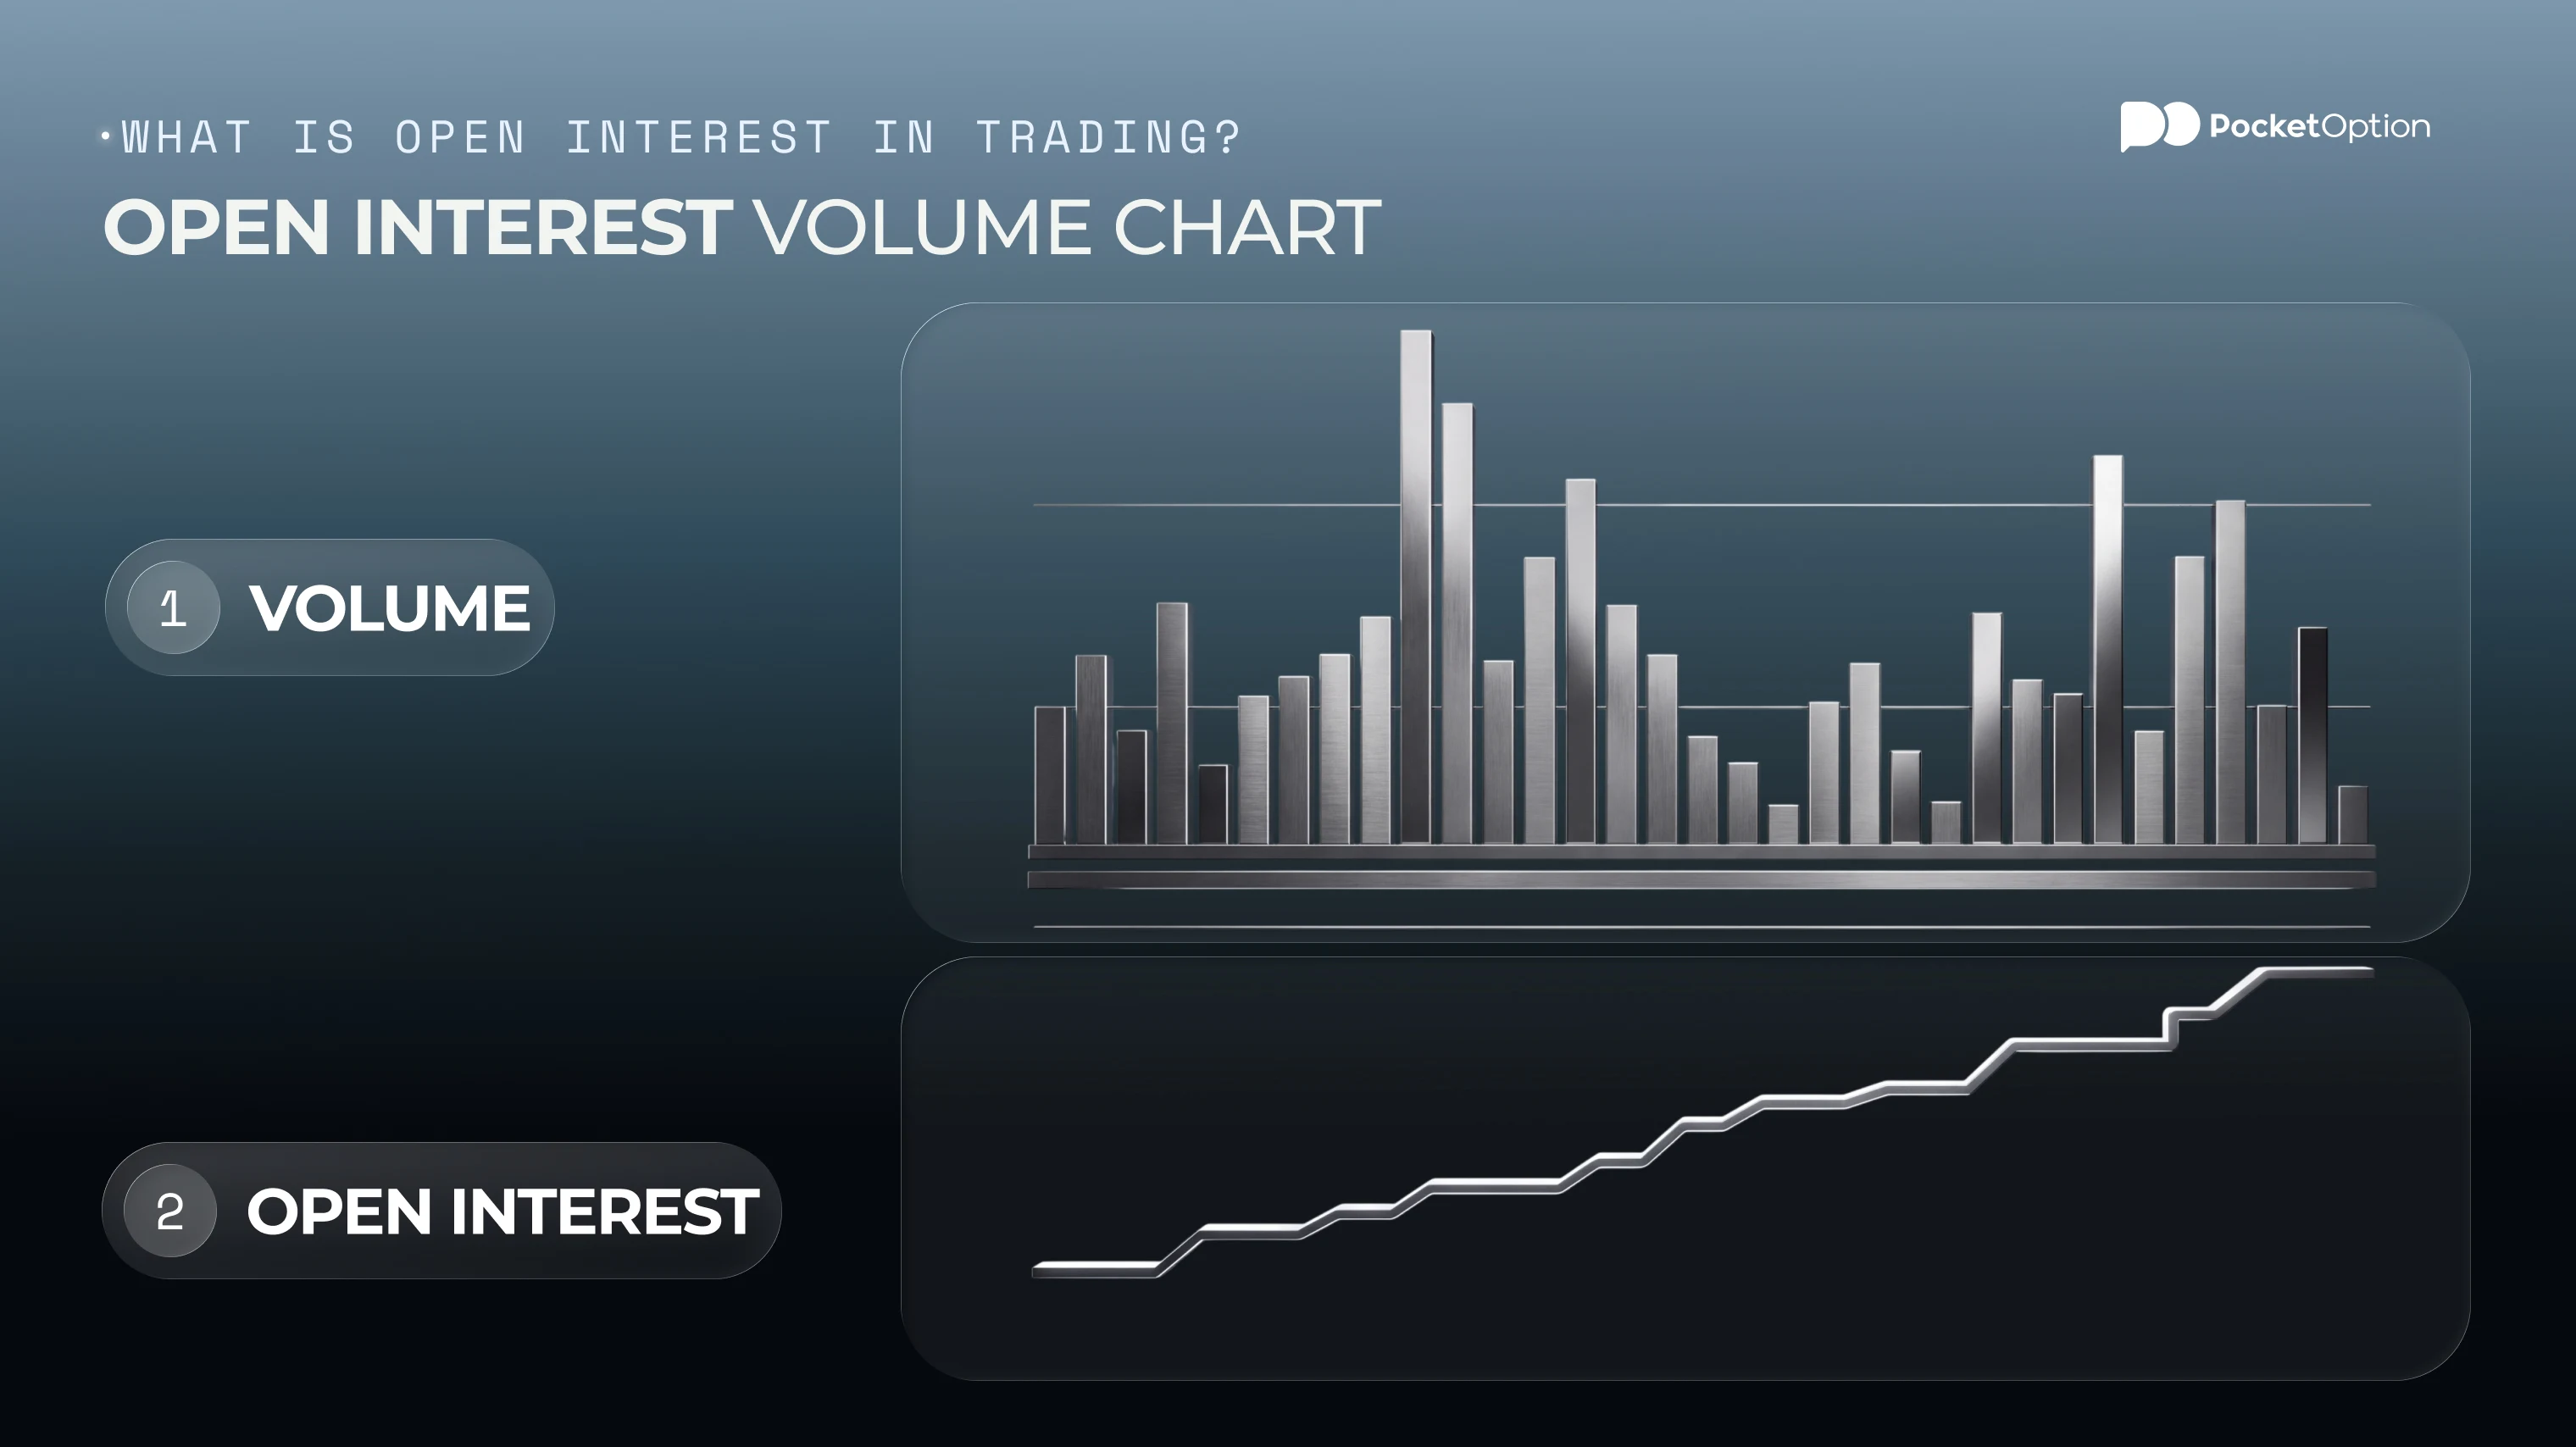
Volume counts how many contracts changed hands during a specific period, a full trading day most commonly. The other figure counts how many contracts remain outstanding at a single point in time instead. The two numbers can move independently of each other, and often do.
Metric | What It Counts | Resets | Tells You |
|---|---|---|---|
Volume | Contracts traded during a period | Yes, each new period | How much activity happened |
Open Interest | Contracts still open right now | No, carries forward | How many positions remain outstanding |
Understanding what is open interest in options specifically means keeping these two numbers separate in your head, since conflating them leads to reading the wrong signal from either one.
What Rising or Falling Numbers Can Suggest
Comparing price direction against this metric's own direction produces a handful of common combinations worth recognizing, purely as context rather than a forecast.
Price | Open Interest | Possible Read |
|---|---|---|
Rising | Rising | New money entering, move may have support behind it |
Rising | Falling | Existing positions closing, rally may lack fresh backing |
Falling | Rising | New positions opening into the decline, conviction on the down move |
Falling | Falling | Positions unwinding broadly, decline may be losing steam |
None of these combinations guarantees an outcome. Reading open interest vs volume together, rather than either number alone, at least frames what might be happening beneath the price action, and comparing open interest vs volume across a longer stretch of time tends to say more than a single day's snapshot ever could.
How Options Traders Read the Clues
Options traders often look at this figure broken down by strike price and expiration date, not just as one aggregate number. A strike with an unusually high reading suggests a level where a meaningful number of participants have a stake in the outcome. What is open interest telling you at that specific strike versus the overall total are two different, complementary reads, and neither substitutes for the full options chain in context.
Futures and Crypto: Same Idea, Different Markets
The same concept carries over to futures and crypto derivatives without much modification. Futures traders track this same metric across contract months to gauge where positioning concentrates. Crypto derivatives traders watch it too, though a high reading there often signals leverage building up rather than a directional lean either way. A crowded, leveraged market can unwind sharply either direction once it starts moving.
Liquidity, Crowded Trades and the Bigger Picture
A higher reading generally means more participants and often more liquidity, easier entry and exit without moving price too much. It does not mean a better trade setup. Crowded positioning, lots of traders on the same side, can set up sharp moves when that crowd eventually has to unwind. A low reading does not make an instrument unusable either, just typically thinner and more prone to wider spreads.
Mistakes That Turn Data Into Bad Signals
A handful of habits turn this useful metric into a misleading one.
Confusing open interest with trading volume, when the two measure genuinely different things.
Treating a rising number as an automatic buy signal, with no other context attached.
Watching open interest without ever looking at what price is actually doing alongside it.
Ignoring expiration dates entirely, especially in options and dated futures contracts.
Applying the same read across every market and instrument without adjusting for context.
Drawing a firm conclusion from this one metric alone, rather than treating it as one input among several.
Risks Before You Use This in Real Trading
This metric can be misread in more than one direction, and misreading it carries real cost. A high reading can come paired with significant leverage, and a crowded, leveraged market can produce sharp, fast liquidations once it turns. Data can differ across exchanges, since not every venue reports or calculates it identically. Price movement ultimately depends on far more than this one number, liquidity, news, and broader sentiment all play a role too.
Risk Disclaimer:Trading involves significant risk of capital loss. This article is for educational purposes only and does not constitute financial advice. Always conduct independent research and consider your risk tolerance before making any trading decisions.
See more:Glossary