Measure Gearing Ratio to See How Much of a Company Is Built on Debt
Every company uses some combination of its own money and borrowed money to operate. The ratio between the two reveals how much of the business is financed by debt versus shareholders equity. That ratio is called the gearing ratio, and it is one of the most widely used measures of financial health in fundamental analysis. For traders, the concept matters beyond corporate balance sheets. The relationship between debt and equity in a company is structurally parallel to the relationship between margin and capital in a leveraged trading account. Understanding one illuminates the other.

What Is Gearing Ratio
The gearing ratio measures the proportion of a company's capital structure that is funded by debt relative to shareholder equity. A company with high gearing has borrowed heavily relative to its own company equity. A company with low gearing is funded primarily by its owners' capital and retained earnings.
The ratio is expressed as a percentage or a decimal. A gearing ratio of 60% means that for every dollar of equity, the company carries roughly $1.50 in debt. The higher the number, the more the company depends on borrowed capital to fund its operations and growth.
The Gearing Ratio Formula
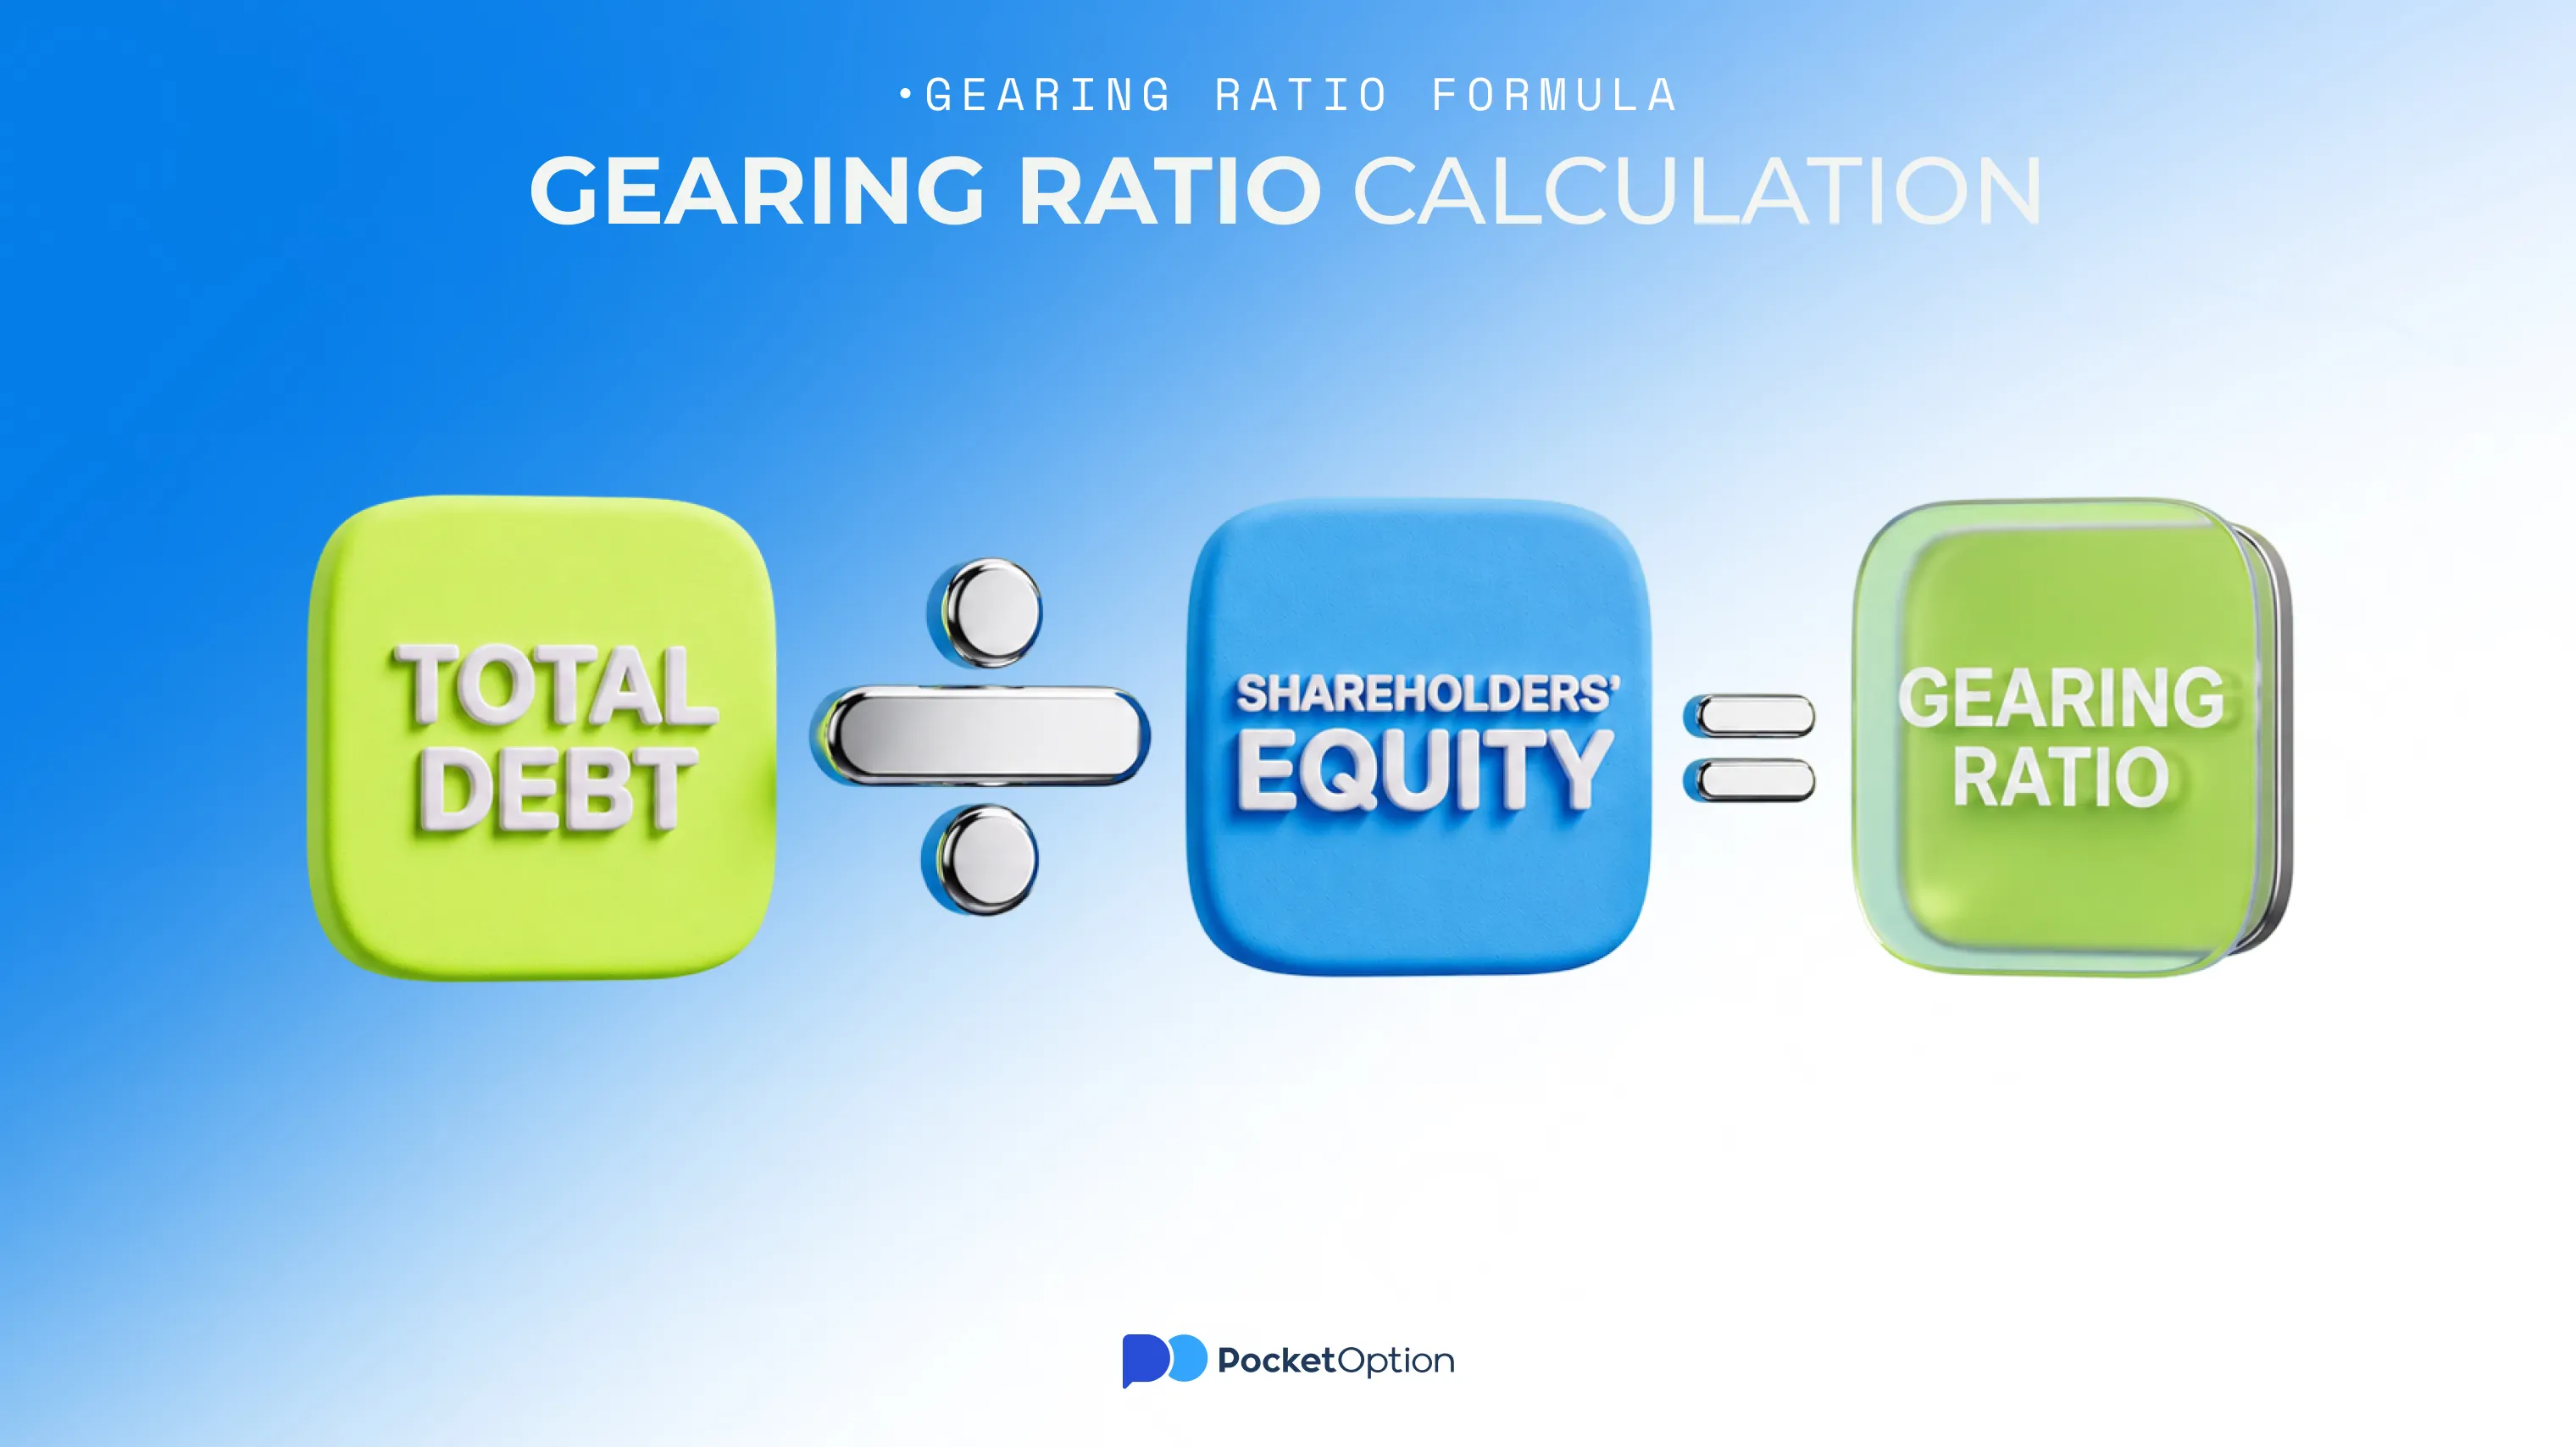
The most common version of the gearing ratio formula is:
Gearing Ratio = Total Debt / Shareholders' Equity
Where total debt includes both long-term borrowings and short-term obligations, and shareholders equity is the residual interest in the company's equity assets after all liabilities are deducted. The equity formula for this purpose is: total assets minus total liabilities equals shareholder equity.
An alternative formulation uses debt as a proportion of total capital: Debt / (Debt + Equity). Both versions convey the same underlying information; the choice depends on the convention used in the industry or region being analysed.
How to Interpret a High vs Low Gearing Ratio
High gearing (above 50%) means debt forms a significant part of the capital structure. The company is more sensitive to interest rates and faces greater financial stress during downturns. Profitability is amplified in good times but so are losses in bad times.
Low gearing (below 25%) means the company is funded primarily by equity. Financial flexibility is higher and the business is more resilient during contraction. Growth may be slower because less capital is deployed.
There is no universally "correct" ratio. Capital-intensive industries (utilities, real estate) typically carry higher gearing. Technology and service businesses tend to operate with lower gearing.
Why Investors Check Gearing Before Buying a Stock
The gearing ratio reveals how much of the return on a stock is generated by the company's own capital versus borrowed capital. A company with a 100% return on equity and high gearing may be generating that return primarily through leverage, not through operational excellence. The underlying return on company equity may be far more modest once debt is removed from the picture.
For stock traders on Pocket Option, gearing context matters when trading equity instruments linked to heavily indebted companies. Such companies tend to be more volatile around earnings releases and interest rate decisions.
Company Gearing vs Trader Leverage
The parallel is direct. When a company borrows to invest, it is using financial leverage to amplify returns on share capital. When a trader uses margin to open a position larger than their deposit, they are doing the same thing at the individual level.
A company with 3:1 gearing earns (or loses) three times as much on its equity for every unit of change in the value of its assets.
A trader with 1:100 leverage earns (or loses) one hundred times as much on their deposit for every unit of change in the position's value.
In both cases, leverage amplifies outcomes in both directions. The lesson from corporate finance applies equally to trading: the higher the gearing, the greater the sensitivity to adverse outcomes, and the more important it becomes to manage the downside before it manages you.
Conclusion
The gearing ratio formula is simple: debt divided by shareholders equity. But what it reveals is fundamental: how much of a company's structure depends on borrowed capital, how sensitive the business is to interest rates and economic cycles, and how the concept of leverage at the corporate level mirrors the leverage used by individual traders.
Understanding gearing is not just an accounting exercise. It is a lens through which the risk embedded in any leveraged structure, corporate or personal, can be measured and managed.
with Pocket Option analytical tools
Get StartedRisk Disclaimer:
None of the information in this article constitutes financial or investment advice. Trading involves substantial risk, including the possibility of losing your entire deposit. The gearing ratio is an analytical tool, not a recommendation to buy or sell any security. Assess your financial situation before trading with real funds.
See more:Glossary