What Does the Choppiness Index Tell You?
The choppiness index measures whether a market is behaving more directionally or more sideways, comparing total price movement against net distance traveled. This guide covers the formula, how to read values on its 0 to 100 scale, the common 38.2 and 61.8 reference levels, and its limits.

When the Market Gets Choppy: What CHOP Measures
Row across smooth, calm water and every stroke moves you forward, a straight, visible path from where you started. Row across choppy water and you can paddle just as hard, cover just as much total distance, and still end up practically where you started, tossed back and forth without making real progress. The choppiness index measures something similar in price action, comparing how much total movement happened against how far price actually traveled net.
A high reading on the choppiness index suggests price is doing a lot of moving without going very far, choppy, sideways behavior. A low reading suggests more of that movement translated into actual net progress, a more directional market. Neither reading says which way price is heading. A low value doesn't mean price is rising, and a high value doesn't mean it's falling. CHOP measures character, not direction.
Open a free demo account and get a feel for real price action, using virtual funds
Try Demo AccountCurious how choppy versus trending conditions actually look on a real chart? Reading about the concept only goes so far. Watching price move through both choppy stretches and clean directional runs shows the difference faster than any description can.
Open a demo trading account and get a feel for how differently choppy and trending price action actually looks, with virtual funds and nothing real on the line.
The Choppiness Index Formula, Explained Simply
The choppiness index formula sums up the true range, the distance price actually traveled bar by bar, across a chosen period, then compares that total against the range between the highest high and lowest low over that same period. A large gap between those two numbers means a lot of back-and-forth motion relative to net distance covered, a choppier market. A small gap means most of that movement translated into actual directional progress.
The result gets scaled logarithmically into a 0 to 100 range, which is why the choppiness index formula reads as a single bounded number rather than a raw distance figure. The period used can be changed. A period of 14 shows up as the default in TradingView's implementation specifically, though that's not a fixed rule every version follows. Getting comfortable reading true range and price ranges directly on a chart, through your Pocket Option login account, makes the logic click faster than working through the formula on paper alone.
How to Read the CHOP Indicator
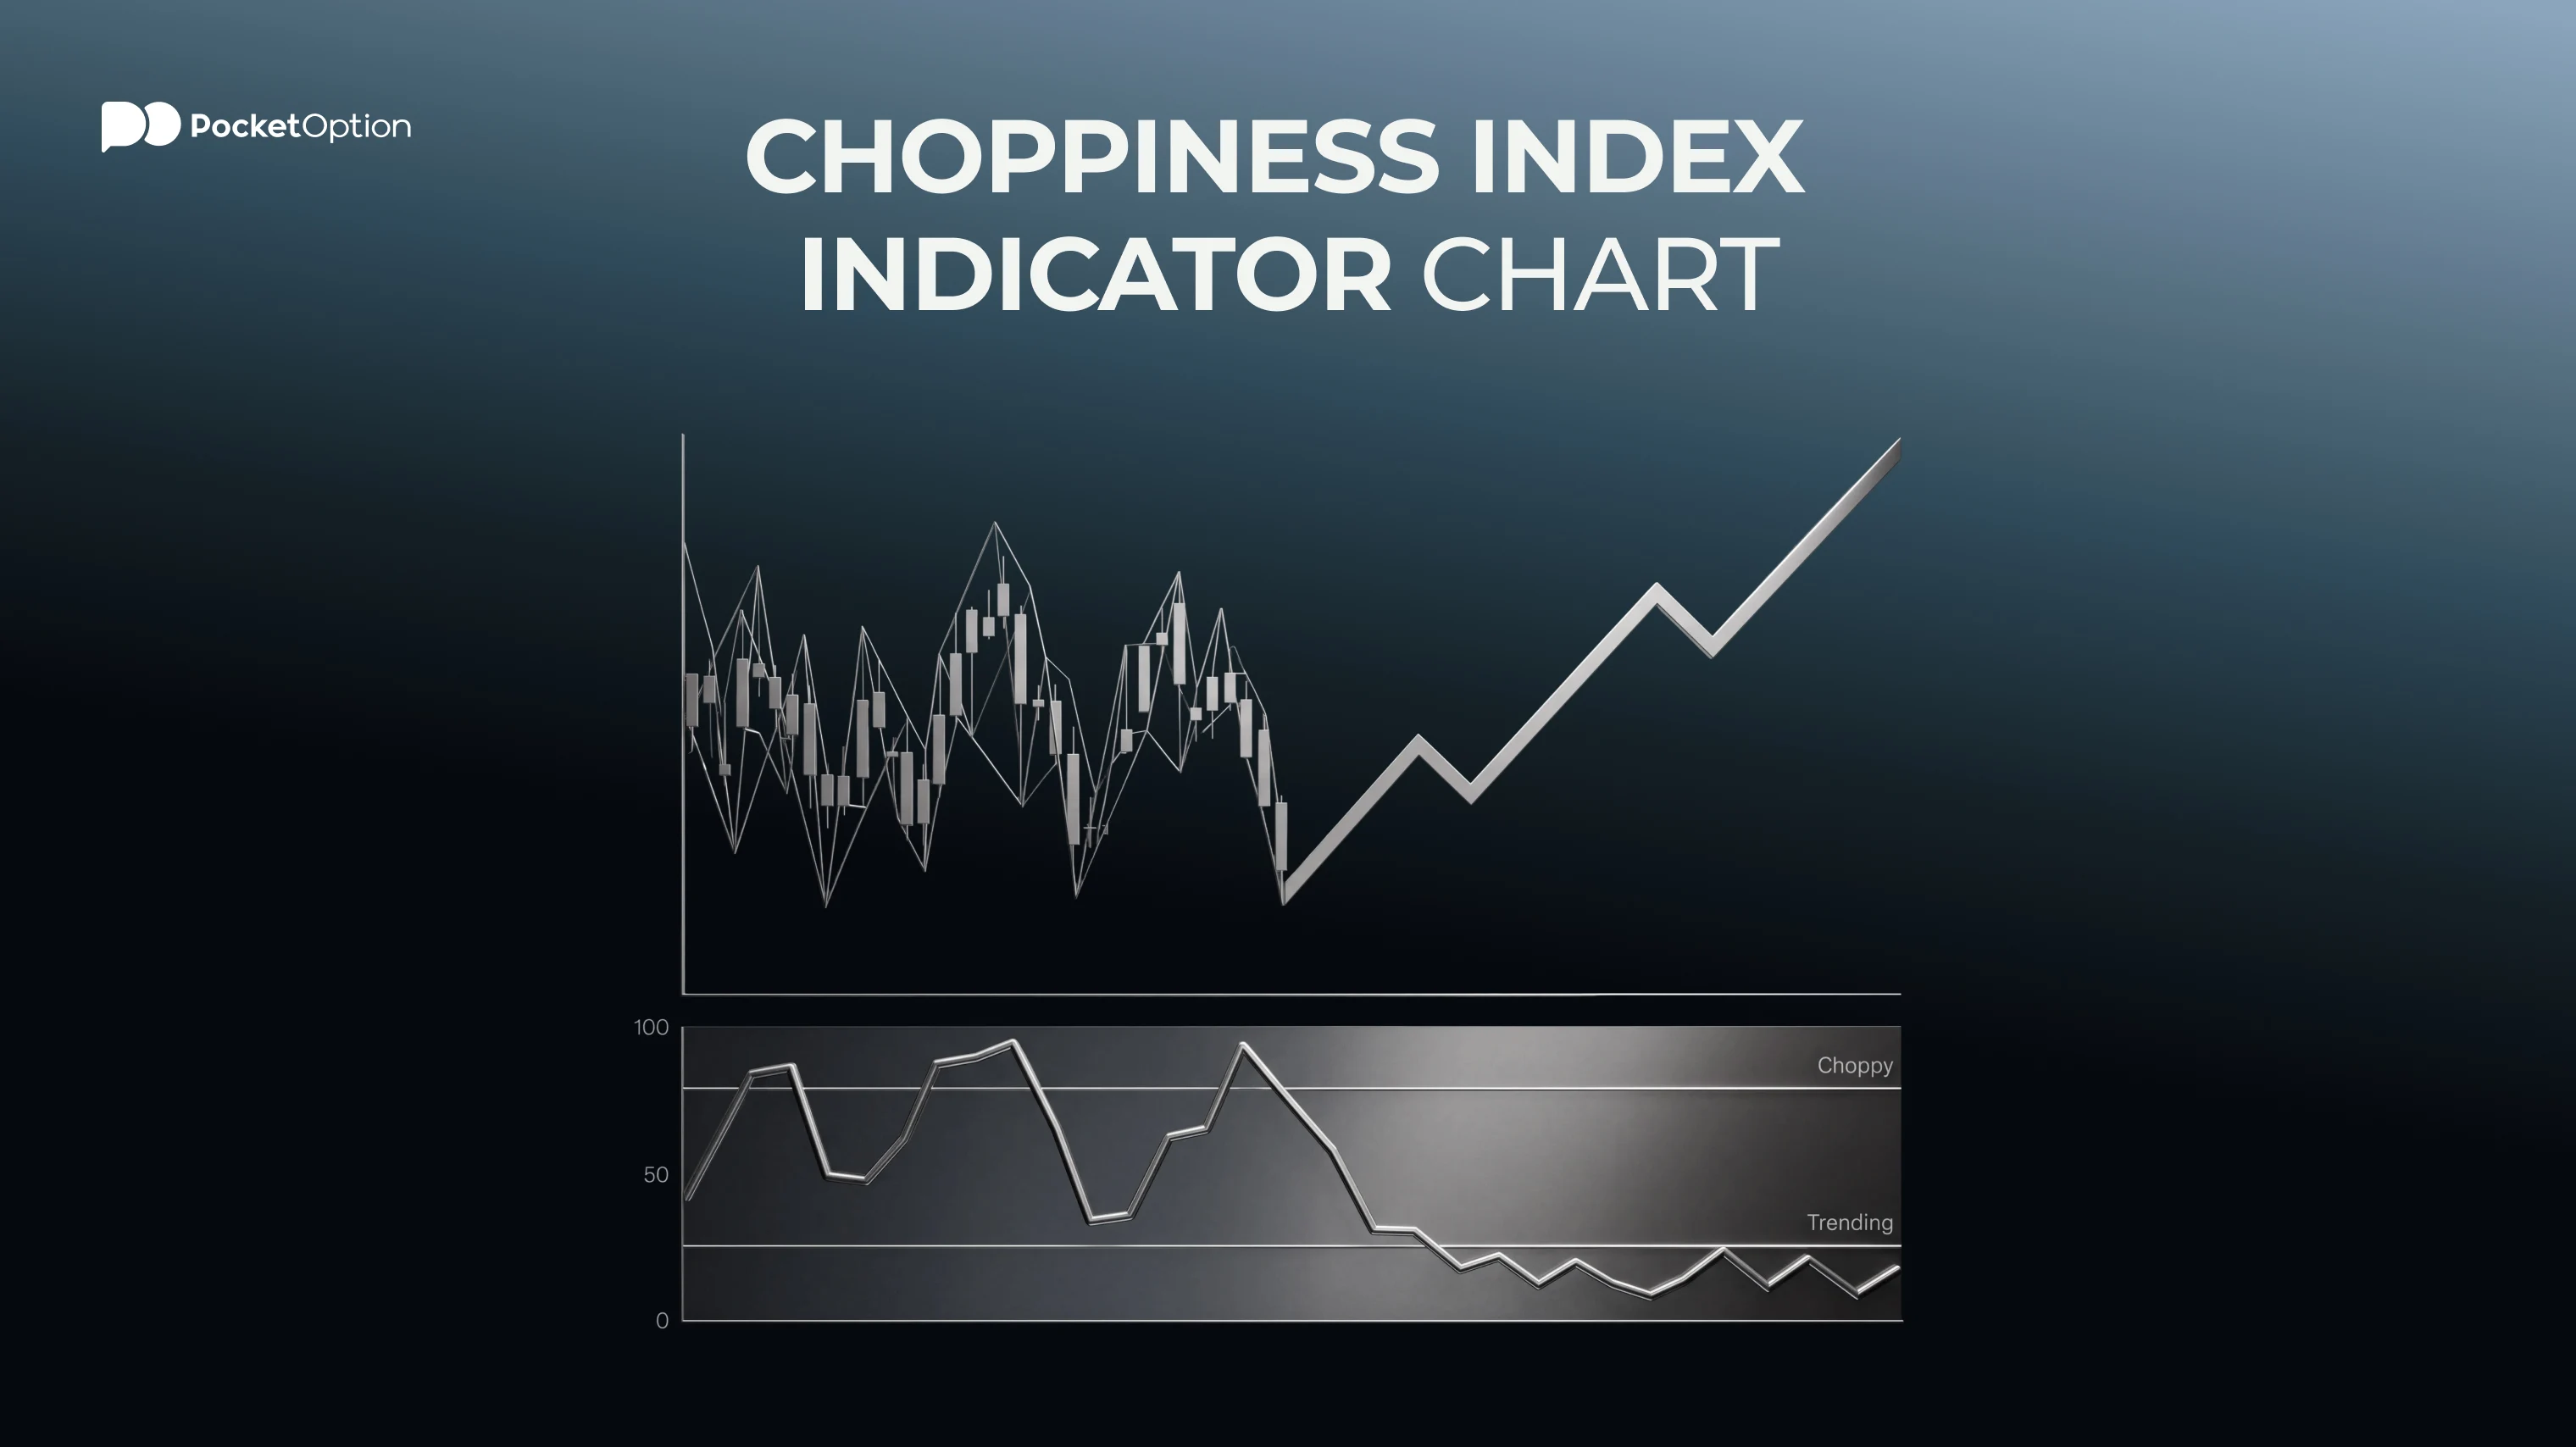
Reading the choppiness index indicator comes down to where the number falls in its 0 to 100 range. Higher values point toward choppier, more sideways conditions. Lower values point toward a more directional, trending market. Neither end says anything about which direction that trend or chop is leaning.
CHOP Reading | What It Suggests | What It Does Not Tell You |
|---|---|---|
Near 0 | A more directional, trending market | Which direction the trend is heading |
Around 50 | A mixed or transitional character | Whether it is shifting toward trend or toward chop |
Near 100 | A choppier, more sideways market | When that condition might change |
Why 38.2 and 61.8 Matter
Two levels, 38.2 and 61.8, come up often when discussing the chop indicator. Readings near 61.8 commonly point toward more choppy, sideways conditions. Readings near 38.2 commonly point toward a more trending market. Both function as common reference points built into how people generally read the chop indicator, not as fixed signals for entering, exiting, or calling a reversal.
When CHOP Can Give the Wrong Impression
A handful of factors can distort what the choppiness indicator actually shows. The period chosen affects the reading directly, and different assets or timeframes can behave differently under the same settings. A short burst of volatility can shift the number without reflecting any real change in the broader character of the market. Transitional stretches, where price shifts between trending and ranging, can also produce readings that don't cleanly match either state. CHOP assesses the character of recent price movement. It doesn't forecast where that character goes next, and it doesn't guarantee a current trending or choppy phase continues.
Risk Disclaimer: Trading involves significant risk of capital loss. This article is for educational purposes only and does not constitute financial advice. Always conduct independent research and consider your risk tolerance before making any trading decisions.
ดูเพิ่มเติม:Glossary