
What Does Chaikin Money Flow (CMF) Tell You?
Chaikin money flow measures buying and selling pressure by combining where price closes within its high-low range with volume. This guide covers the formula, positive and negative readings, divergence, and how CMF differs from the Money Flow Index.

Where Price and Volume Meet: What CMF Measures
Picture a tug of war where the rope's final position gets marked at the end of each round, closer to one side's end zone or the other, and everyone can see how many people showed up to pull that round too. Chaikin money flow tracks something similar in price action: where a bar actually closes within its own high-low range acts like the rope's final position, buyers or sellers winning that particular stretch, and the volume behind that close reflects how many participants actually leaned into the pull.
A close near the high of the range, on strong volume, suggests buyers had the upper hand for that period. A close near the low, on strong volume, suggests sellers did. Chaikin money flow adds this up over a chosen stretch to gauge overall buying or selling pressure. It doesn't forecast where price actually goes next. It reads pressure, not the future.
Open a free demo account and get a feel for real price action, using virtual funds.
Try Demo AccountCurious how buying and selling pressure actually shows up on a live chart? Reading about the concept only goes so far. Watching where price closes within its range, bar after bar, shows the pattern faster than any description can.
Open a demo trading account and get a feel for how pressure builds and fades in real time, with virtual funds and nothing real on the line.
How the Chaikin Money Flow Formula Works
The chaikin money flow formula runs through a few steps. First, the Money Flow Multiplier: take where the close landed relative to the high and low of that period, expressed as a number between -1 and 1. A close right at the high produces a multiplier near 1. A close right at the low produces a multiplier near -1.
Multiply that by volume to get Money Flow Volume, then sum it over a chosen number of periods and divide by the summed volume over that same stretch. That final division is what the chaikin money flow formula actually outputs. A 20 or 21 period stretch shows up often as a common setting, though that's not a fixed rule every version follows. Watching this play out directly through your Pocket Option login account makes the logic click faster than working through it on paper.
What Positive and Negative CMF Really Mean
A positive reading on the chaikin money flow indicator generally lines up with more buying pressure. A negative reading lines up with more selling pressure. The zero line marks the boundary between the two.
Crossing that zero line signals a shift in which side has the edge, buyers or sellers. It doesn't function as a guaranteed reversal signal or a standalone buy or sell trigger. The chaikin money flow indicator flags a change in balance, not a confirmed turning point.
When Price and CMF Stop Moving Together
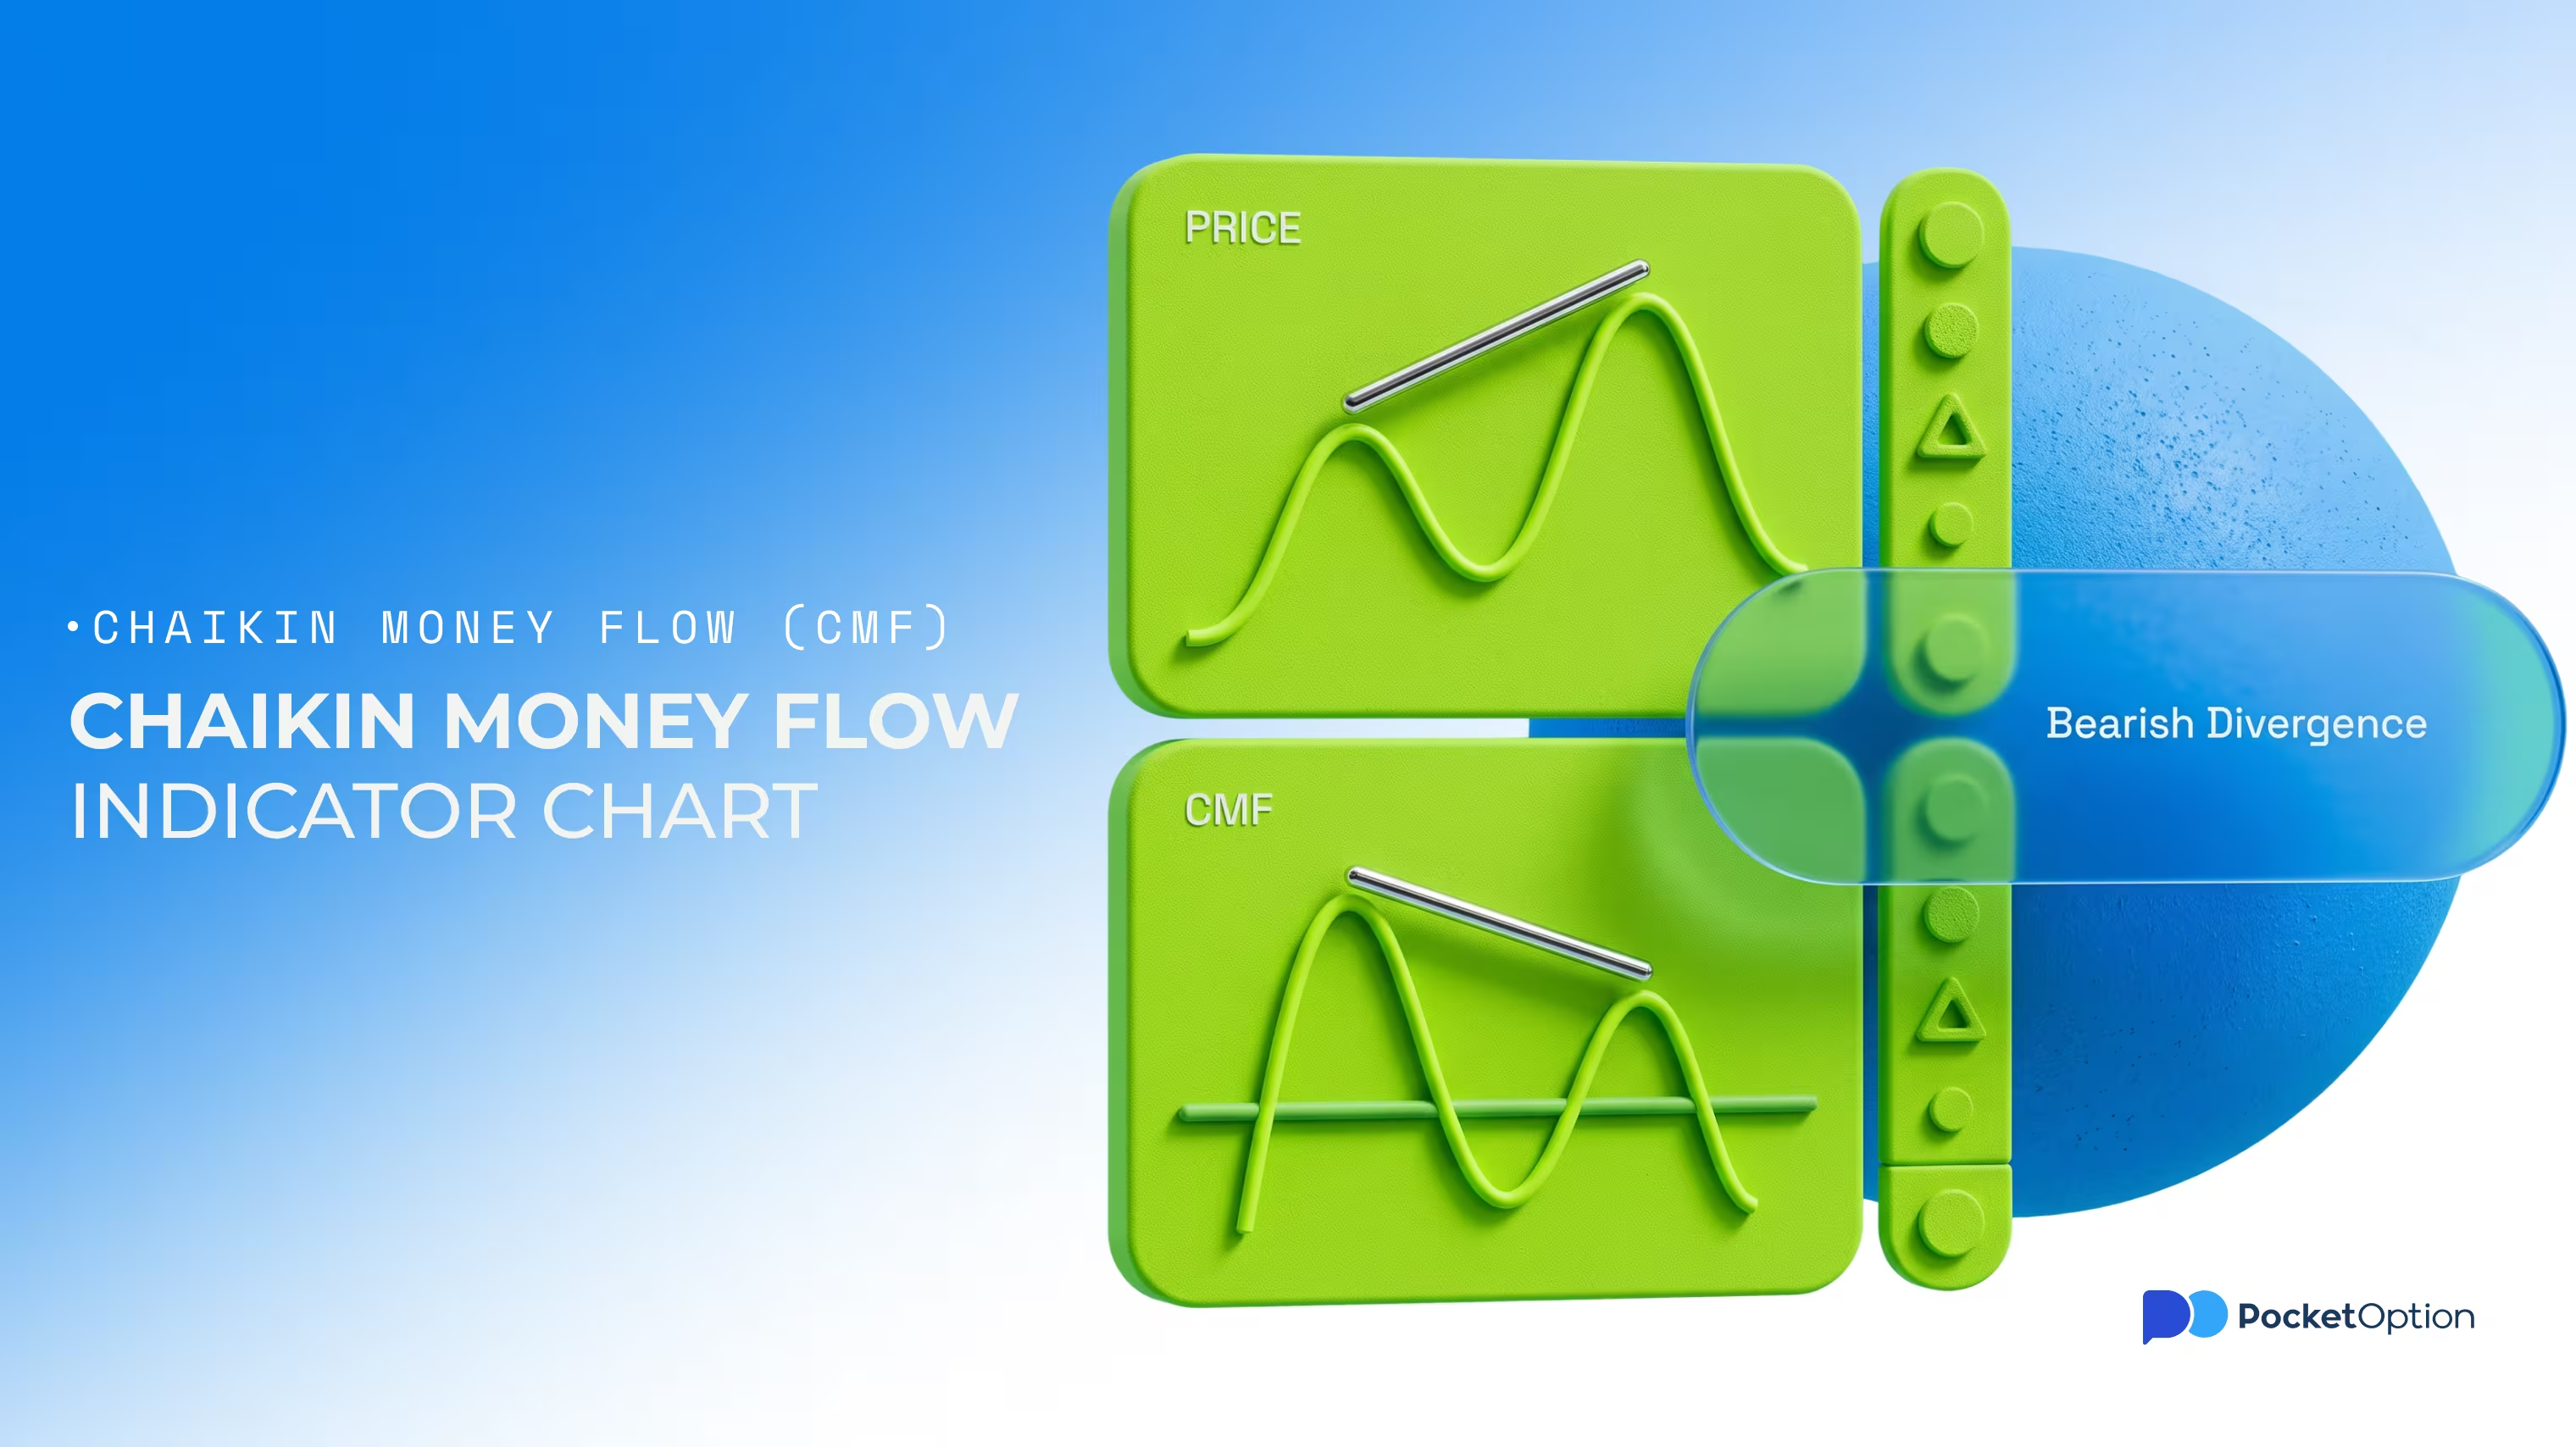
Divergence shows up when price and the cmf indicator move in different directions, price pushing to a new high while the indicator fails to confirm with a matching high, or the reverse. That gap between price and pressure is worth noticing. Treating a bullish or bearish divergence as its own standalone trade trigger goes further than the signal supports.
CMF and MFI Sound Similar - but Work Differently
Confusing CMF with the Money Flow Index is common, given the similar names. CMF builds on where price closes within its high-low range plus volume, typically moving between -1 and 1. MFI works from Typical Price plus volume, splitting flow into positive and negative components on a 0 to 100 scale instead. Neither replaces the other, and building an entire chaikin money flow strategy around confusing the two is a mistake worth avoiding.
Feature | CMF | MFI |
|---|---|---|
What It Uses | Close position within High-Low range, plus volume | Typical Price, plus volume |
Typical Range | Roughly -1 to 1 | 0 to 100 |
Positive and Negative | Reads as buying versus selling pressure | Splits flow into positive and negative components |
When CMF Can Give the Wrong Impression
A handful of factors can distort what CMF shows. The period chosen affects the reading. Differences in how volume data gets reported can shift results across sources. Sharp price gaps expose a known limitation baked into the formula itself: the Money Flow Multiplier doesn't account for a change in trading range between periods, so a gap can leave CMF and price telling different stories. None of this makes the indicator wrong, just worth reading with its limitations in mind.
Risk Disclaimer: Trading involves significant risk of capital loss. This article is for educational purposes only and does not constitute financial advice. Always conduct independent research and consider your risk tolerance before making any trading decisions.
Zobacz więcej:Glossary