
How Do Aroon Up, Aroon Down, and the Oscillator Work?
The aroon indicator uses two lines, Aroon Up and Aroon Down, to show how recently price hit a high or a low over a chosen period. This guide covers the formulas, how to read line crossovers, the Aroon Oscillator, and the indicator's limits.

Aroon Up and Down: Which Side Is Leading?
Picture two signs at a factory, one counting days since the highest output record, another counting days since the lowest. A recent record on either sign means something changed lately. An old record sitting untouched for a long stretch means things have settled into a routine. The aroon indicator runs on that same idea with price, tracking how recently a high or a low actually happened within a chosen stretch, rather than just whether one happened.
Two lines make up the aroon indicator. Aroon Up tracks how recently price hit its highest point over the chosen period. Aroon Down tracks how recently price hit its lowest point over that same stretch. Both move within a 0 to 100 range. A reading close to 100 means that extreme happened very recently. A reading close to 0 means it's been a while, and that's the whole idea behind the aroon indicator: recency of price extremes, not their size.
Open a free demo account and get a feel for real price action, using virtual funds.
Try Demo AccountCurious how Aroon Up and Aroon Down actually move alongside a real chart? Reading about the concept only goes so far. Watching both lines react as new highs and lows form shows the pattern faster than any description can.
Open a demo trading account and get a feel for how these lines behave in real time, with virtual funds and nothing real on the line.
Inside the Aroon Formula: Why Recent Highs and Lows Matter
The aroon indicator formula for each line follows the same basic shape: take the chosen period, subtract how many bars have passed since the relevant high or low, divide by that period, then multiply by 100. Aroon Up uses periods since the highest high. Aroon Down uses periods since the lowest low.
Fewer bars since that extreme pushes the result higher, since less has been subtracted from the period. More bars since that extreme pushes it lower. The exact lookback period behind the aroon indicator formula can be adjusted, and no single setting works as the universally correct choice for every market or timeframe. Watching this play out directly through your Pocket Option login account makes the logic click faster than working through it on paper.
What Happens When the Aroon Lines Cross?
Reading the aroon up and down indicator together comes down to comparing which line currently sits higher. A higher Aroon Up points to a more recent high. A higher Aroon Down points to a more recent low. Values sitting near 100 suggest a fresh extreme on that side, while values hovering near 50 suggest more time has passed since either extreme stood out. A crossover, one line moving above the other, shows a shift in which side has been more recently active. It doesn't function as an automatic buy or sell signal or a guaranteed reversal on its own.
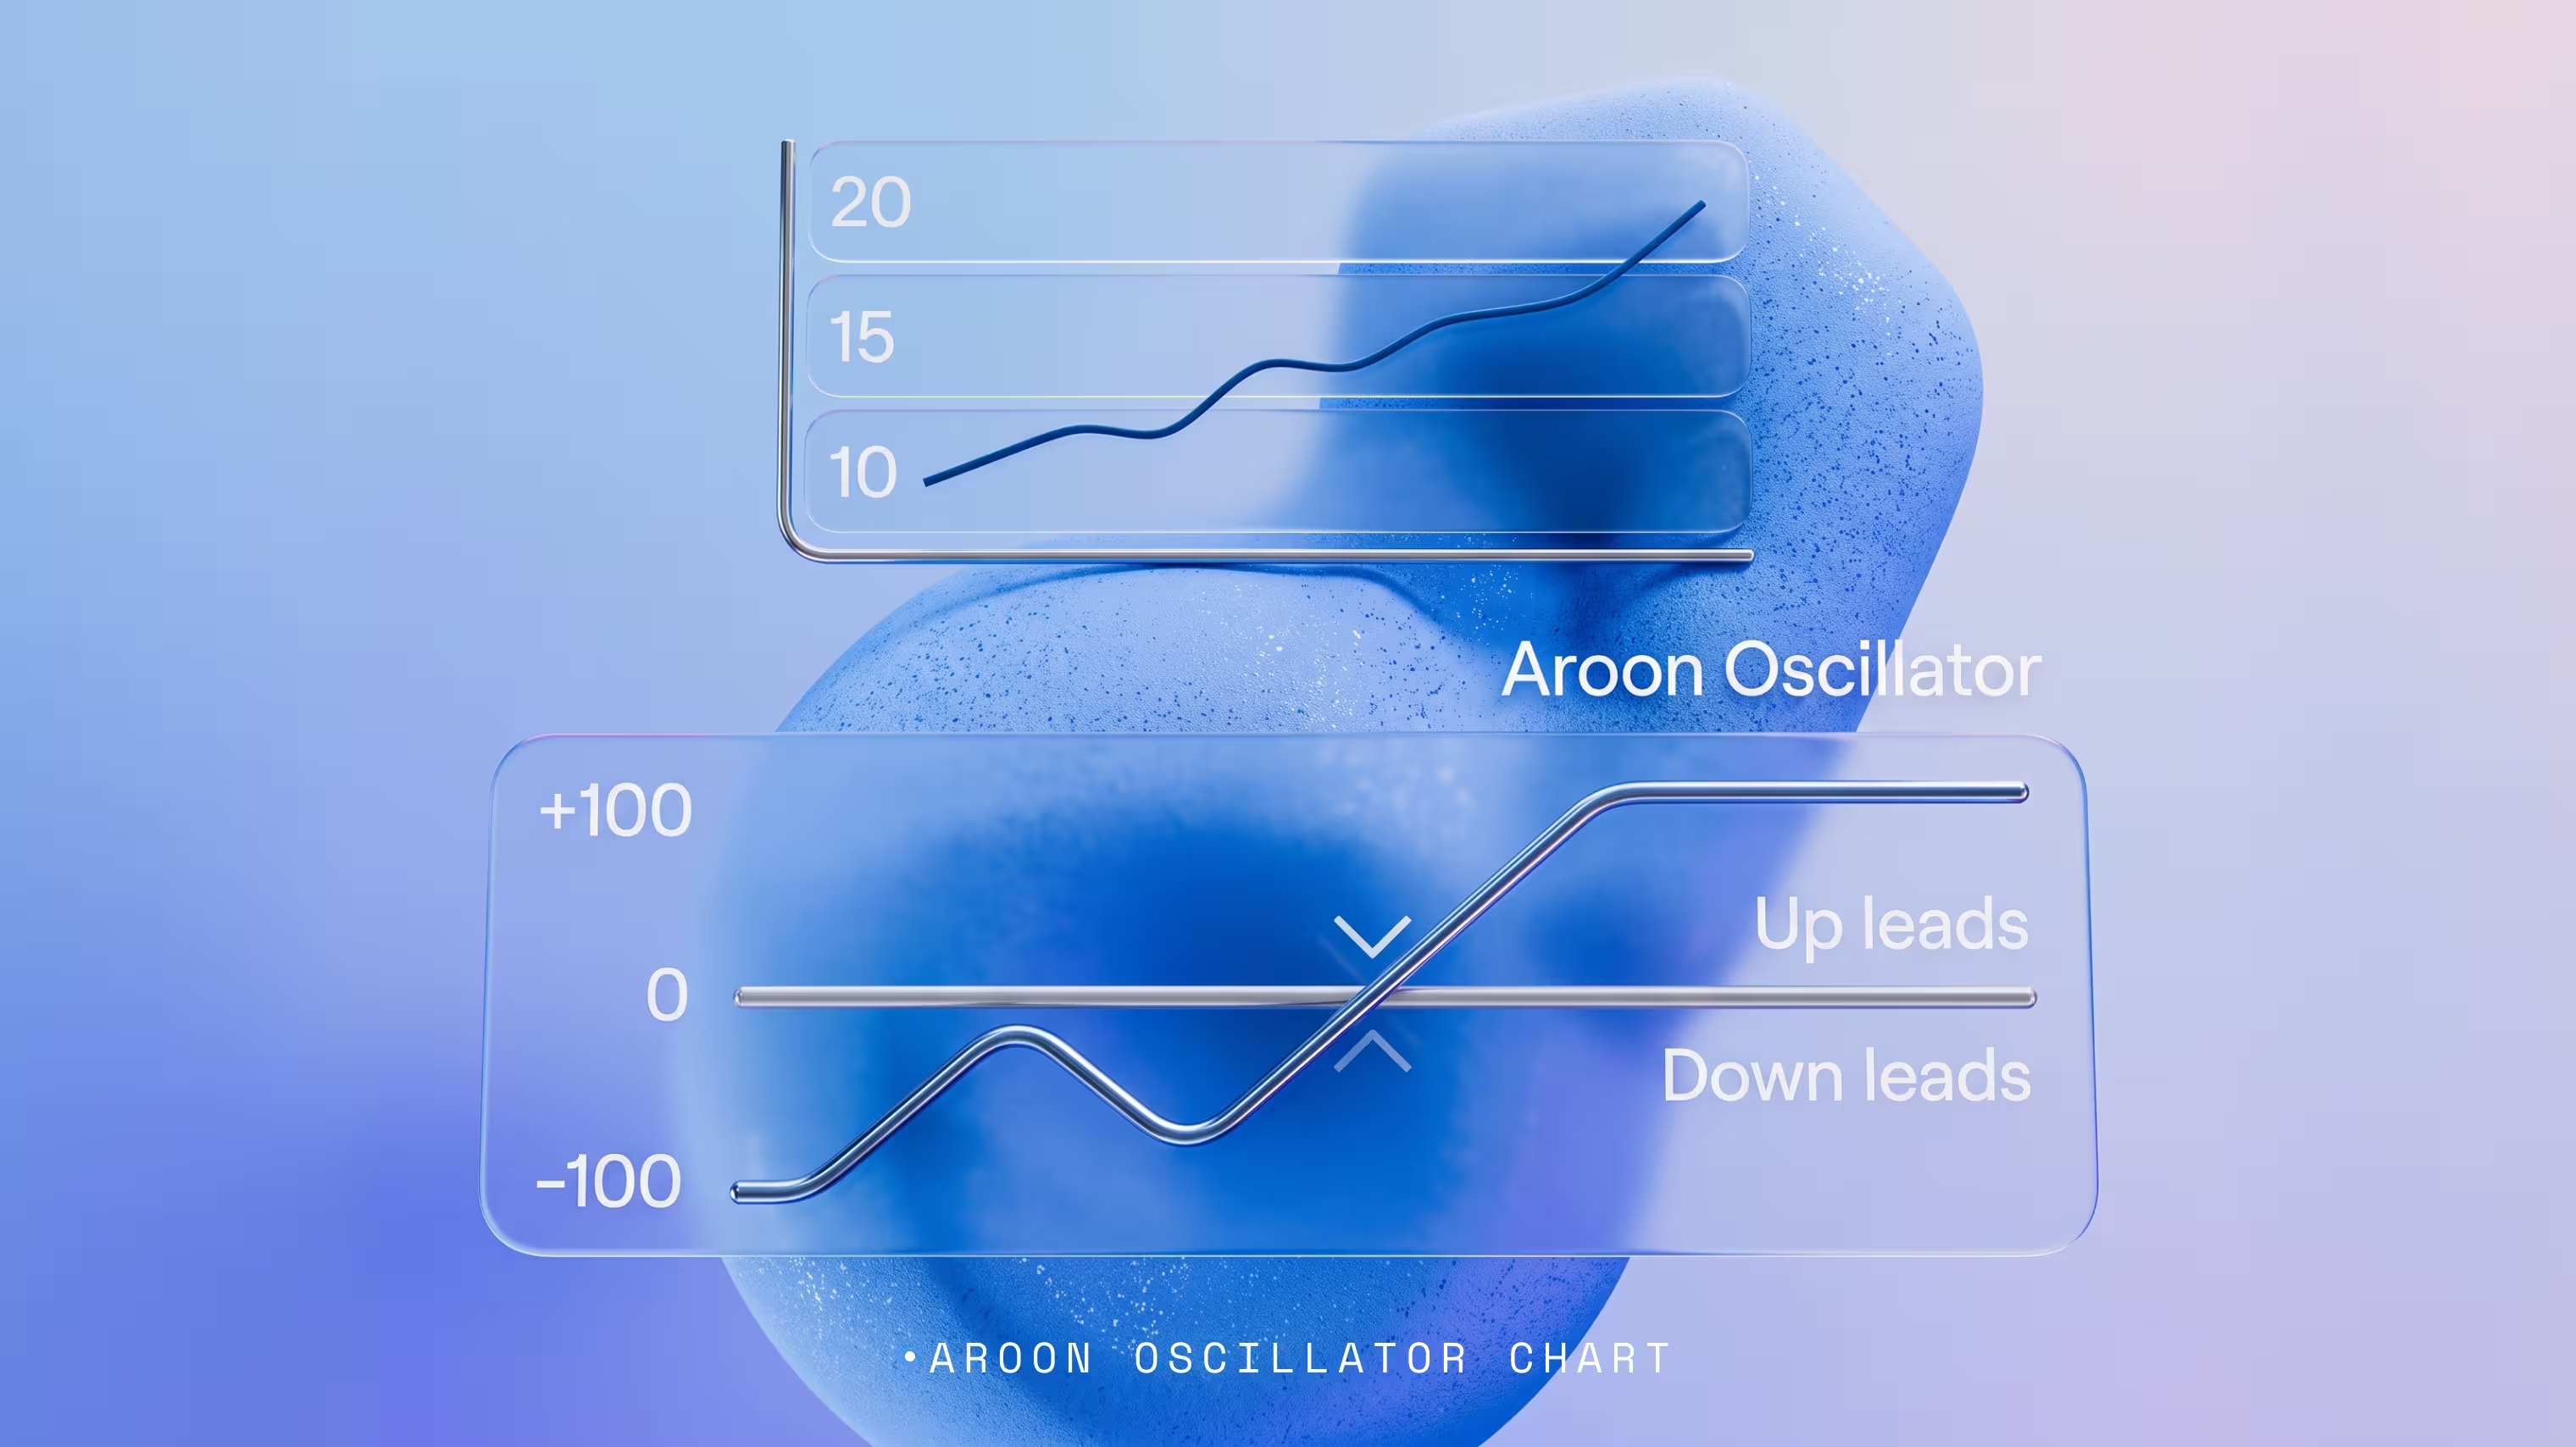
From Two Lines to One: Meet the Aroon Oscillator
The aroon oscillator takes those same two lines and turns them into a single number: Aroon Up minus Aroon Down. That subtraction produces a range from -100 to +100 instead of two separate 0 to 100 lines running side by side.
A positive aroon oscillator reading means Aroon Up currently sits above Aroon Down, a more recent high than low. A negative reading means the reverse. Readings near zero mean the two lines sit close together, with neither extreme standing out as noticeably more recent. No specific value on its own guarantees which way price actually moves next.
When Aroon Can Give the Wrong Impression
A handful of factors limit what Aroon actually tells you. The period chosen affects sensitivity directly, a shorter period reacts faster but produces more frequent crossovers in unstable conditions. A brand new high or low doesn't automatically mean a trend is actually taking hold, sometimes it's just noise. Building an entire aroon indicator strategy around crossovers alone skips past this context. Aroon measures how recently price extremes happened. It doesn't forecast whether that recency turns into anything lasting.
Risk Disclaimer: Trading involves significant risk of capital loss. This article is for educational purposes only and does not constitute financial advice. Always conduct independent research and consider your risk tolerance before making any trading decisions.
See more:Glossary