What Is Market Breadth and How Do Breadth Indicators Work?
Market breadth measures how many individual stocks are actually participating in an index move, not just the headline number itself. This guide covers the main breadth indicators, confirmation, divergence, and how to read breadth without overreading it.

Market Breadth: What the Index Alone Can Miss
A hiking group's average position on a trail can look like solid progress even when it's really just two fast hikers pulling far ahead while most of the group stalled out, or turned back entirely. The average moves. The group, as a whole, might not. Market breadth applies that same check to a stock index. It looks past the single headline number and asks how many individual stocks are actually participating in whatever move that number describes.
Broad participation means a large share of stocks are moving in the same direction as the index. Narrow participation means a smaller group, often a handful of large names, is doing most of the work while the rest sit still or drift the other way. The exact same index move, five points up, say, can come from either situation, and market breadth is what actually tells them apart.
None of this settles the question of what happens next on its own. Wide or narrow, market breadth alone doesn't guarantee the move continues or reverses. It's a read on current participation, not a forecast, and treating market breadth as anything more than that overstates what the number can actually tell you.
Open a free demo account and get a feel for real price action, using virtual funds
Try Demo AccountCurious how index moves and individual stock participation actually diverge on a live chart? Reading about the concept only goes so far. Watching how broadly or narrowly a move is actually supported shows the pattern faster than any description can.
Open a demo trading account and get a feel for how price action actually behaves, with virtual funds and nothing real on the line.
How Market Breadth Indicators Measure Participation
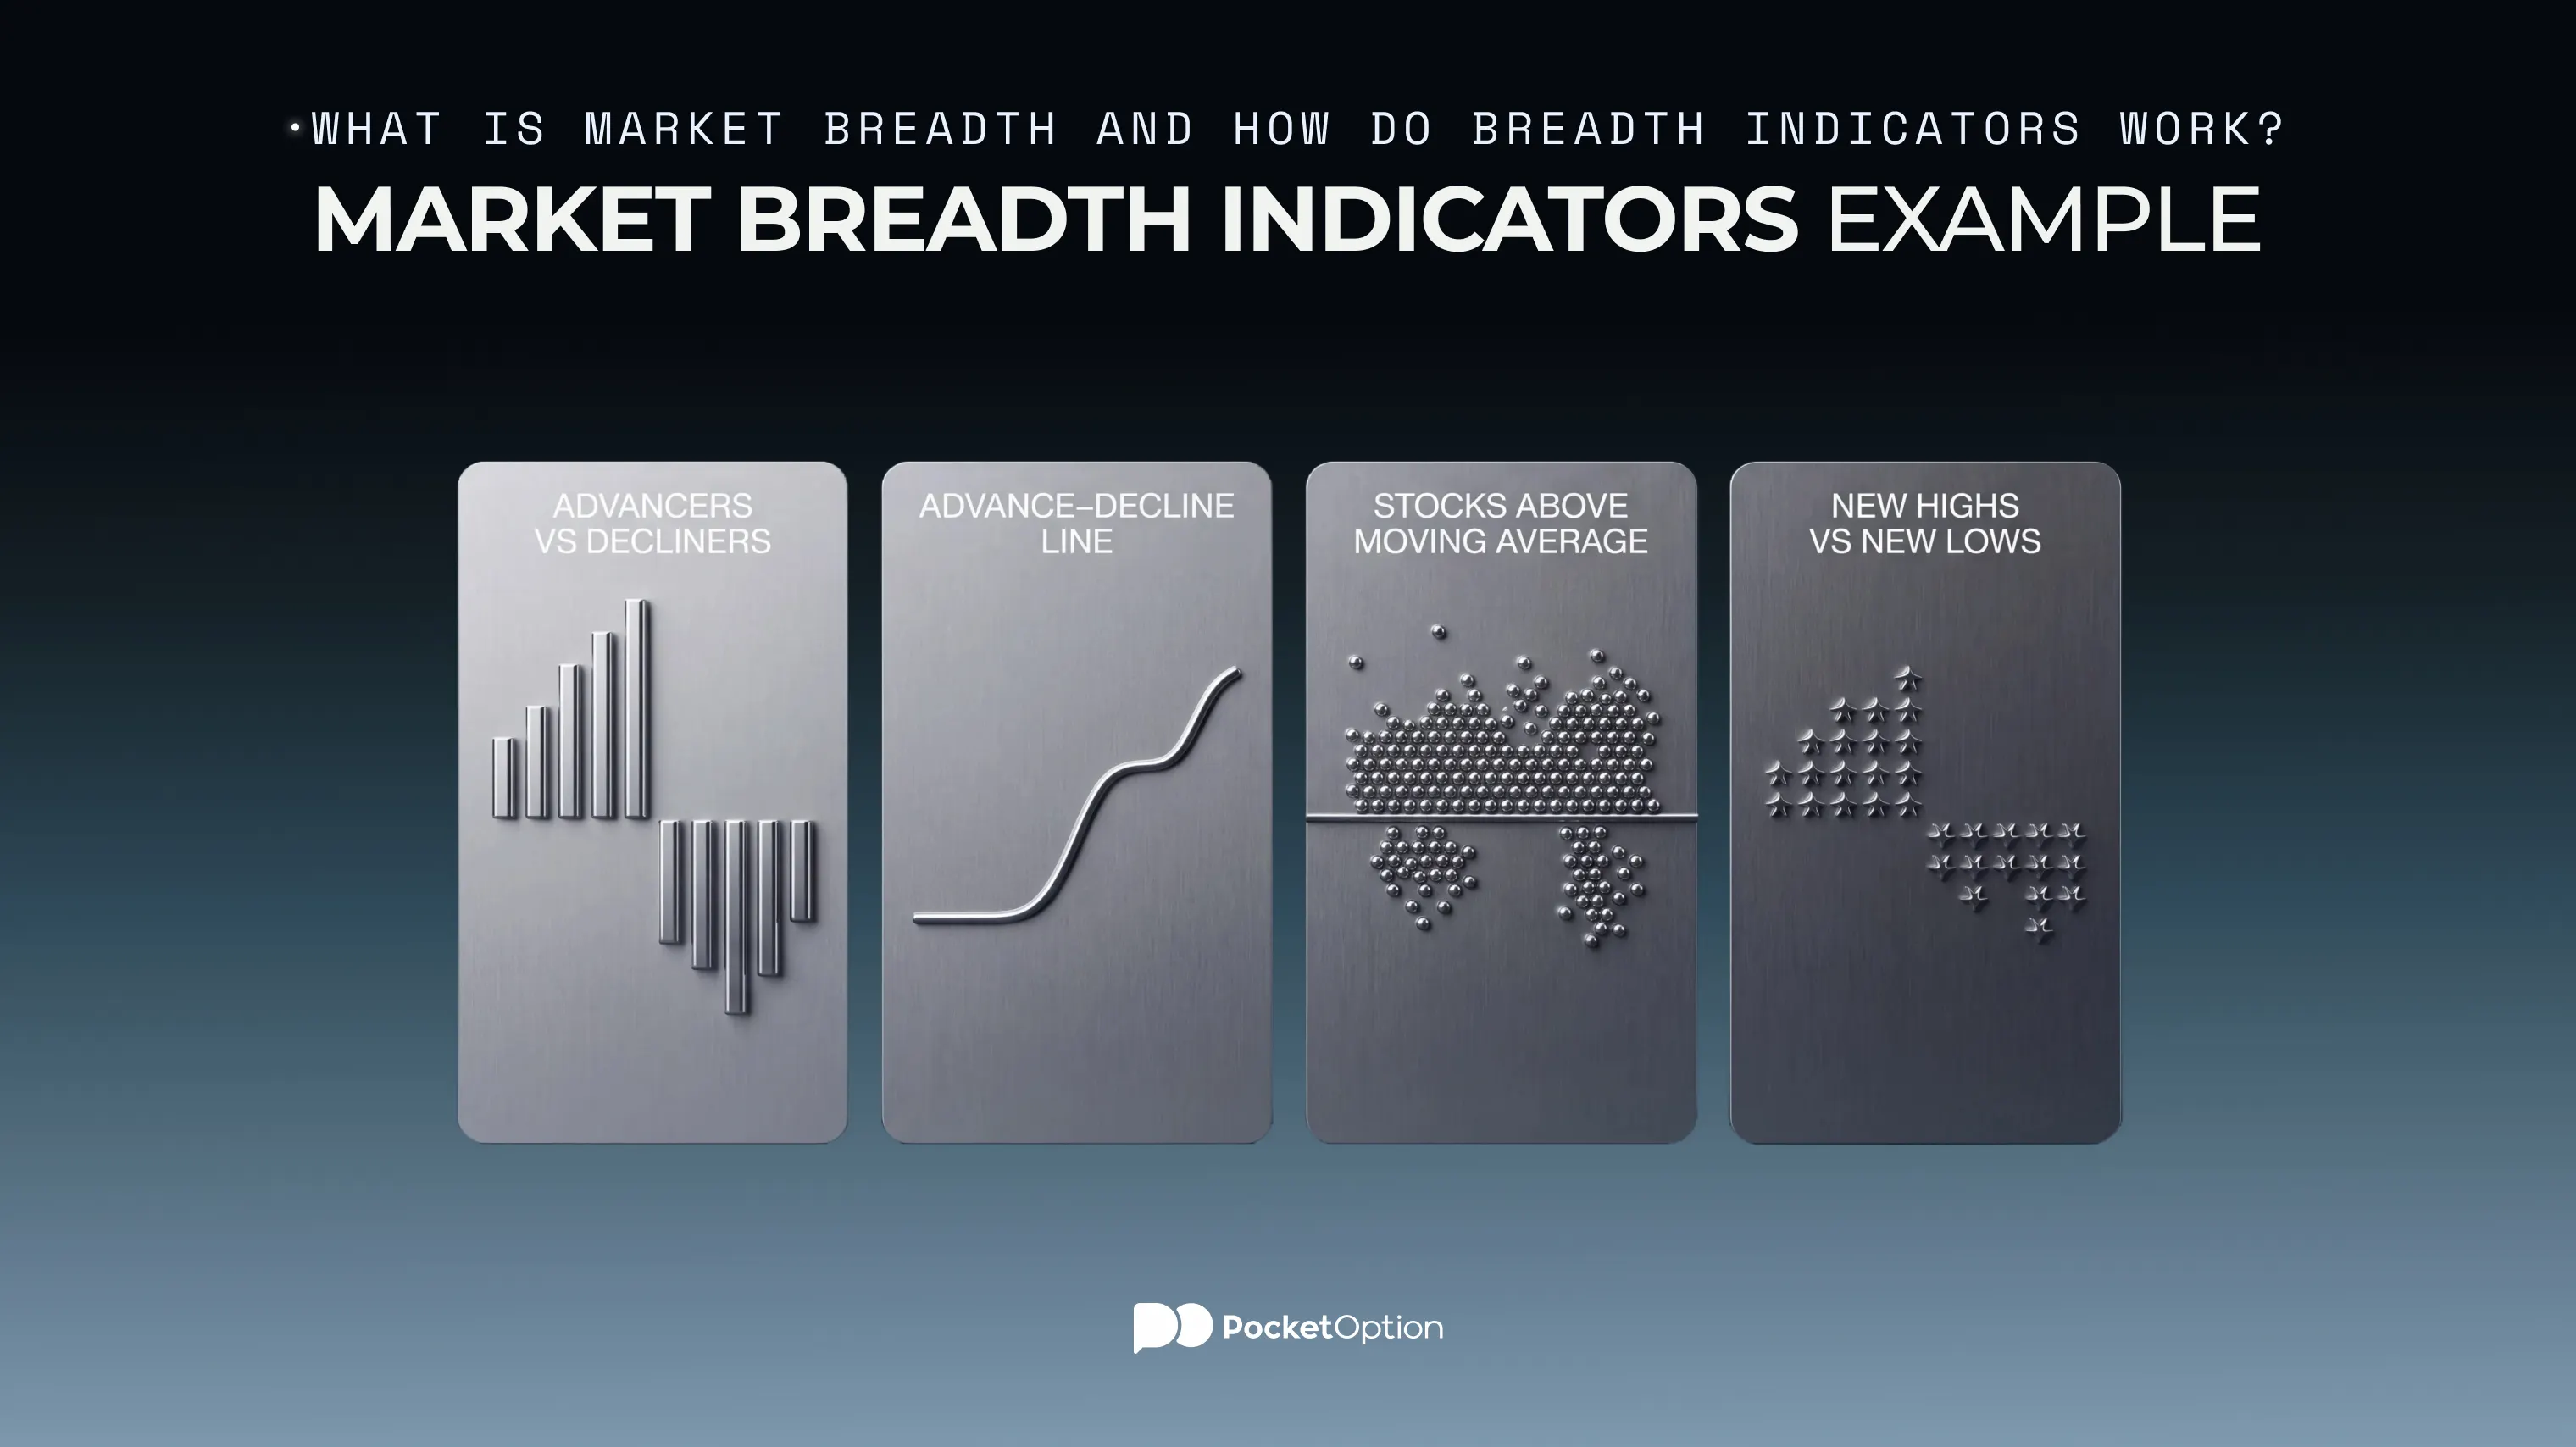
Different market breadth indicators approach the same underlying question, how many stocks are actually participating, from different angles. A handful of common ones show up constantly: advancing versus declining stocks, the Advance-Decline Line, the share of stocks trading above a chosen moving average, and new highs versus new lows.
Each of these market breadth indicators looks at participation through a slightly different lens, which means their readings don't always line up cleanly with each other. That's expected, not a flaw, and it's exactly why comparing multiple market breadth indicators side by side tends to say more than reading just one in isolation. Checking your own trading setup directly through your Pocket Option login account, alongside whichever breadth reading you're looking at, keeps the picture grounded in what's actually in front of you rather than an abstract description.
Advancing vs Declining Stocks: The Simplest Breadth Check
The most basic answer to what is market breadth starts right here: simply counting how many stocks rose today against how many fell. More advancers than decliners suggests wider participation on the up side. The reverse suggests the opposite.
The Advance-Decline Line takes that daily count and accumulates it over time, running total style, adding each day's advancer-decliner difference to the day before. Rising steadily alongside the index suggests broad support. Flattening or falling while the index climbs is the kind of gap worth noticing. Understanding what is market breadth through this specific lens is really just tracking that running difference over time.
Stocks Above Moving Averages and New Highs vs New Lows
Two more common ways to read stock market breadth: the share of stocks trading above a chosen moving average, and the count of new highs against new lows. Fifty-day and two-hundred-day moving averages show up often as reference periods, though no fixed percentage above either one automatically marks a market as strong, weak, overbought, or oversold.
New highs versus new lows works similarly: more names hitting fresh highs points toward broader strength, more hitting fresh lows points the other way. Reading stock market breadth through either lens still comes back to the same core question. How many stocks are actually along for the ride?
Stock Market Breadth: When Participation and the Index Disagree
Confirmation happens when the index and breadth move together: the index climbs and participation widens alongside it, or the index falls and participation narrows in step. Divergence happens when they pull apart: the index rises while breadth deteriorates, or the index falls while breadth actually improves. Getting at the real market breadth meaning behind a given move means noticing when this gap opens up. Divergence flags that fewer or more stocks are backing a move than the headline number alone suggests. It doesn't pinpoint when a reversal actually arrives, and it isn't a standalone trading signal.
When a Strong Index Hides Weak Participation
Picture a simple, purely illustrative scenario. A handful of large, heavily-weighted companies climb noticeably, pulling a capitalization-weighted index higher along with them, since their size gives them outsized influence over the headline number. Meanwhile, a meaningful share of the remaining stocks in that same index either sit flat or actually decline. The index looks strong. The participation underneath tells a narrower story. Now flip it: picture the same index gain, but this time hundreds of stocks are climbing alongside those big names, spreading the gain across a much wider base. Same headline number, genuinely different picture underneath. Checking any market breadth indicator alongside the index itself is exactly how that difference actually gets caught, though narrow participation on its own still doesn't guarantee what happens from here.
How to Use Market Breadth Without Overreading It
A handful of things shape how any breadth reading actually looks. Index composition and structure. Differences across sectors, since some sectors naturally run with fewer or more constituent stocks than others. Which specific breadth indicator gets used. The period chosen for the calculation. Different breadth measures can genuinely disagree with each other at the exact same moment, and one extreme reading on its own doesn't automatically flip into a reversal.
Reading breadth alongside the index itself, and alongside whatever else is happening in the broader market, gives a fuller picture than any single breadth number taken in isolation. None of this turns breadth into a trading strategy. There's no fixed threshold that works the same way across every index, sector, or period, since what counts as an extreme reading in one context can look perfectly ordinary in another, and none of this amounts to a ready-made trade condition.
Risk Disclaimer: Trading involves significant risk of capital loss. This article is for educational purposes only and does not constitute financial advice. Always conduct independent research and consider your risk tolerance before making any trading decisions.
See more:Education