- Upper Line: Acts as resistance
- Lower Line: Functions as support
- Channel Width: Indicates volatility range
Trading Channel Pattern: Master Price Action Analysis & Breakout Strategies

In the dynamic world of trading, mastering the trading channel pattern is essential for effective technical analysis. These patterns, formed by two parallel trendlines, provide a structured approach to price action trading by identifying key support resistance levels and potential breakout points. This in-depth guide explores the formation, types, and strategies for trading channel patterns across different market conditions, especially on user-friendly platforms like Pocket Option.
Article navigation
- What Is a Trading Channel Pattern?
- Why Channel Patterns Matter in Forex
- How to Draw and Analyze a Trading Channel Pattern
- On Pocket Option:
- Technical Indicators That Complement Channel Trading
- Breakout Trading Within Channels
- Ascending and Descending Channels: Strategy Breakdown
- Risk Management Within Channel Strategies
- Real-World Application: Pocket Option Example
- Expert Insights and Recommendations
- Conclusion: Channel Patterns for Smart Trading
What Is a Trading Channel Pattern?
A trading channel pattern (also referred to as a price channel) is a visual representation of the market’s price movement between two parallel lines: an upper resistance line and a lower support line. These trendlines define the high and low boundaries of the asset’s price over a specific time frame, offering traders a clear framework for trend channel analysis.
This visual representation enables traders to engage in more precise pattern recognition, aligning trades with trend direction and market momentum.
Understanding the different types of channel patterns is crucial for building effective chart patterns trading strategies. Each type provides distinct trading opportunities, depending on the trend, market sentiment, and volatility phase.
| Channel Type | Trend Direction | Description |
|---|---|---|
| Ascending Channel | Bullish | Features higher highs and higher lows. Indicates strong buying momentum and trend continuation. Traders often look to buy near the lower boundary and take profit near the upper resistance. Excellent for identifying long opportunities in trending markets. |
| Descending Channel | Bearish | Characterized by lower highs and lower lows. Suggests sustained selling pressure and bearish momentum. Often used for shorting opportunities or cautious long entries upon breakout reversals. |
| Horizontal Channel | Neutral | The price oscillates within horizontal support and resistance. This range-bound behavior shows market indecision and is suited for swing or range trading strategies. Traders focus on buying at support and selling at resistance until a confirmed breakout occurs. |
These channels are dynamic and can evolve over time. An ascending channel may transition into a horizontal one before breaking down, and vice versa. Traders should reassess patterns regularly and confirm their validity using indicators or multi-timeframe analysis for precise pattern recognition.
Why Channel Patterns Matter in Forex
In forex trading, channel patterns are invaluable tools for decoding technical analysis patterns. Here’s why they matter:
- Provide insight into trend strength and direction
- Highlight potential reversal or breakout trading zones
- Help define support resistance levels visually
| Benefit | Explanation |
|---|---|
| Improved Entry Timing | Identify pullbacks near support or resistance |
| Defined Risk Boundaries | Use channel width to set stop-loss and take-profit targets |
| Enhanced Strategy Accuracy | Align with indicators like Moving Averages or Donchian Channels |
How to Draw and Analyze a Trading Channel Pattern
Drawing and reading a trading channel pattern accurately is a cornerstone of effective price action trading. Beyond drawing, it’s essential to understand the behavior of price within the channel to capitalize on both trending and ranging conditions.
Step-by-step guide to drawing channel lines:
- Identify the Prevailing Trend: Begin by determining whether the market is trending upward, downward, or sideways. Use higher highs and lows for an uptrend, and lower highs and lows for a downtrend. In a sideways market, price oscillates between static highs and lows.
- Draw the Base Trendline: In an uptrend, draw the trendline along two or more higher lows (swing lows). In a downtrend, draw it along lower highs.
- Clone a Parallel Line: Copy the base trendline and move it to the opposite side of the price action. In an uptrend, this goes above to touch swing highs; in a downtrend, below to touch swing lows. In a horizontal channel, connect multiple highs and lows at similar levels.
How to read channel patterns effectively:
- Support and Resistance Zones: The lower boundary acts as dynamic support, while the upper boundary acts as dynamic resistance. Watch for bounces off these zones for entry opportunities.
- Midline Behavior: Many traders draw a mid-channel line, which often acts as a magnet for price or a pivot level. Price interaction here can suggest strength or weakness of the trend.
- Volume Clues: Rising volume near the boundaries or midline can indicate imminent breakout or rejection.
- Candle Patterns and Wicks: Long wicks rejecting the channel line add weight to the reversal probability, while engulfing candles or break-and-close outside the channel can suggest strong breakouts.
Reading Price Action Inside a Channel
- Look for consistent oscillations: A healthy channel will have rhythmic swings between support and resistance.
- Sudden price acceleration or deceleration within the channel may precede a breakout or trend reversal.
Pro Insight: “A well-formed trading channel is like a roadmap. The clearer it is, the easier it is to follow price logic and plan trades accordingly.” — Marta Korzun, Market Structure Analyst
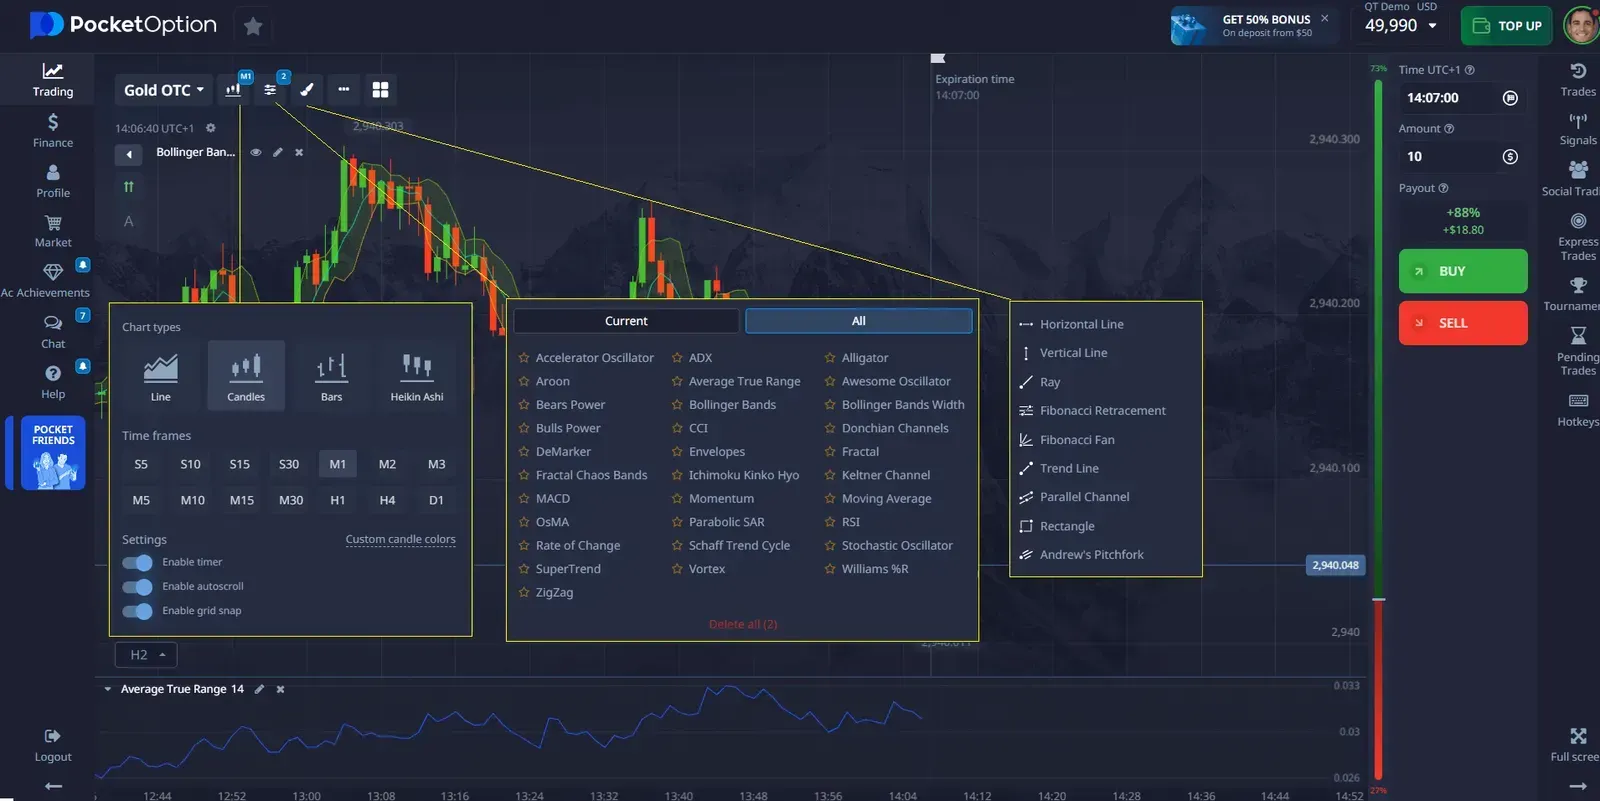
On Pocket Option:
The Pocket Option trading interface features intuitive chart tools. Use the drawing tool to place trendlines and create a channel. For instance:
- Spot a rising trend with repeated pullbacks
- Draw a trendline along swing lows
- Clone and align with highs to form an ascending channel
Technical Indicators That Complement Channel Trading
For accurate trend channel analysis, combine channels with technical indicators:
| Indicator | Role in Channel Trading |
|---|---|
| Moving Average | Confirms trend direction and acts as dynamic support/resistance |
| Donchian Channel | Highlights breakout zones and extremes |
| RSI/Stochastic | Detects overbought/oversold conditions near channel lines |
“A strong channel trading system doesn’t rely on one tool alone. Combine structure with momentum-based indicators for best results.” — Anna Becker, Financial Analyst & Quant Specialist
Breakout Trading Within Channels
Breakout trading strategies revolve around identifying when price escapes the channel:
- Bullish Breakout: Price closes above resistance
- Bearish Breakout: Price falls below support
Confirmation Tools:
- Volume spike
- Indicator alignment (e.g., MA crossover)
Expert Insight: According to FX educator Peter Brandt, “Breakouts from well-defined channels often lead to prolonged directional moves. Patience pays when waiting for confirmation.”
Ascending and Descending Channels: Strategy Breakdown
Ascending Channels:
- Buy near support
- Exit near resistance or upon breakout
Descending Channels:
- Sell near resistance
- Close at support or on confirmed breakdown
Tip: Pocket Option allows you to set alerts for price touching custom trendlines. Stay ahead of potential breakouts!
Risk Management Within Channel Strategies
Prudent risk control enhances the effectiveness of any channel strategy:
- Place stop-loss just beyond the channel boundary
- Adjust position size based on channel width and volatility
- Monitor for false breakouts using multiple timeframe analysis
Pro Tip: “Always calculate risk-reward before entering channel-based trades. A minimum 1:2 ratio helps maintain long-term profitability.” — Lucas Wu, Certified Market Technician (CMT)
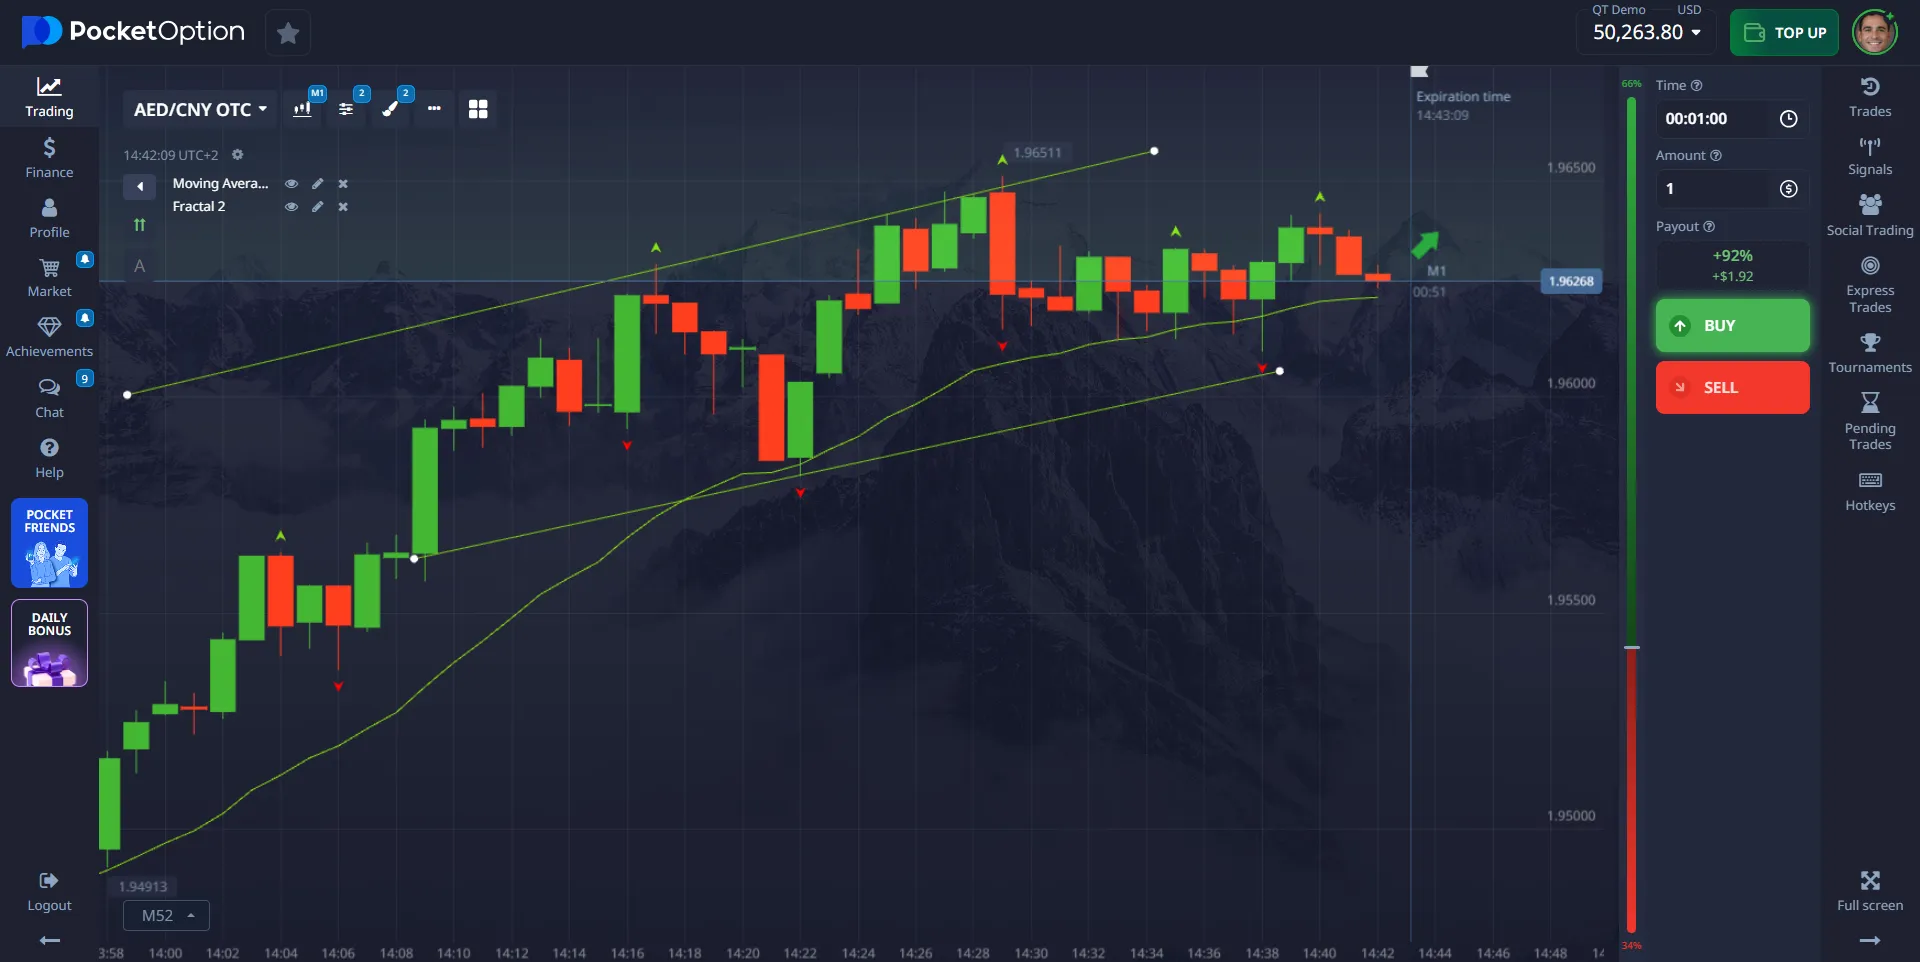
Real-World Application: Pocket Option Example
Let’s say you identify an ascending channel on EUR/USD within the Pocket Option platform:
- Draw trendlines to define support and resistance
- Wait for price to pull back to lower boundary
- Use RSI to confirm oversold condition
- Place Buy trade aiming for top trendline as target
This method aligns price action trading with clear chart patterns trading strategies, boosting confidence and accuracy.
Expert Insights and Recommendations
- Use Multi-Timeframe Analysis: Confirm patterns across higher and lower timeframes
- Backtest Strategies: Evaluate effectiveness using Pocket Option’s demo account
- Customize Alerts: Use Pocket Option’s tools to automate pattern recognition
- Avoid Overtrading: Not every channel deserves a trade — wait for ideal conditions
Conclusion: Channel Patterns for Smart Trading
Mastering the trading channel pattern empowers traders to make data-driven decisions rooted in price behavior. When combined with technical analysis patterns, indicators, and disciplined risk management, channel trading becomes a powerful strategy across markets.
Whether you’re trading forex, stocks, or using a platform like Pocket Option, understanding and applying channel patterns gives you a strategic edge.
FAQ
How do I identify a valid trading channel pattern?
A valid channel consists of at least two touchpoints on each line (support and resistance). It should maintain parallelism and represent consistent trend behavior.
What's the difference between ascending and descending channels?
An ascending channel slopes upward and indicates a bullish trend, while a descending channel slopes downward, signaling a bearish trend.
How long should I hold trades within a channel?
This depends on your trading style. For intraday traders, a few minutes to hours. For swing traders, several days. Key is to exit near opposite channel line or at breakout.
What indicators work best with channel patterns?
Moving averages, RSI, Stochastic, MACD, and Donchian Channel work well for confirming entries and breakouts.
How do I trade channel breakouts successfully?
Wait for price to close outside the channel with confirmation (volume surge, indicator cross). Avoid jumping in on the first breakout candle.
Can trading channel patterns be used in all financial markets?
Yes, trading channel patterns can be applied to various financial markets, including stocks, forex, commodities, and cryptocurrencies.
How do I determine the strength of a trading channel pattern?
The strength of a trading channel pattern can be assessed by factors such as the number of touch points, the duration of the pattern, and the volume of trades within the channel.
What's the difference between channel pattern trading and trend line trading?
Channel pattern trading involves identifying and trading within parallel trendlines that form a channel, while trend line trading focuses on a single trendline to determine the overall market direction.
Trading Strategies
Sign up for more like this
Customize your newsfeed with content you're actually interested in — get up-to-date personalized newsletter in your inbox.
Your comment
Comments are pre-moderated to ensure they comply with our blog guidelines.