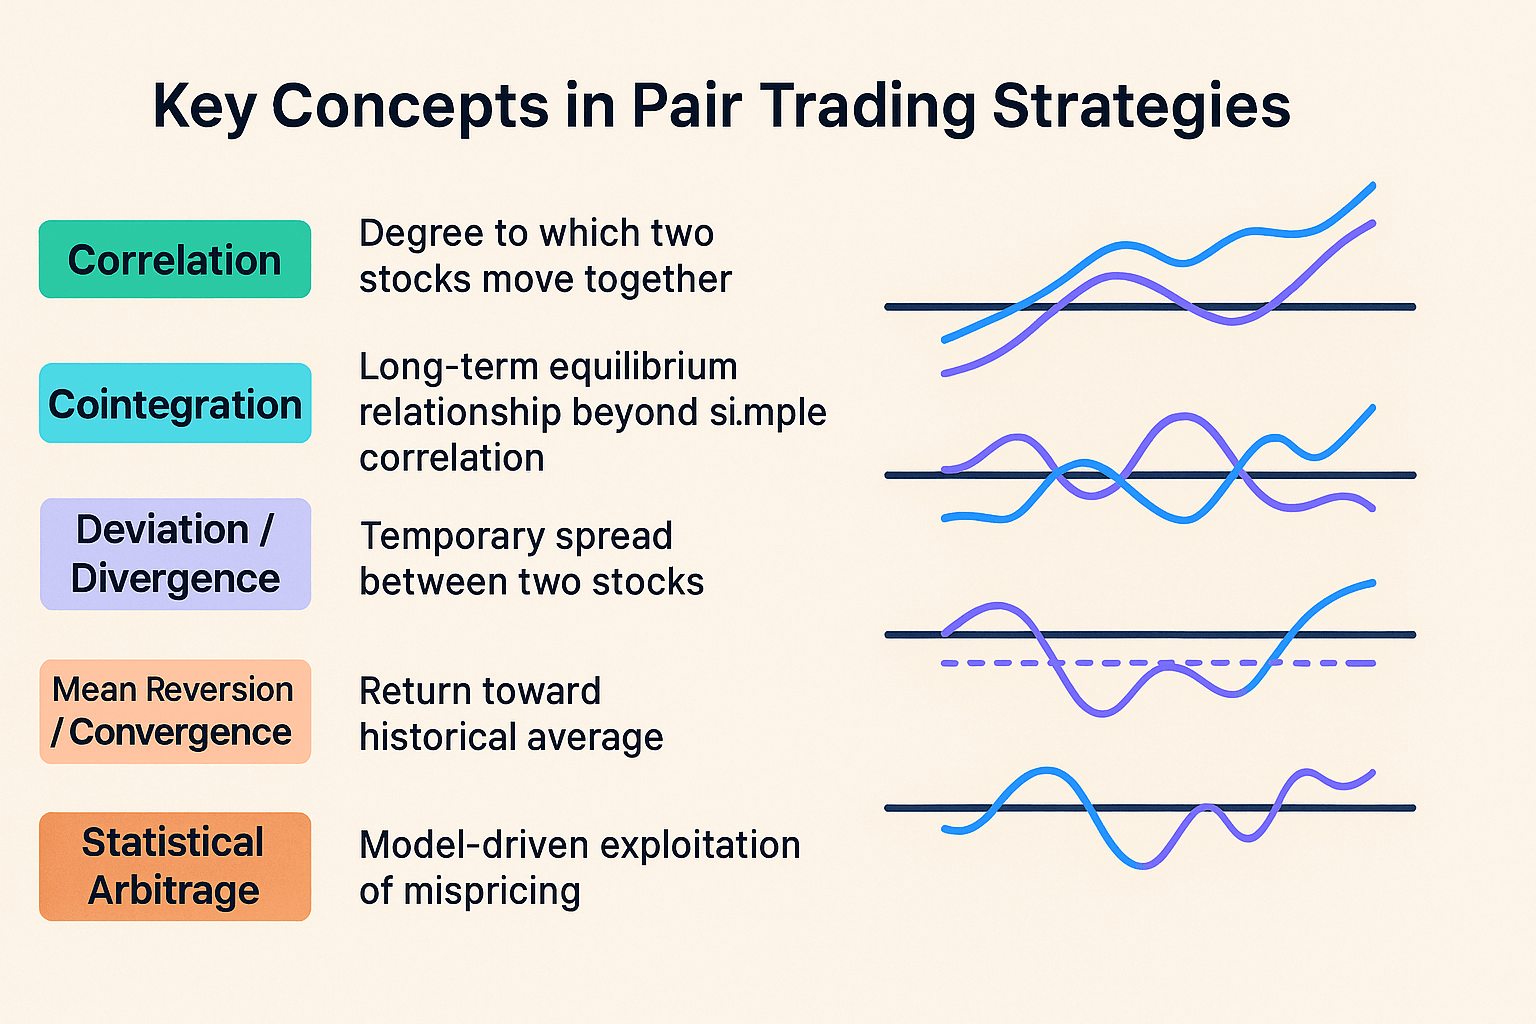
- Correlation: Degree to which two stocks move together
- Cointegration: Long-term equilibrium relationship beyond simple correlation
- Deviation / Divergence: Temporary spread between two stocks
- Mean Reversion / Convergence: Return toward historical average
- Statistical Arbitrage: Model-driven exploitation of mispricing
Comprehensive Pair Trading Stock List Analysis and Implementation Guide

Updated on 04 Jul 2025
A pair trading stock list is your foundation for creating market-neutral trading strategies. This approach relies on pairs of stocks that move together due to high correlation and cointegration, enabling traders to profit from temporary divergence, anticipating convergence. By analyzing historical data, applying statistical, volatility-based filters, and monitoring stock price deviations, traders can identify statistically sound entry and exit points — effectively hedging directional risk.
Article navigation
- What Is Pair Trading and Why Use It?
- Key Concepts in Pair Trading Strategies
- How Do You Find Pair Trading Stocks?
- Platform Comparison for Pair Trading Execution
- Step-by-Step Pair Trading Stock List Setup
- What Is the 3-5-7 Rule in Trading?
- Volatility-Based and Algorithmic Strategies
- Advanced Refinement Techniques
- What Are the Risks of Pair Trading?
- What Is an Example of a Pair Trade?
- Measuring Pair Trade Performance
- Common Pitfalls to Avoid
- Pair Trading Meets Pocket Option: Supporting Your Strategy
- Take Action With Your Strategy
What Is Pair Trading and Why Use It?
Pair trading involves opening a long position in one security and a short position in another correlated stock, based on their typical spread behavior. By looking for a divergence from the norm and betting on a reversion, the trader engages in statistical arbitrage — independent of overall market moves.
“Pair trading keeps you hedged to market moves while capturing pricing inefficiencies between two correlated securities,” says Dr. Kevin Marsh, CFA, Quant Strategist.
Key Concepts in Pair Trading Strategies
These concepts determine when a pair trade is actionable, using price data as triggers.
How Do You Find Pair Trading Stocks?
- Filter by industry to find similar businesses.
- Use historical price data (1–3 years) to calculate correlation.
- Test for cointegration using tools like statsmodels.
- Spot spread deviation using z-score.
- Set alerts at thresholds (e.g., ±2 sigma).
Platform Comparison for Pair Trading Execution
| Platform | Best For | Key Features |
|---|---|---|
| MetaTrader 5 | Technical analysis & EAs | Advanced charting, indicators |
| QuantConnect | Algo strategy development | Backtesting, multi-asset, Python/C# |
| Interactive Brokers | Institutional-level trading | API, pair orders, low latency execution |
| Pocket Option | Quick Trading & beginner use | Demo, social/copy trading, fast execution |
Michael S., Pocket Option user:
“Pocket Option lets me test correlation trades in the demo — execution speed and price reaction are impressive.”
Step-by-Step Pair Trading Stock List Setup
- Select a platform and connect data feeds
- Collect price data
- Run correlation and cointegration tests
- Filter by volatility and proximity to industry averages
- Backtest reversion trades
- Set z-score alerts
- Rebalance monthly, review performance metrics
What Is the 3-5-7 Rule in Trading?
The 3-5-7 rule is a practical benchmark for setting profit expectations in pair trading strategies:
- 3% target for conservative setups with low volatility.
- 5% for medium-risk trades with moderate divergence.
- 7% for high-conviction opportunities during significant volatility.
This rule helps traders maintain discipline, avoid overtrading, and define strategy tiers based on market conditions.
Volatility-Based and Algorithmic Strategies
- Volatility-Based: Choose pairs with high volatility to capture larger spreads — monitor deviation via ATR or standard deviation.
- Algorithmic Trading: Automate based on:
- Correlation > 0.85
- Positive cointegration
- Arbitrary z-score thresholds
- Predefined stop-loss and profit targets
“Volatility-driven pair trades yield wider margins but demand discipline,” notes Lucía F., Senior Quant Trader.
Advanced Refinement Techniques
| Technique | Function in Pair Strategy | Trader Insight |
|---|---|---|
| Machine Learning | Nonlinear pair detection | Finds hidden relationships |
| Exclude Earnings Data | Prevent false divergence | Enhances signal reliability |
| Fundamental Overlays | Aligns valuation metrics | Improves pair stability |
| ATR Filtering | Matches volatility across stocks | Keeps model robust over time |
What Are the Risks of Pair Trading?
Despite being market-neutral, pair trading carries specific risks:
- Divergence Risk: the spread may widen rather than revert.
- Execution Risk: slippage or poor platform performance during trades.
- Model Risk: false assumptions in cointegration or correlation.
- Liquidity Risk: one stock in the pair may be illiquid.
- Overfitting Historical Data: relying too heavily on outdated or unadjusted data.
Successful traders mitigate these risks with robust backtesting, dynamic thresholds, stop-loss mechanisms, and regular stock list reviews.
What Is an Example of a Pair Trade?
A classic example is Coca-Cola (KO) and PepsiCo (PEP). These two stocks are fundamentally similar and often exhibit a correlation >0.9. Suppose KO rises significantly while PEP lags. A trader may:
- Short KO
- Long PEP
Expecting their prices to converge back to the historical average (mean reversion).
Measuring Pair Trade Performance
| Metric | Definition | Target |
|---|---|---|
| Sharpe Ratio | Return per unit risk | > 1.5 |
| Win Rate | Successful trade percentage | > 60% |
| Max Drawdown | Peak-to-trough drawdown | < 20% |
| Profit Factor | Gross gains / losses | > 1.5 |
Common Pitfalls to Avoid
- Assuming correlation = cointegration
- Trading around earnings without adjustment
- Overtrading minor deviations
- Neglecting transaction costs, splits, or dividends
- Failing to update stock list with changing market conditions
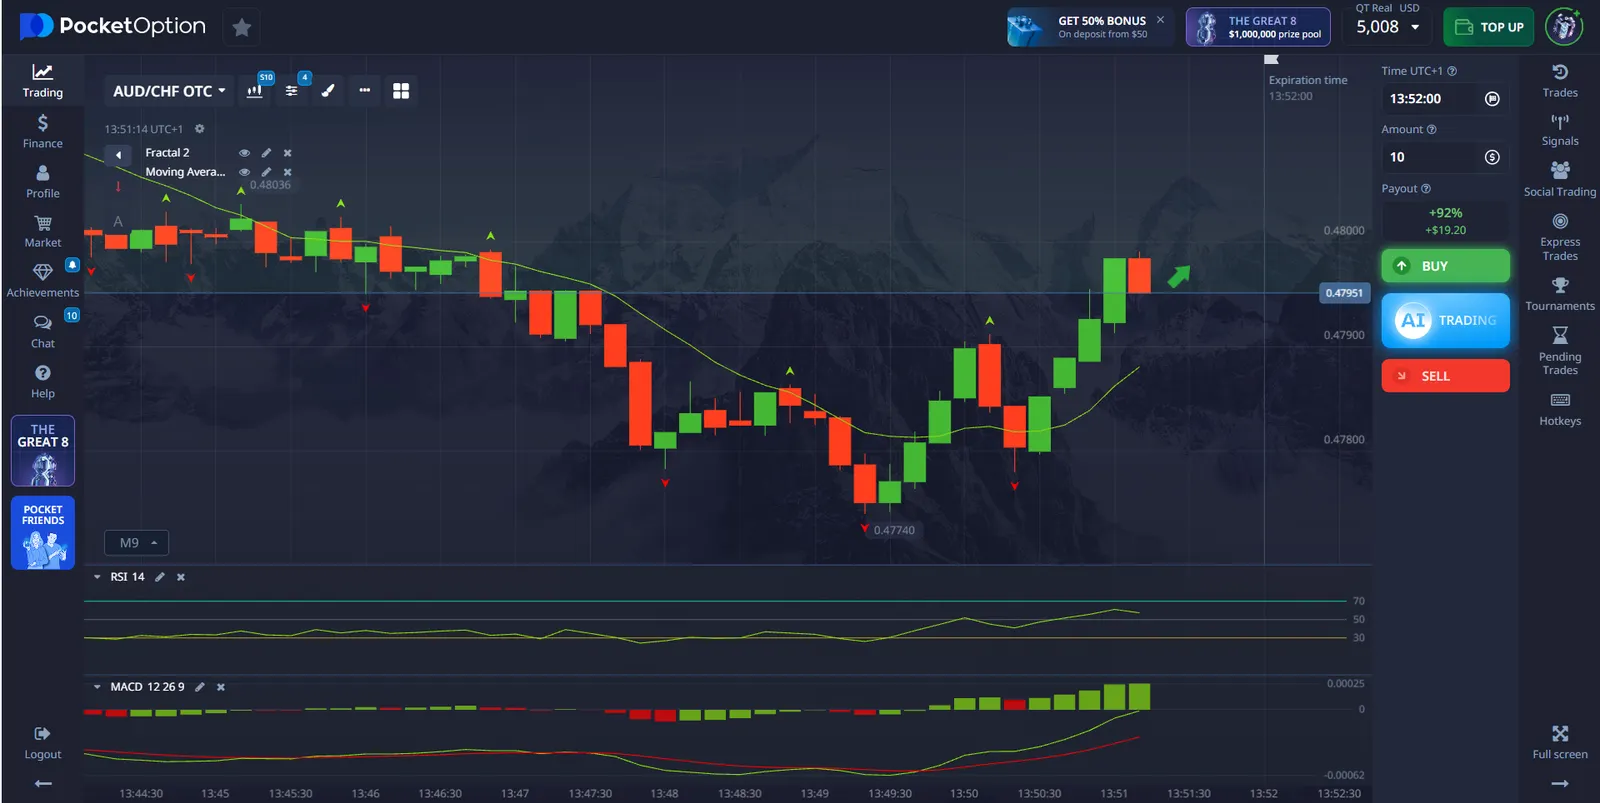
Pair Trading Meets Pocket Option: Supporting Your Strategy
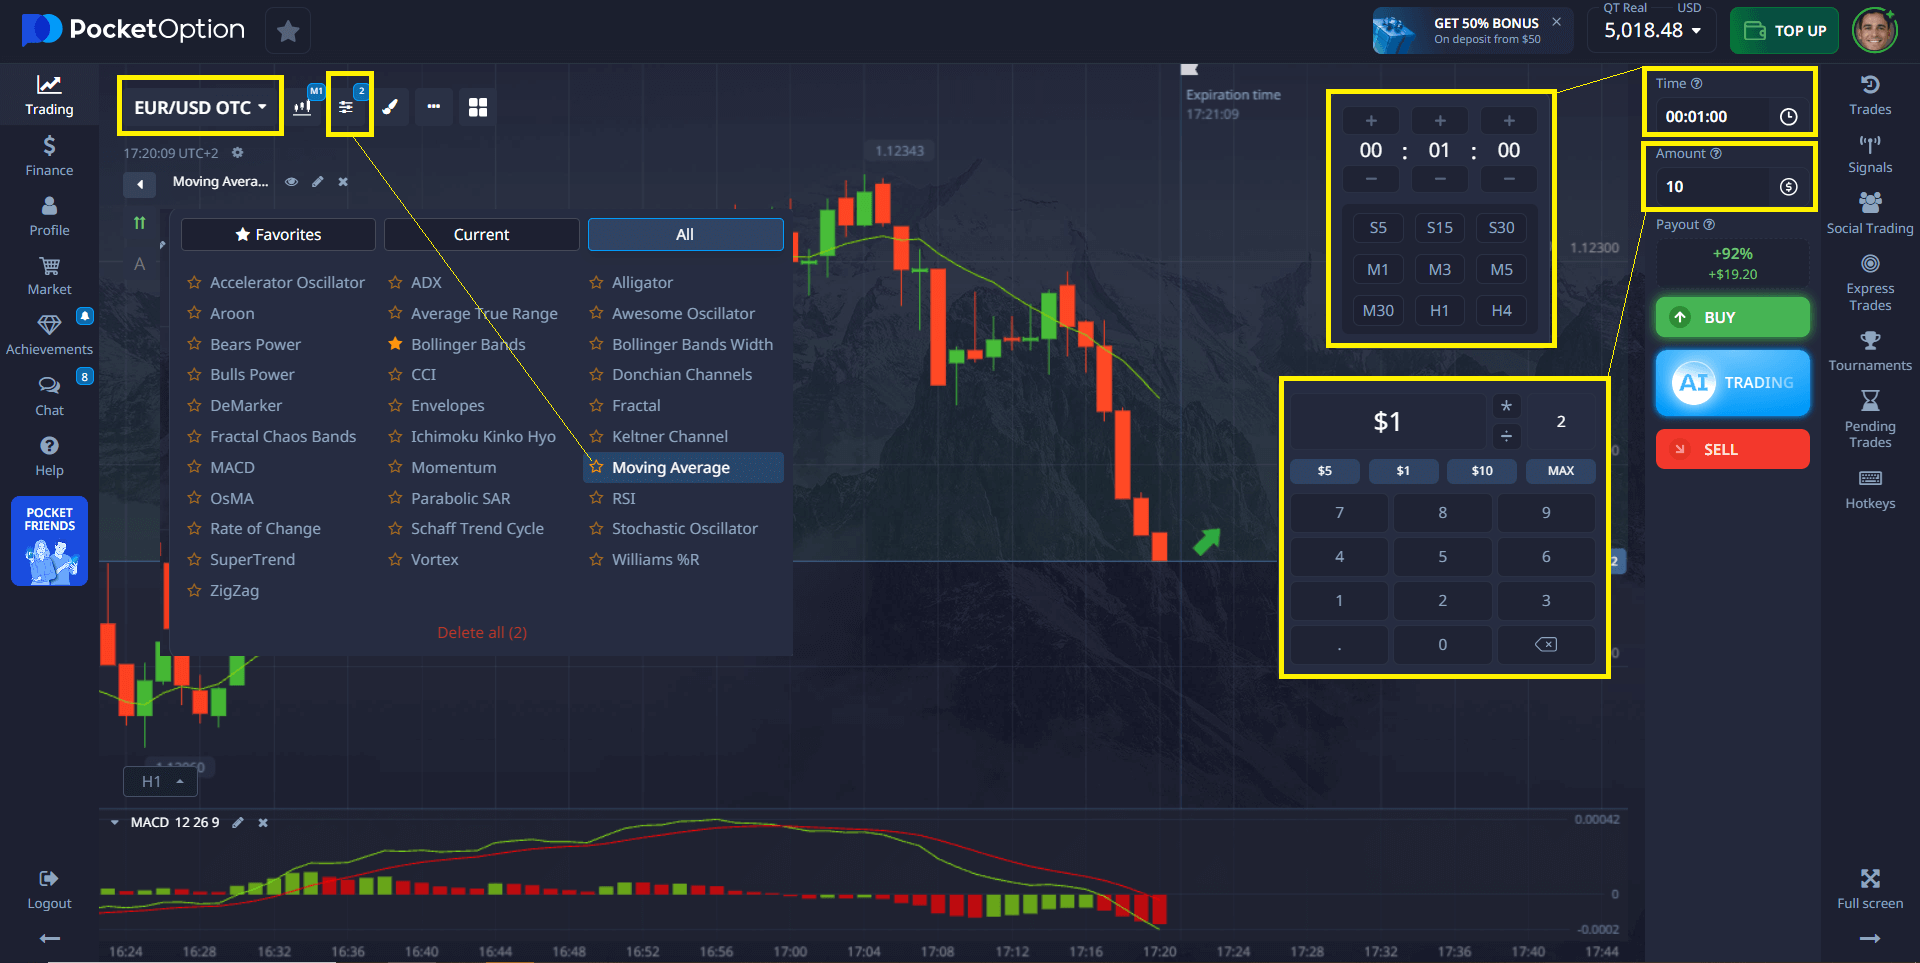
Pocket Option is a user-friendly Quick Trading platform perfect for executing pair trading strategies:
- ✅ 100+ assets: From stocks to crypto — expand your stock list and find highly correlated pairs.
- 📊 30+ technical indicators (RSI, MACD, Bollinger Bands): Monitor deviations and identify entry/exit points.
- ⚡ Quick Trading with up to 92% return in 5 seconds — ideal when a stock price suddenly diverges and is ready to revert.
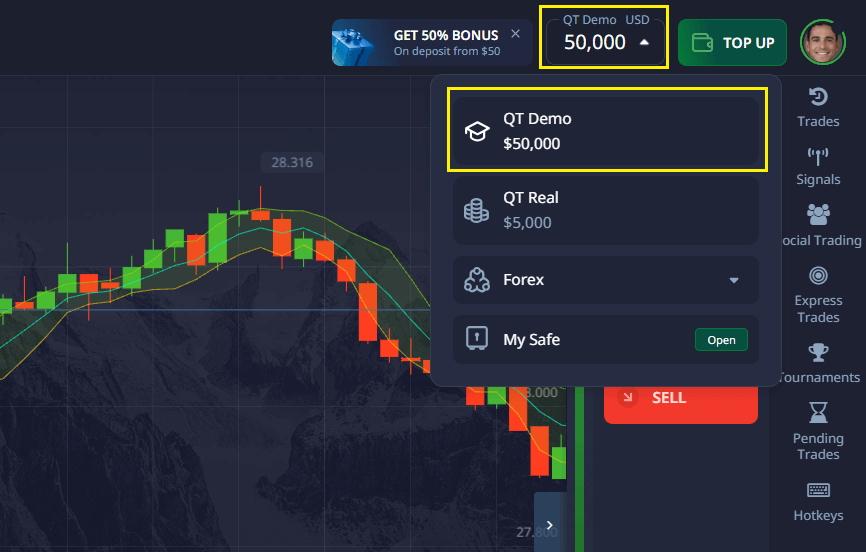
- 🧪 $50,000 demo — test your pair trade strategies risk-free.
- 💵 Deposits from $5, trades from $1 — quickly validate multiple trading ideas.
- 🤝 Social and copy trading — observe how real traders operate and learn from their experience.
- 🏆 Tournaments and bonuses — test and scale your strategies with additional capital.
Pocket Option empowers traders to put statistical arbitrage into action — whether you’re a beginner or a pro.
Take Action With Your Strategy
Build a focused, high-correlation pair trading stock list, backtest under real market conditions, and optimize based on statistical insights. Use platforms like Pocket Option to execute fast, low-risk Quick trades. Consistent review, discipline, and refinement will elevate your strategy to professional levels.
💬 Discuss this and other strategies in our community!
FAQ
What is a pair trading stock list and why is it important?
A pair trading stock list is a carefully selected group of highly correlated stocks used in pair trading strategies. It helps traders reduce market exposure and increase the probability of statistically profitable trades.
How often should I update my pair trading stock list?
You should update your list at least once a month. Re-evaluate more frequently during earnings seasons, market volatility spikes, or corporate actions affecting your pairs.
Can a pair trading stock list strategy work in both bull and bear markets?
Yes. Since pair trading focuses on relative performance between two stocks, it can be profitable in rising, falling, or sideways markets.
What is the minimum capital required to start trading with a pair trading stock list?
While small accounts are possible, $25,000 to $50,000 is generally recommended for effective diversification and risk management.
Are there any tax considerations when using a pair trading stock list?
Yes. Because pair trading involves both long and short positions, it can lead to complex tax implications. It’s wise to consult a tax advisor familiar with trading strategies in your country.
Trading
Sign up for more like this
Customize your newsfeed with content you're actually interested in — get up-to-date personalized newsletter in your inbox.
Your comment
Comments are pre-moderated to ensure they comply with our blog guidelines.