- Customizable alerts: Notify traders of specific market conditions
- Technical indicators: Support predictive analytics and pattern recognition
Advanced Analytics Tool Trading: Enhance Your Trading with Data-Driven Insights

Advanced Analytics Tool Trading: Enhance Your Trading with Data-Driven Insights In the fast-paced world of financial markets, an advanced analytics tool trading platform is not just an advantage—it is a necessity. These tools provide traders with real-time data processing, pattern recognition, and performance optimization, all of which are essential for making strategic, well-informed decisions. For users of Pocket Option, these capabilities unlock superior trading outcomes by transforming complex data into actionable insights.
Article navigation
- Why Data Matters in Trading
- How Analytics Tools Support Better Decisions
- Technical Analysis Tools and Their Role
- Enhanced Integration for Traders
- The Power of Charts in Strategy Development
- Leveraging Analytics on Pocket Option
- Advanced Risk Management with Analytics
- Improving Performance with Data-Driven Tools
- Conclusion: Elevate Your Strategy with Pocket Option
What Is Trading Analytics?
Trading analytics is the practice of using data analysis to understand, evaluate, and improve trading performance. This process involves gathering, interpreting, and visualizing market data to spot trends and opportunities. Key components of trading analytics include:
| Metric | Description |
|---|---|
| Liquidity | Measures how quickly assets can be bought/sold |
| Timeframe | Refers to the duration of a trade or strategy |
| Market Dynamics | Captures the behavior and movement of the financial markets |
Using trading analytics software, traders can refine their approach, test new strategies, and manage risks more effectively.
Expert Insight:
“Trading analytics is no longer optional. In today’s markets, it is the trader’s compass. With the right tools, data becomes your most powerful ally.” — Elena Moretti, Financial Analyst, QuantEdge Capital
Why Data Matters in Trading
Data fuels every successful trade. With access to comprehensive market data analysis, traders can backtest strategies, identify market inefficiencies, and optimize entry and exit points. Analytics tools convert raw information into meaningful insights, helping traders make rational choices based on empirical evidence, not emotion.
How Analytics Tools Support Better Decisions
Advanced analytics tool trading platforms provide a robust set of features:
These algorithmic trading tools assist in improving performance metrics such as win rate, average return, and drawdown, by analyzing historical and real-time data.
Unique Recommendation:
Experiment with adjusting your signal threshold values weekly to adapt to changing market volatility. A small tweak can improve signal relevance dramatically.
Technical Analysis Tools and Their Role
Overview of Technical Analysis
Technical analysis evaluates securities using historical price and volume data. Charts and indicators like RSI, MACD, and Bollinger Bands are core tools that help forecast price movements and create winning strategies.
Popular Tools in the Market
| Tool | Key Features |
|---|---|
| TradingView | Real-time charts, drawing tools, community scripts |
| StockCharts | Broad indicator library, clean chart interface |
Pocket Option also integrates these types of tools into its trading interface, supporting real-time visualization and streamlined market interpretation.
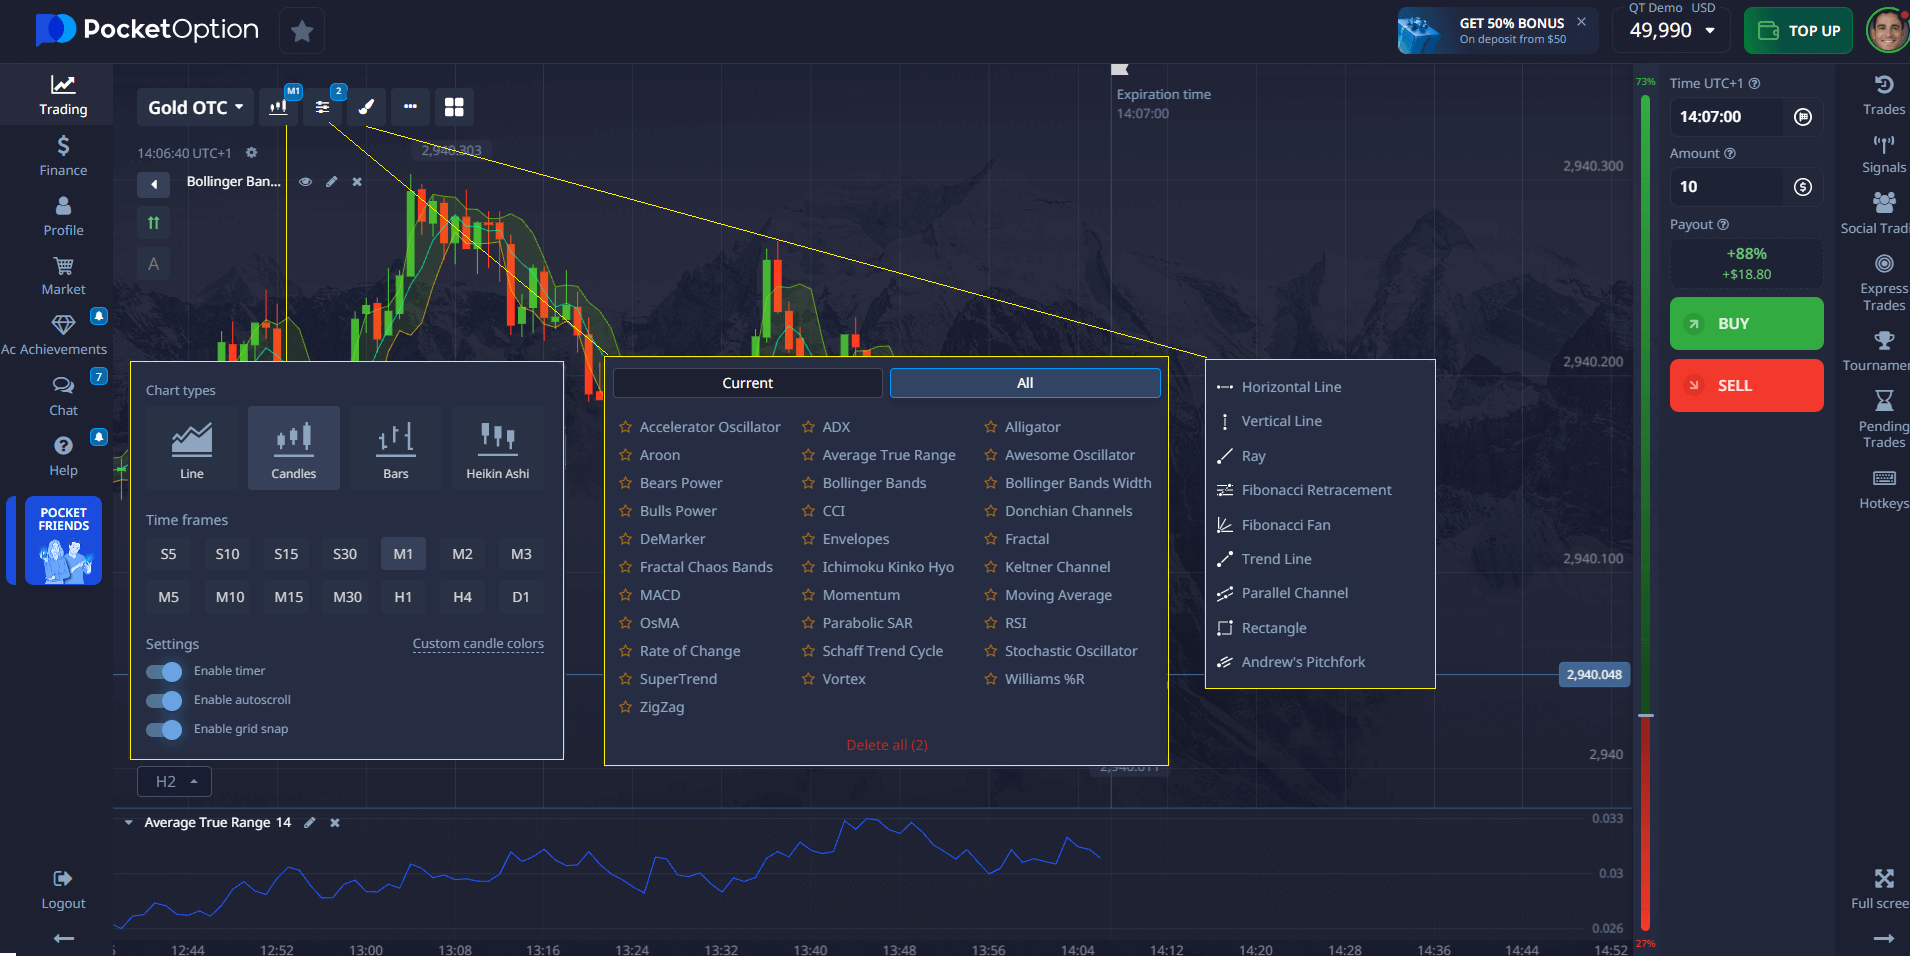
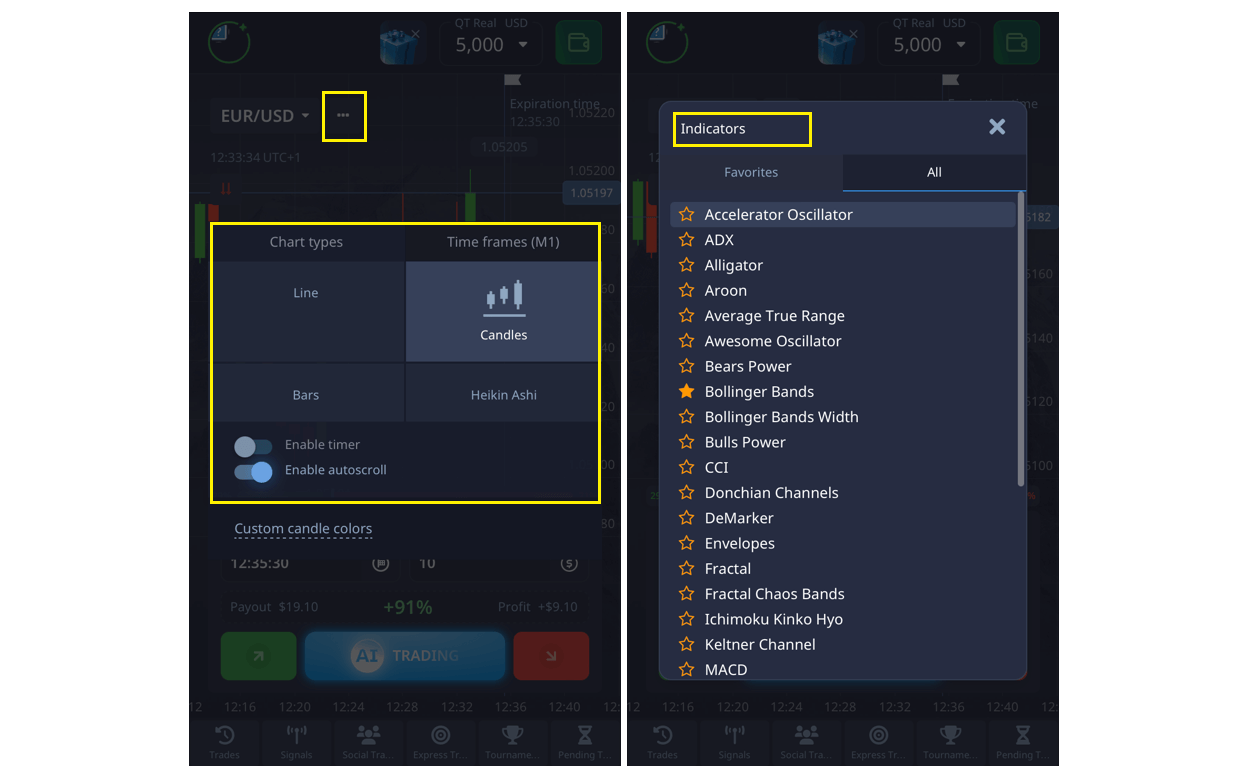
The Pocket Option trading interface is designed with both beginner and experienced traders in mind, offering a wide range of technical tools. Here’s an overview:
- Chart Types: You can choose from several chart types, including candlestick charts, line charts, and more — each providing a clear visual representation of market movement.
- Charting Tools: The platform provides a variety of drawing tools, such as trend lines, Fibonacci retracements, and support/resistance tools. These tools help you visually mark patterns, price zones, and potential reversal points.
- Technical Indicators: A wide range of indicators are available, including moving averages, RSI, MACD, Bollinger Bands, and more. These indicators help you identify trends, momentum, and market volatility.
Enhanced Integration for Traders
Integrating multiple tools allows traders to compare different signals and test strategies across platforms. Combining technical indicators with trading analytics software offers a comprehensive analysis system, enhancing trade accuracy.
The Power of Charts in Strategy Development
Types of Charts
- Line Chart: Simplified overview of price movement
- Bar Chart: Details open, high, low, and close prices
- Candlestick Chart: Visualizes market sentiment and trend direction
Interpreting Charts for Better Trades
Mastering chart interpretation helps traders:
- Identify support and resistance levels
- Recognize trend lines and price channels
- Apply predictive analytics for future moves
By fusing chart analysis with analytics tools, traders elevate their strategy development process.
Leveraging Analytics on Pocket Option
Pocket Option stands out with its comprehensive suite of analytics features designed to empower every level of trader:
- Real-time market data
- Economic calendar with critical updates
- Integrated charts and indicators for data visualization
- Quick access to mobile analytics apps
The Analytics tool on Pocket Option includes performance metrics, market news, and direct access to tools like Pocket Option Analytics and AI Trading apps.
Additionally, Pocket Option provides two types of trading insights via signals:
- Platform-based signals
- Telegram Signal Bot (TG Bot)
These signals are powered by algorithmic trading tools, offering real-time trading opportunities.
Real Trader Review:
“The analytics interface on Pocket Option is intuitive and full of depth. I especially love the TG Bot for its reliability during volatile sessions.” — Marcus Hanley, Active Trader

Advanced Risk Management with Analytics
Key Risk Management Strategies
| Strategy | Description |
|---|---|
| Stop-Loss Orders | Automatically exits a trade to limit losses |
| Diversification | Spreads investment across multiple assets to reduce risk |
| Risk-Reward Ratio | Balances potential profit versus potential loss in every trade |
Using Risk Assessment Tools
Advanced analytics tools provide risk assessment dashboards, helping traders gauge volatility and liquidity. Pocket Option offers built-in indicators and alerts that highlight potential risks and suggest optimal trade setups.
Improving Performance with Data-Driven Tools
Performance Analysis
Analyzing past trading data enables traders to track progress and identify patterns. Key performance metrics include:
- Profit factor
- Trade frequency
- Average return per trade
Trade Idea Generation
Using predictive analytics, traders can create hypotheses and test strategies using trading simulators. Pocket Option’s demo account offers a $50,000 balance for practicing strategies in a risk-free environment.
Simulation and Skill Enhancement
Simulators mirror real-market conditions, helping users enhance their skills without financial risk. By analyzing simulated trades, users refine their approach and build confidence before switching to live trading.
Insight from an Experienced Trader:
“My biggest improvement came after I started tracking trade-specific performance metrics. It made my strengths and weaknesses crystal clear.” — Diego Ferrera, Swing Trader
Conclusion: Elevate Your Strategy with Pocket Option
Incorporating an advanced analytics tool trading into your strategy allows you to transform raw market data into precise actions. Pocket Option delivers all essential tools–real-time analytics, customizable indicators, and intelligent signal bots–under one roof. Whether you are analyzing charts, testing new strategies, or refining your risk management, Pocket Option supports your journey with data-driven confidence.
FAQ
What features should an advanced trading analytics tool have?
An ideal advanced analytics tool trading should include real-time data feeds, customizable technical indicators, performance tracking, predictive analytics, and integration with risk assessment tools.
How do analytics tools improve trading performance?
They provide actionable insights by processing historical and real-time market data, allowing traders to identify patterns, optimize entry/exit points, and reduce emotional decision-making.
Can beginners use advanced analytics tools effectively?
Yes, especially on platforms like Pocket Option, where the interface is designed to be intuitive. Tutorials and demo accounts also help beginners practice in a risk-free environment.
What's the ROI of using trading analytics software?
While ROI varies, traders often report better risk control and higher trade accuracy. Consistent use of analytics tools generally leads to improved long-term profitability.
How do I interpret trading analytics data correctly?
Start by focusing on key performance metrics such as win rate, average return, and drawdown. Use visual tools like charts and dashboards to contextualize this data for better decision-making.
What makes an advanced analytics tool effective for trading?
It combines real-time data processing, pattern recognition, and risk assessment capabilities to provide comprehensive market analysis.
What are the key benefits of using analytics tools in trading?
Enhanced decision-making, improved risk management, and more accurate market trend identification.
How can traders measure the effectiveness of their analytics tools?
By tracking success rates, risk-adjusted returns, and portfolio performance metrics.
Trading platforms
Sign up for more like this
Customize your newsfeed with content you're actually interested in — get up-to-date personalized newsletter in your inbox.
Your comment
Comments are pre-moderated to ensure they comply with our blog guidelines.