- Candlestick Charts: Visual representation of price action over time. Used to identify bullish/bearish sentiment.
- Moving Averages (SMA, EMA): Smooth price data to reveal underlying trends.
- Support and Resistance Lines: Identify potential reversal or breakout zones.
- Volume Indicators: Measure the strength of price moves and validate trends.
- Relative Strength Index (RSI): Shows whether an asset is overbought or oversold.
- MACD (Moving Average Convergence Divergence): Highlights momentum and trend shifts.
- Bollinger Bands: Indicate volatility levels and possible price breakouts.
- Trendlines and Channels: Help frame market structure and anticipate breakout points.
Master the Most Powerful Chart Analysis Techniques for Better Trades

Updated on 06 Jul 2025
Chart analysis combines mathematical precision with statistical methods to interpret market movements. This comprehensive overview covers essential metrics, calculation techniques, and practical applications for both beginners and experienced traders. Pocket Option offers a powerful platform environment where you can apply these methods.
Article navigation
Core Mathematical Components
Most Popular Chart Analysis Tools
These tools form the technical foundation of decision-making on platforms like Pocket Option, where real-time implementation makes chart analysis highly practical for all skill levels.
“Mathematical tools like regression and beta aren’t just theory—they offer critical insight into live market behavior.”
— Dr. Elias Gruber, Quantitative Analyst at StatEdge
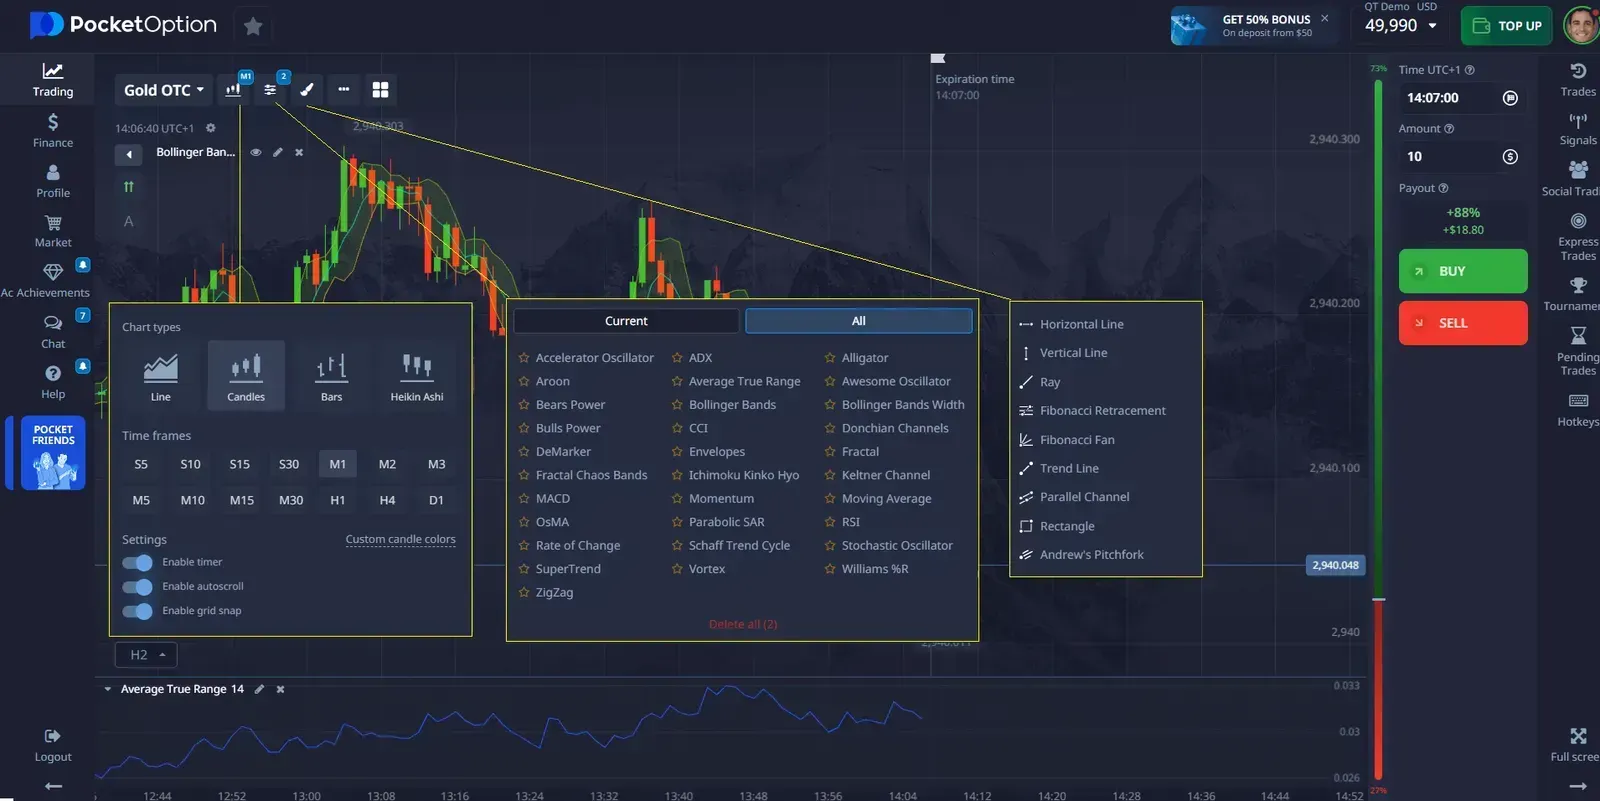
Pocket Option’s tools for charting analysis are robust and user-friendly. The platform includes powerful charting features, several technical indicators, and visual aids to help you interpret price movements and make informed decisions. The trading interface offers customization options, so you can tailor the charts to suit your analysis style.
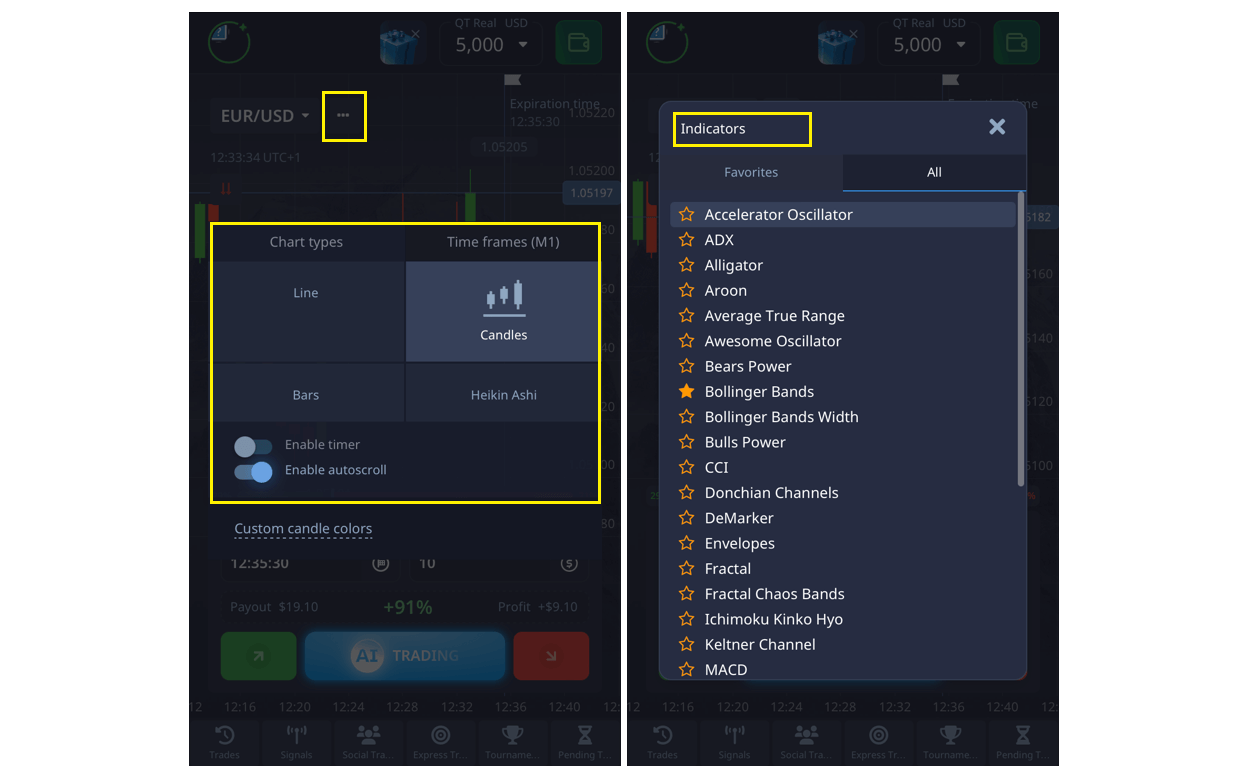
Plus, these tools are available on both the desktop interface and the Pocket Option mobile app, giving you the flexibility to monitor the markets wherever you are.
Statistical Metrics in Trading
| Metric | Formula | Application |
|---|---|---|
| Standard Deviation | σ = √(Σ(x-μ)²/n) | Volatility measurement |
| Beta Coefficient | β = Cov(r,m)/Var(m) | Market sensitivity |
| R-Squared | R² = 1 – (SSres/SStot) | Trend reliability |
| Sharpe Ratio | (Rp – Rf) / σp | Risk-adjusted return |
| Value at Risk | μ – (σ × z-score) | Potential loss estimate |
Data Collection Methods
Effective chart analysis starts with proper data collection. Pocket Option provides various timeframes for trading analysis:
| Timeframe | Data Points | Best Use Case |
|---|---|---|
| 1 minute | 1440/day | Short-term analysis |
| 15 minutes | 96/day | Intraday trends |
| 1 hour | 24/day | Medium-term patterns |
Key Performance Indicators
- Price action metrics
- Volume indicators
- Trend strength measurements
- Support/resistance levels
“When I started using Pocket Option’s, the ability to measure volume around support levels helped me prevent fakeouts. It’s a hidden edge most beginners overlook.” — Yassine M., Independent Trader
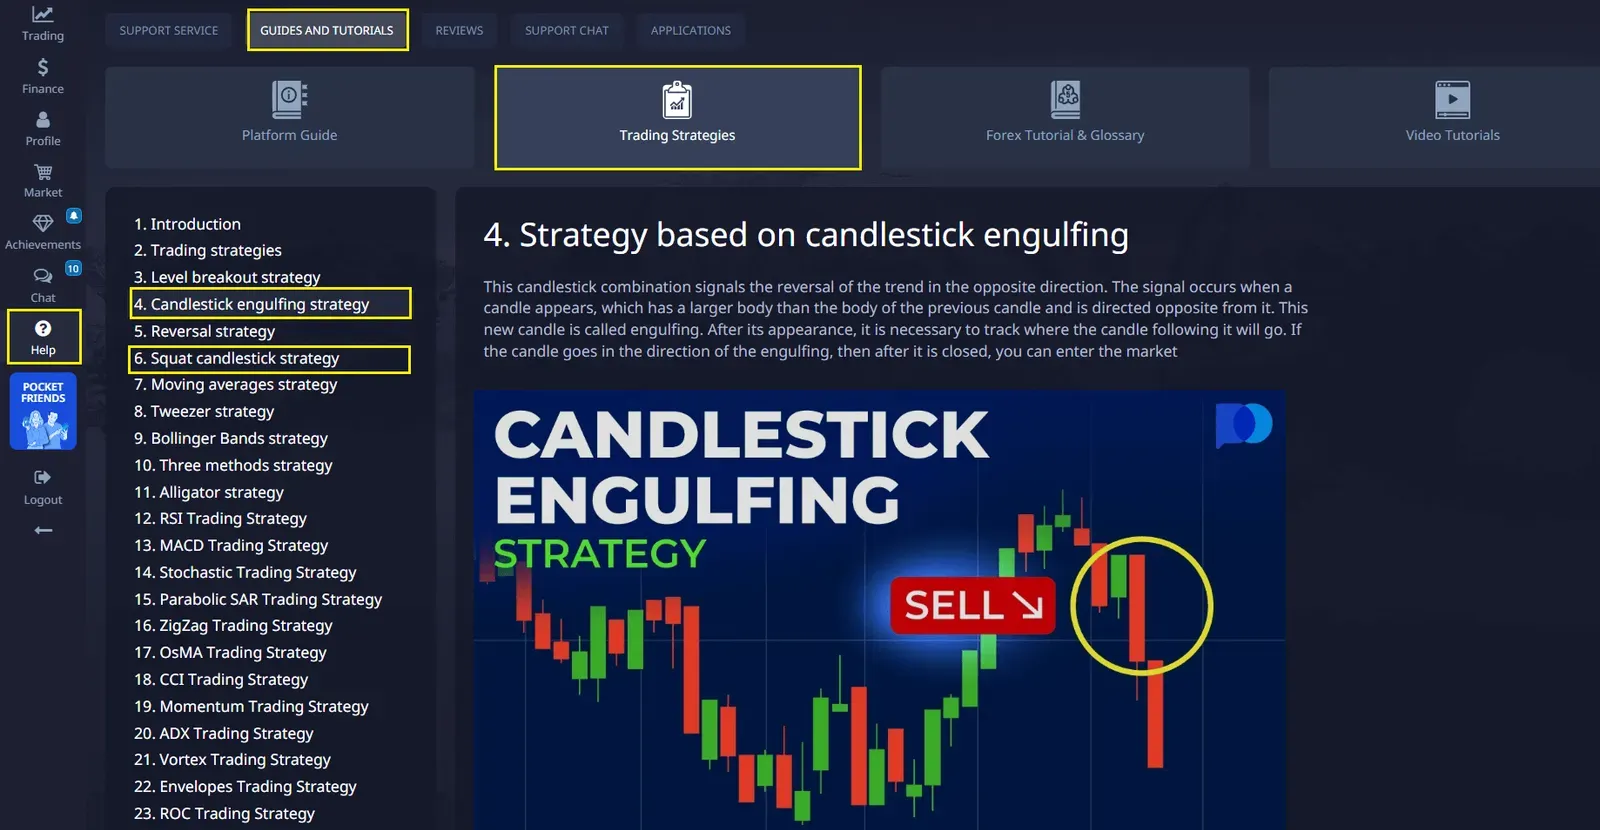
Learn different strategies in our knowledge base and practice on a demo account for free!
Mathematical Pattern Recognition
| Pattern | Mathematical Criteria | Success Rate |
|---|---|---|
| Double Top | Peak difference < 1% | 65–75% |
| Channel | R² > 0.95 | 70–80% |
| Triangle | Convergence angle 15–45° | 60–70% |
Risk Assessment Metrics
- Maximum drawdown calculations
- Risk-reward ratios
- Position sizing formulas
- Correlation coefficients
“Understanding your max drawdown from past demo trades can reveal your true risk appetite better than any questionnaire.” — Julia Phan, Risk Manager at FXDepth
How to Open Account
- Register now
- Choose demo or real acc from the dashboard
- Start trading with $50,000 virtual funds
- Switch to real account when ready
- Use technical analysis instruments

Conclusion
Chart analysis is not guesswork — it’s data, probability, and structure. The Pocket Option trading interface supports traders by offering a wide array of analytical indicators and pattern recognition tools. Whether you’re applying regression models or tracking support zones, consistent application of mathematical tools improves both strategy and discipline. Discuss this and other topics in our community!
FAQ
What is the minimum data set needed for reliable chart analysis?
A minimum of 30 data points is recommended for statistical significance, though larger datasets of 100+ points provide more reliable results.
How often should technical indicators be recalibrated?
Technical indicators should be recalibrated when market conditions change significantly, typically every 3-6 months or when volatility patterns shift.
What's the most efficient way to combine multiple technical indicators?
Use 2-3 uncorrelated indicators from different categories (trend, momentum, volume) to avoid redundancy and get complementary signals.
How can I validate the accuracy of my chart analysis?
Maintain a trading journal with prediction accuracy rates, regularly backtest your analysis methods, and calculate success rates over different timeframes.
What role does volatility play in chart analysis?
Volatility helps determine position sizing, stop-loss levels, and influences the reliability of technical patterns. Higher volatility requires wider stops and more conservative position sizing.
Learning
Sign up for more like this
Customize your newsfeed with content you're actually interested in — get up-to-date personalized newsletter in your inbox.
Your comment
Comments are pre-moderated to ensure they comply with our blog guidelines.