- Cycle context: a clean way to judge whether Bitcoin is historically cheap or expensive.
- Hard data: it runs on hard blockchain numbers, not vibes or sentiment surveys.
- Track record: it has flagged the extremes of several past cycles.
Understanding the Puell Multiple Indicator

5 min to read

Updated on 24 Jun 2026
Bitcoin moves in cycles. Big run-ups, brutal crashes, long flat stretches in between. Traders have spent years hunting for signals that flag the turning points early. The Puell Multiple is one of those signals, and it works from an angle most beginners never think to check: not price, but what miners earn.
What Is the Puell Multiple?
The Puell Multiple is an on-chain indicator created by analyst David Puell. Strip it down and it does one thing: it weighs the dollars miners haul in on a given day against their typical daily haul over the past year. When the ratio runs hot, miners earn far more than usual; when it runs cold, they barely scrape by. Glancing at the bitcoin puell multiple current reading tells you fast whether the market is overheated, starved, or stuck mid-range.
Trade Bitcoin Your Way
Want to put cycle signals like this into practice? Open a free demo account and trade Bitcoin plus 100+ other assets with virtual funds.
Reading an indicator off a chart is the simple half. Turning it into well-timed trades is what humbles people, and that gap is where many newcomers hand money back.
A demo trading account lets you rehearse Bitcoin entries and exits against live prices, with virtual funds, while none of your own money is on the line.
How Does the Puell Multiple Work?
Here is the logic. Whenever a new block gets added, the protocol mints a fresh slice of coins and routes it to whichever miner did the work. Tally a full day of that payout in dollars and you have the mining sector’s daily wage. The indicator takes that daily figure and divides it by its own 365-day average. So the bitcoin puell multiple current value answers one blunt question: are miners earning more or less than they normally do across a full year? When the bitcoin puell multiple current value pushes well above 1, miner income is unusually fat, which has lined up repeatedly with euphoric, overheated markets. When it sinks far below 1, miners are squeezed, and that has often marked the floor.
Puell Multiple Formula Explained
The math behind the current bitcoin puell multiple is refreshingly light:
Puell Multiple = Daily Coin Issuance (USD) / 365-Day Moving Average of Daily Coin Issuance (USD)
Two pieces only. The top is today’s dollar value of newly mined coins, the bottom the average daily value of that issuance over the past year. Divide one by the other and out comes the current bitcoin puell multiple. Land on 1.0 and miners are earning exactly their yearly average. Above 1, they are ahead. Below 1, behind.
What Do Puell Multiple Values Mean?
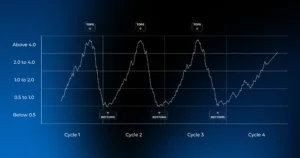
So how do you read the number? Rough zones have held up across past cycles, and a quick puell multiple cheat sheet looks like this:
| Value Range | What It Has Signaled |
|---|---|
| Below 0.5 | Deep value zone, miners squeezed, historically near major bottoms |
| 0.5 to 1.0 | Undervalued, common accumulation territory |
| 1.0 to 2.0 | Neutral, mid-cycle, no strong signal either way |
| 2.0 to 4.0 | Elevated, starting to run warm, time for caution |
| Above 4.0 | Overheated, miners flush with profit, historically near tops |
Treat these as fuzzy bands, not hard lines. The exact puell multiple thresholds drift a little each cycle, yet the broad story, cheap when low and pricey when high, has stayed remarkably consistent.
Bitcoin Market Tops and Bottoms
History gives the indicator some credibility. During the frenzied 2017 peak, with Bitcoin storming toward the 20k mark, the reading shot deep into overheated territory. The late 2018 bottom around 3,200 dollars saw it crash under 0.5, a textbook deep-value print, just before the next bull run. The 2022 lows rhymed with it. It is no crystal ball, but seeing where the puell multiple current level sits against those past extremes gives traders real cycle context.
How Traders Use the Current Puell Multiple
Understanding what is puell multiple is one thing. Putting it to work is another. Most traders treat it as a backdrop, not a buy or sell button. A low reading is a cue to start watching for accumulation, not to back up the truck on day one. A sky-high one says pare back exposure, pull stops in, quit buying strength. Once you grasp what is puell multiple saying about miner stress, you can line it up with price, volume, and other on-chain data instead of one lone number.
Benefits and Limitations of the Puell Multiple
Like any single indicator, it has a sweet spot and real blind spots.
What it does well:
Where it falls short:
- It lags. The 365-day average reacts slowly, so signals can show up late.
- It is Bitcoin only. The logic is tied to mining issuance and does not carry over to other assets.
- It is not a timer. Markets can stay overheated or oversold far longer than feels sane.
Risk Disclaimer: Trading involves significant risk of capital loss. This article is for educational purposes only and does not constitute financial advice. Always conduct independent research and consider your risk tolerance before making any trading decisions.
FAQ
What Is a Good Puell Multiple Value?
It depends on what you are after. Long-term buyers have historically found appealing entries whenever the figure dips beneath 0.5. For anyone wary of a top, values above 4 have flagged overheated conditions. A mid-range 1 to 2 usually means no strong signal either way.
Can the Puell Multiple Predict Bitcoin Tops?
Not predict, exactly. It has lined up with past tops whenever readings pushed above 4, but that is a pattern, not a promise. It works best as a warning light, used alongside other tools rather than a solo forecast.
What Does the Current Puell Multiple Mean?
The current reading shows how today's miner revenue compares to its yearly average. Near 1 means miners earn roughly normal. Far above 1 hints at an overheated market; far below 1 points to miner stress and possible undervaluation. For the latest figure, pull up a live chart.
About the author :
Learning
Sign up for more like this
Customize your newsfeed with content you're actually interested in — get up-to-date personalized newsletter in your inbox.
Your comment
Comments are pre-moderated to ensure they comply with our blog guidelines.