- Ekonomik göstergeler
- Para birimi çiftinin tarihsel verileri
- Piyasa duyarlılık göstergeleri
- Teknik göstergeler
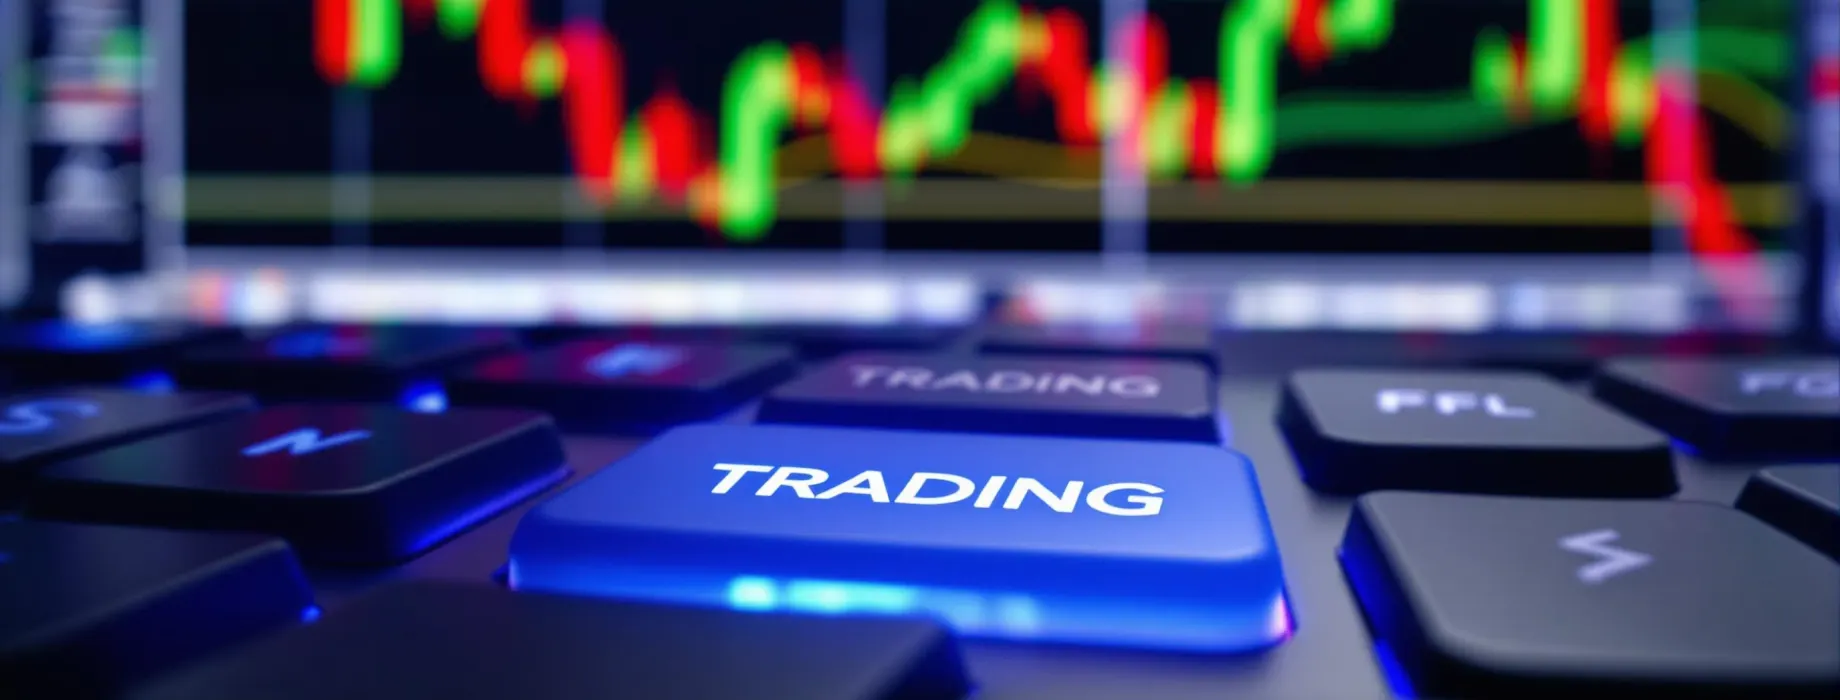
Pocket Option: Veri Tabanlı Stratejilerle Forex Ticaretine Nasıl Başlanır
Updated on 04 Tem 2025
Forex ticaretine nasıl başlanacağı merak edenler için, bu alandaki başarının büyük ölçüde matematiksel analiz ve veri odaklı karar verme ile ilgili olduğunu anlamak önemlidir. Forex ticareti yapmanın yollarını merak ediyorsanız veya özellikle yeni başlayanlar için forex ticaretine nasıl başlanacağı hakkında bilgi almak istiyorsanız, bu kapsamlı kılavuz, piyasaya analitik bir şekilde yaklaşmanız için gerekli bilgileri sağlayacaktır.
Forex Ticaretinde Veri Toplama
Başarılı forex ticaretinin temeli sağlam veri toplamaya dayanır. Trader’ların bilinçli kararlar almak için çeşitli veri türlerini toplaması gerekir. Üzerinde durmanız gereken ana veri kategorileri şunlardır:
Bu kategorilerin her birini detaylı bir şekilde inceleyelim ve ticaret stratejinize nasıl katkıda bulunduklarını anlayalım.
Ekonomik Göstergeler
Ekonomik göstergeler, bir ülkenin ekonomisinin genel sağlığı hakkında içgörüler sağlar ve bu durum doğrudan para biriminin değerini etkiler. Bazı önemli ekonomik göstergeler şunlardır:
| Gösterge | Açıklama | Para Birimine Etkisi |
|---|---|---|
| GSYİH Büyüme Oranı | Ekonomik çıktıyı ölçer | Olumlu büyü para birimini güçlendirir |
| Enflasyon Oranı | Fiyat artışlarını ölçer | Yüksek enflasyon genellikle para birimini zayıflatır |
| İstihdam Oranı | İşgücü piyasasının sağlığını ölçer | Yüksek istihdam para birimini güçlendirir |
| Faiz Oranları | Merkez bankaları tarafından belirlenir | Daha yüksek oranlar yabancı yatırımları çeker |
Bu göstergeleri düzenli olarak takip etmek, forex ticaretine nasıl başlanacağına dair değerli içgörüler sağlayabilir.
Para Birimi Çifti Tarihsel Verileri
Para birimi çiftlerinin tarihsel fiyat verileri, teknik analiz için kritik öneme sahiptir. Bu veriler genellikle şunları içerir:
- Açılış ve kapanış fiyatları
- En yüksek ve en düşük fiyatlar
- İşlem hacmi
Bu verileri analiz etmek, ticaret için trendleri, kalıpları ve potansiyel giriş veya çıkış noktalarını belirlemeye yardımcı olur.
Piyasa Duyarlılık Göstergeleri
Piyasa duyarlılığı, yatırımcıların belirli bir para birimine veya genel olarak piyasaya karşı olan tutumunu yansıtır. Bazı popüler duyarlılık göstergeleri şunlardır:
| Gösterge | Açıklama |
|---|---|
| Trader’ların Taahhüt Raporu (COT) | Farklı trader türlerinin pozisyonlarını gösterir |
| Put/Call Oranı | Seçenek piyasası duyarlılığını ölçer |
| Korku & Açgözlülük Endeksi | Piyasanın genel duygusunu ölçer |
Piyasa duyarlılığını anlamak, fiyat hareketlerine bağlam sağlamak ve potansiyel trend dönüşlerini tahmin etmeye yardımcı olabilir.
Forex Analizi için Anahtar Göstergeler
Gerekli verileri topladıktan sonra, forex ticaretine nasıl başlanacağına dair bir sonraki adım, bunları anahtar göstergeler kullanarak analiz etmektir. Bu göstergeler, piyasa davranışını ve trader performansını nicelleştirmeye yardımcı olur.
Teknik Analiz Göstergeleri
Teknik analiz, fiyat grafiklerini incelemeyi ve gelecekteki fiyat hareketlerini tahmin etmek için çeşitli göstergeler kullanmayı içerir. Bazı temel teknik analiz göstergeleri şunlardır:
- Hareketli Ortalamalar (MA)
- Göreceli Güç Endeksi (RSI)
- Bollinger Bantları
- MACD (Hareketli Ortalama Yakınsama Diverjansı)
Bu göstergelerden birinin nasıl hesaplanacağını ve yorumlanacağını görelim: Basit Hareketli Ortalama (SMA).
| Adım | Hareket |
|---|---|
| 1 | Bir zaman dilimi seçin (örneğin, 10 gün) |
| 2 | O dönemdeki kapanış fiyatlarını toplayın |
| 3 | Toplamı dönem sayısına bölün |
Örneğin, 10 günlük bir SMA hesaplıyorsanız ve kapanış fiyatlarının toplamı 150 ise, SMA 150 / 10 = 15 olacaktır.
Temel Analiz Göstergeleri
Temel analiz, para birimi değerlerini etkileyen ekonomik faktörlere odaklanır. Anahtar göstergeler şunlardır:
- Faiz Oranı Farkları
- Satın Alma Gücü Paritesi (PPP)
- Ticaret Dengesi
Faiz Oranı Farkının hesaplanmasını inceleyelim:
| Adım | Hareket |
|---|---|
| 1 | Bir çiftteki her iki para biriminin faiz oranlarını belirleyin |
| 2 | Daha düşük oranı daha yüksek oranından çıkarın |
Örneğin, USD’nin faiz oranı %2 ve EUR’nun %1 ise, EUR/USD için faiz oranı farkı %1 olacaktır.
Forex Analiz Sonuçlarını Yorumlama
Forex analiz sonuçlarınızı yorumlamak, forex ticaretine nasıl başlanacağına dair öğrenirken kritik öneme sahiptir. Farklı analiz türlerinin yorumlanmasına yaklaşımınız şöyle olmalıdır:
Teknik Analiz Yorumlama
Teknik analiz sonuçlarını yorumlarken şunlara dikkat edin:
- Trend onayları
- Destek ve direnç seviyeleri
- Aşırı alım veya aşırı satım koşulları
- Fiyat ve göstergeler arasındaki farklılıklar
Örneğin, fiyat bir hareketli ortalamanın üzerine çıkarsa, bu bir yükseliş trendinin başlangıcını gösterebilir.
Temel Analiz Yorumlama
Temel analizi yorumlarken:
- Gerçek verileri tahminlerle karşılaştırın
- Daha geniş ekonomik bağlamı dikkate alın
- Farklı göstergeler arasındaki farklılıkları arayın
Örneğin, GSYİH büyümesi beklenenden yüksekse, bu para biriminin değer kazanmasına yol açabilir.
Forex Ticaretinde Risk Yönetimi
Risk yönetimi, forex ticaretine nasıl başlanacağına dair kritik bir unsurdur. Bu, sermayenizi korumak ve potansiyel getirileri maksimize etmek için matematiksel kavramlar kullanmayı içerir.
Pozisyon Büyüklüğü
Pozisyon büyüklüğü, her ticarette ne kadar sermaye riske atacağınızı belirler. Yaygın bir yöntem, yüzde risk modelidir:
| Adım | Hareket |
|---|---|
| 1 | Ticaret başına riske atacağınız hesap yüzdesini belirleyin (örneğin, %1) |
| 2 | Bu miktarın dolar cinsinden değerini hesaplayın |
| 3 | Bunu para birimi çiftinin pip başına değerine bölün |
Bu hesaplama, herhangi bir ticarette kaybetmekten rahatsız olmayacağınızdan daha fazlasını riske atmadığınızdan emin olmanıza yardımcı olur.
Risk-Ödül Oranı
Risk-ödül oranı, bir ticaretin potansiyel kârını potansiyel kaybıyla karşılaştırır. Yaygın bir kılavuz, en az 1:2 oranını hedeflemektir; bu, potansiyel ödülün en az iki katı risk olduğu anlamına gelir.
| Risk-Ödül Oranı | Yorumlama |
|---|---|
| 1:1 | Eşit risk ve ödül (tavsiye edilmez) |
| 1:2 | Potansiyel ödül, riskin iki katı (minimum önerilen) |
| 1:3 | Potansiyel ödül, riskin üç katı (ideal) |
Bu risk yönetimi ilkelerini sürekli olarak uygulayarak, forex ticaretine nasıl başlanacağına dair öğrenirken sermayenizi koruyabilirsiniz.
Geri Test ve İleri Test
Forex ticaretine nasıl başlanacağına dair öğrenmenin önemli bir parçası, stratejilerinizi test etmektir. Bu, iki ana yaklaşımı içerir: geri test ve ileri test.
Geri Test
Geri test, ticaret stratejinizi tarihsel verilere uygulayarak nasıl performans gösterdiğini görmeyi içerir. İşte temel bir süreç:
- Belirli bir zaman dilimi seçin
- Strateji kurallarınızı tarihsel verilere uygulayın
- Sonuçları kaydedin (kazançlar, kayıplar, kâr/zarar)
- Anahtar performans göstergelerini hesaplayın
Geri testte dikkate alınması gereken anahtar göstergeler şunlardır:
| Gösterge | Açıklama |
|---|---|
| Kazanç Oranı | Kazanan ticaretlerin yüzdesi |
| Ortalama Kazanç/Kayıp | Kazanan ticaret başına ortalama kâr ile kaybeden ticaret başına ortalama kaybı karşılaştırır |
| Maksimum Çekilme | Hesap değerindeki en büyük zirveden çukura düşüş |
| Sharpe Oranı | Risk ayarlı getirinin ölçüsü |
İleri Test
İleri test, kağıt ticareti olarak da bilinir, stratejinizi gerçek para riske atmadan mevcut piyasa koşullarına uygulamayı içerir. Bu, geri test sonuçlarınızı doğrulamaya yardımcı olur ve gerçek zamanlı piyasa dinamiklerini deneyimlemenizi sağlar.
İleri test yaparken:
- Bir demo hesabı veya kağıt ticaret platformu kullanın
- Strateji kurallarınıza sıkı bir şekilde uyun
- Tüm ticaretleri ve sonuçları kaydedin
- Sonuçları geri test verilerinizle karşılaştırın
Geri test ve ileri testi birleştirerek, stratejinizi geliştirebilir ve gerçek para ile ticaret yapmadan önce güven kazanabilirsiniz.
Sürekli Öğrenme ve Uyum Sağlama
Forex piyasası dinamik bir yapıya sahiptir ve başarılı trader’lar sürekli öğrenir ve uyum sağlar. Forex ticaretine nasıl başlanacağı yolculuğunuzda, bu yaklaşımları dikkate alın:
- Kararlarınıza dair bir ticaret günlüğü tutun ve analiz edin
- Ticaret planınızı düzenli olarak gözden geçirin ve güncelleyin
- Küresel ekonomik olaylar hakkında bilgi sahibi olun
- Yeni analiz tekniklerini ve araçlarını keşfedin
Unutmayın, Pocket Option gibi platformlar, forex trader’ı olarak sürekli öğrenme ve gelişiminizi desteklemek için kaynaklar ve araçlar sunar.
Sonuç
Sonuç olarak, forex ticaretine nasıl başlanacağını öğrenmek, matematiksel ve analitik becerilerde sağlam bir temel gerektirir. Veri toplama, anahtar göstergeler ve sonuç yorumlama konularında ustalaşarak, sağlam bir ticaret stratejisi geliştirebilirsiniz. Risk yönetimine odaklanmayı, yaklaşımınızı sürekli test etmeyi ve geliştirmeyi unutmayın ve sürekli öğrenmeye bağlı kalın. Özveri ve dikkatli analiz ile forex piyasasının karmaşıklıklarını aşabilir ve başarılı bir trader olma yolunda ilerleyebilirsiniz.
FAQ
Forex ticareti için en önemli ekonomik göstergeler nelerdir?
En kritik ekonomik göstergeler arasında GSYİH büyüme oranı, enflasyon oranı, istihdam rakamları ve merkez bankaları tarafından belirlenen faiz oranları bulunmaktadır.
Forex ticaretinde risk-getiri oranını nasıl hesaplarım?
Risk-ödül oranını hesaplamak için potansiyel kârınızı potansiyel zararınıza bölün. Örneğin, eğer $100 risk ediyorsanız ve potansiyel olarak $300 kazanıyorsanız, risk-ödül oranınız 1:3'tür.
Forex ticaretinde teknik analiz ile temel analiz arasındaki fark nedir?
Teknik analiz, fiyat grafiklerine ve istatistiksel göstergelere odaklanırken, temel analiz ekonomik, sosyal ve politik güçleri inceleyerek döviz değerlerini etkileyebilecek unsurları değerlendirir.
Forex ticaret stratejimi ne sıklıkla geri test etmeliyim?
Stratejinizi düzenli olarak geri test etmeniz önerilir, özellikle piyasa koşulları değiştiğinde veya ticaret kurallarınızda ayarlamalar yaptığınızda. En azından üç ayda bir geri test oturumları hedefleyin.
Kaldıraç, forex ticaretinde ne rol oynar ve acemiler bunu nasıl yaklaşmalıdır?
Kaldıraç, yatırımcıların daha küçük bir sermaye ile daha büyük pozisyonlar kontrol etmelerini sağlar. Karları artırabilse de, riski de artırır. Yeni başlayanlar, düşük kaldıraçla (varsa) başlamalı ve ticaret stratejilerinde deneyim ve güven kazandıkça bunu kademeli olarak artırmalıdır.
Ticaret Stratejileri
Sign up for more like this
Customize your newsfeed with content you're actually interested in — get up-to-date personalized newsletter in your inbox.
Your comment
Comments are pre-moderated to ensure they comply with our blog guidelines.