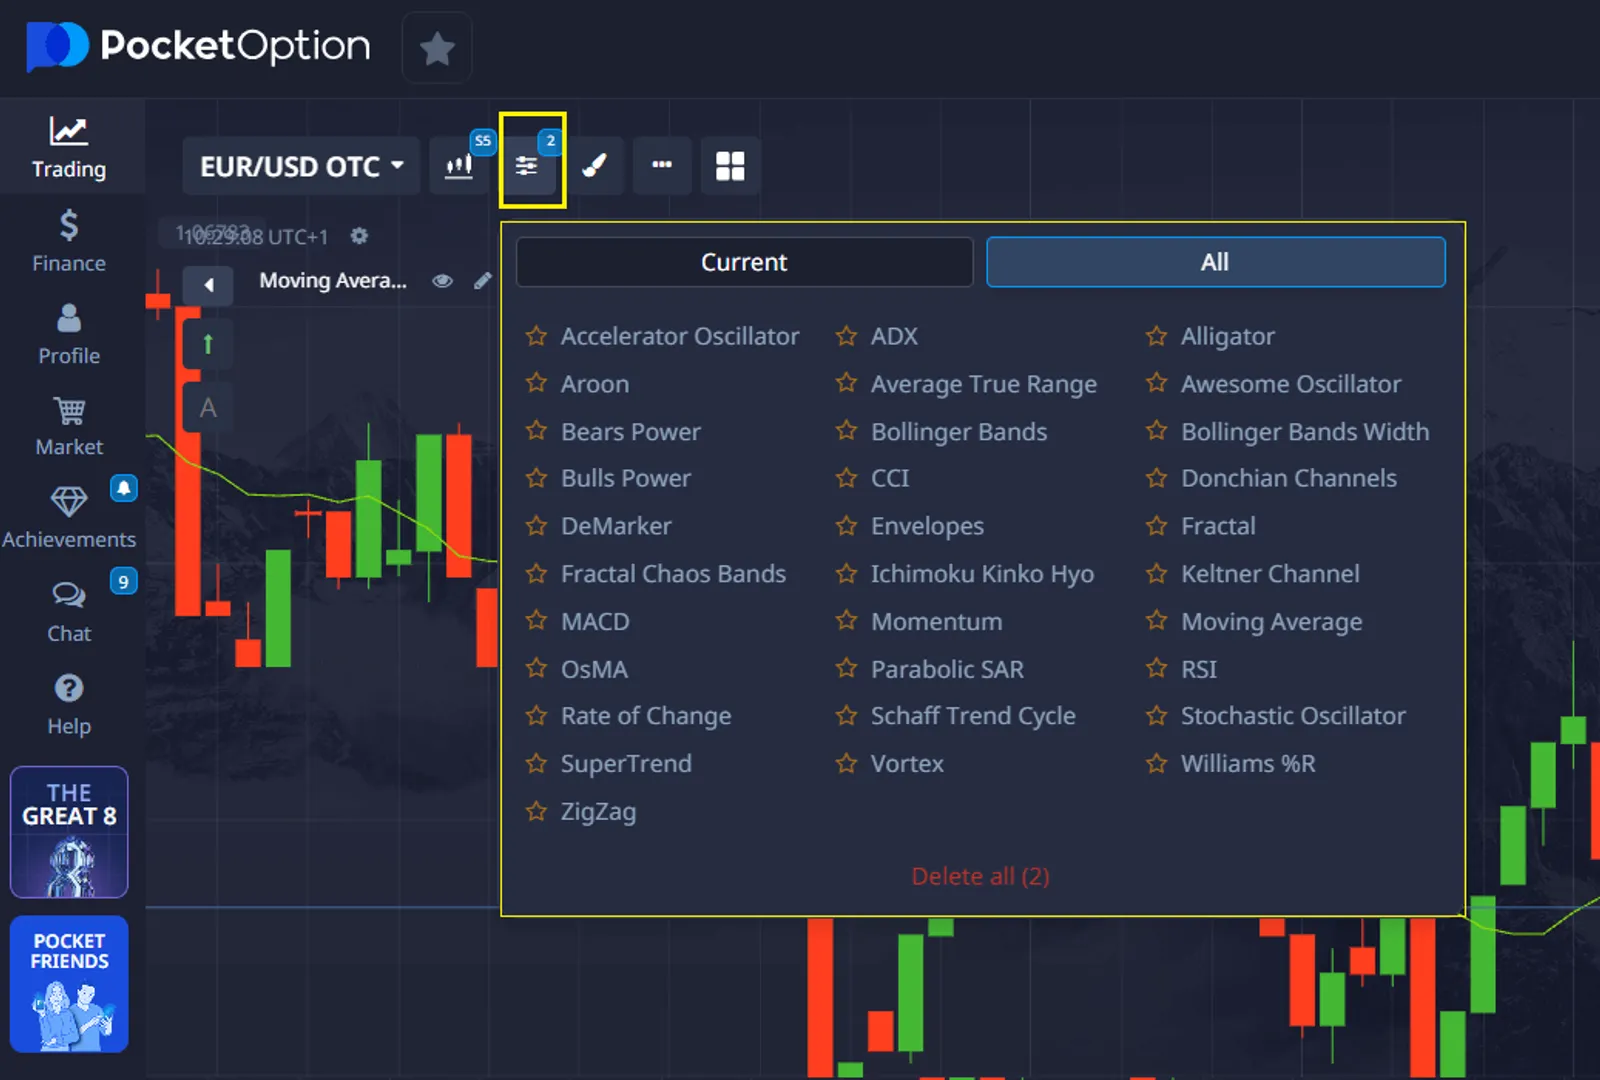
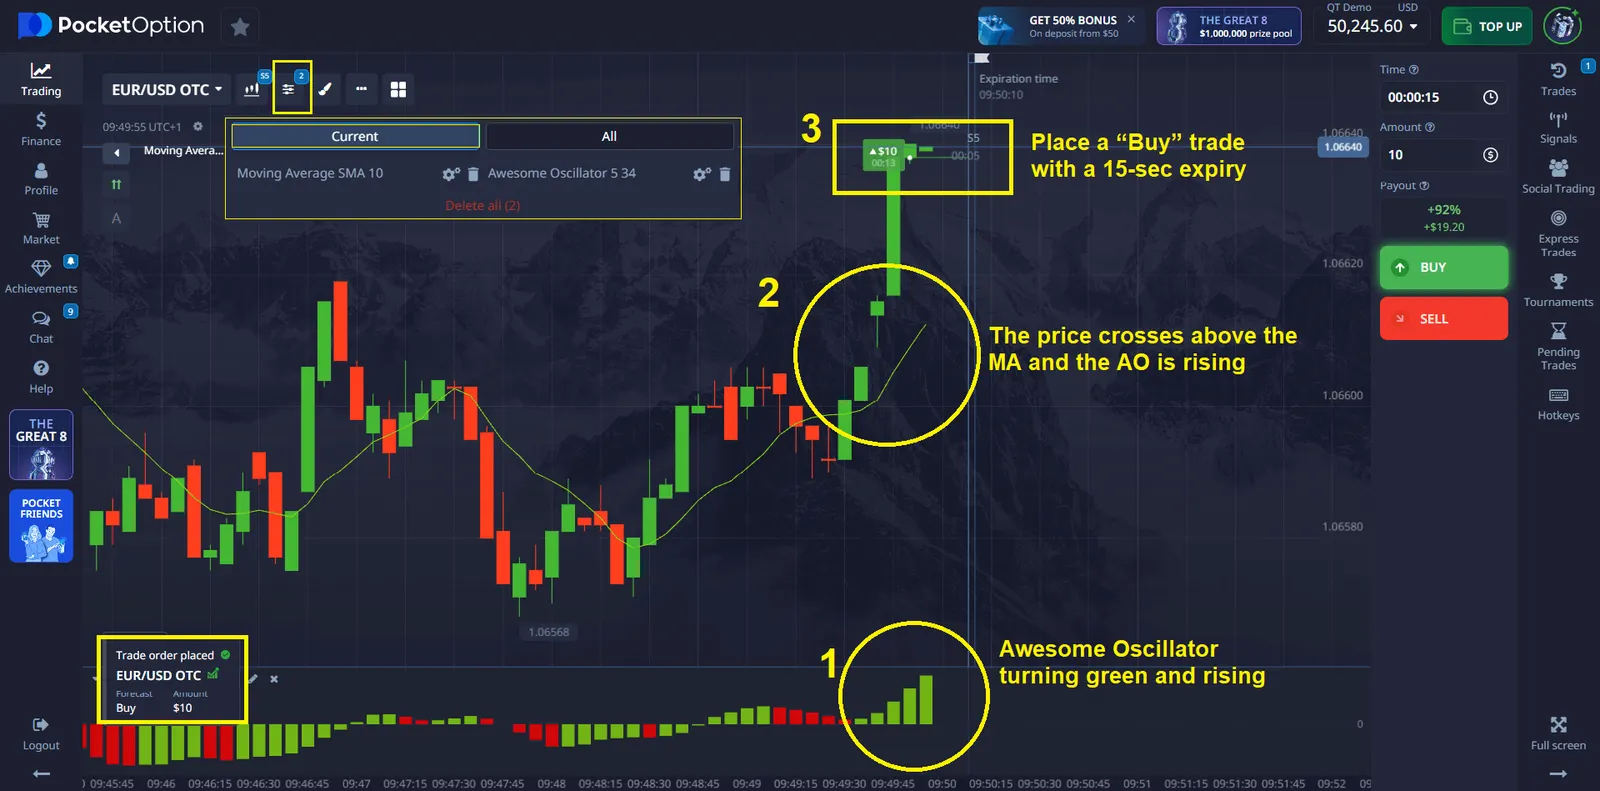
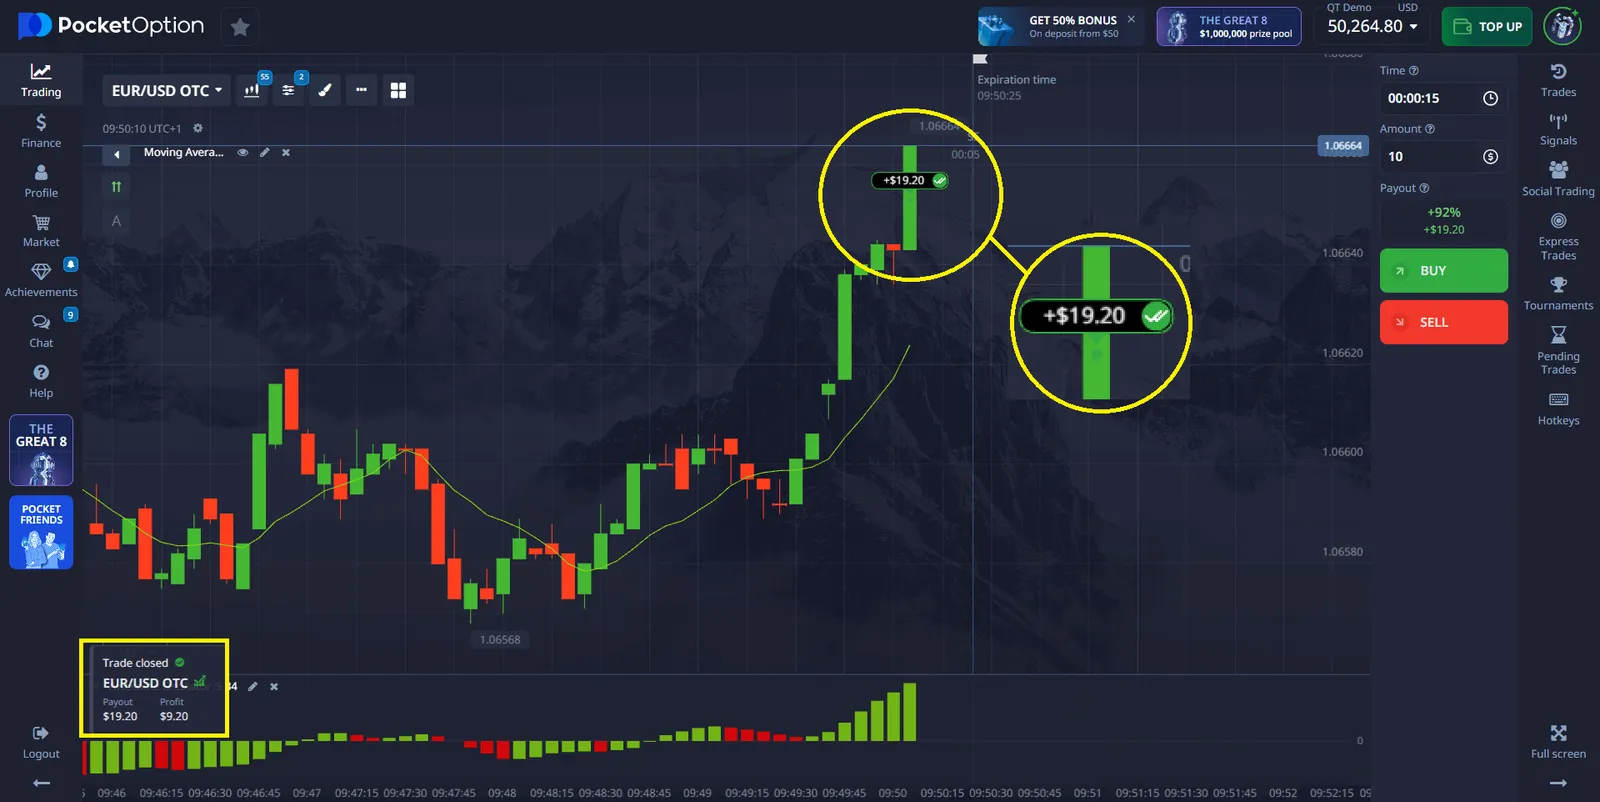
- Standard volume shows participation across time (horizontal axis)
- Volume Profile displays participation across price (vertical axis)
- Combined analysis reveals both when and where significant transactions occurred
Pocket Option Pocket Option Volume Indicator

Mastering the Pocket Option volume indicator gives traders exceptional insights into market movements invisible through price analysis alone. This guide equips you with practical volume-based strategies, interpretation frameworks, and application techniques that reveal institutional money flows and potential price shifts before they become obvious to most market participants.
The Pocket Option volume indicator serves as a fundamental analytical tool, revealing the intensity of market participation behind price movements. Unlike price-only analysis, volume provides crucial context about the conviction and sustainability of market trends, offering early signals about potential reversals and continuations.
Volume represents the total transactions occurring within a specific timeframe, essentially measuring market interest and participation levels. High volume indicates strong institutional involvement, while decreasing volume often signals waning interest that precedes important market shifts.
The volume indicator in Pocket Option displays as a histogram beneath the price chart, with each bar representing total transactions for the corresponding price candle. Taller bars show higher participation, while shorter bars indicate reduced activity. Color differences highlight whether volume occurred during bullish or bearish price movement.
Volume Pattern | Market Interpretation | Trading Action |
---|---|---|
Rising volume with rising price | Strong bullish conviction | Consider long positions |
Rising volume with falling price | Strong bearish pressure | Consider short positions |
Declining volume with rising price | Weakening bullish momentum | Prepare for possible reversal |
Declining volume with falling price | Diminishing selling pressure | Watch for reversal signals |
What makes volume analysis valuable is its leading indicator characteristics. While price shows what has happened, volume often provides early warnings about what might happen next. This anticipatory quality gives traders using Pocket Option volume indicator a significant edge in positioning before major moves occur.
Pocket Option provides several sophisticated volume analysis tools with customizable parameters to match different trading approaches. Understanding these settings allows you to optimize the indicator for your specific strategy and timeframe.
The standard volume indicator in Pocket Option offers several customization options that enhance its analytical value. These adjustments help filter market noise while highlighting the most relevant volume patterns for your trading method.
Configuration Setting | Function | Optimal Setting |
---|---|---|
Period Setting | Calculation lookback period | 14-21 for swing trading, 5-9 for day trading |
Moving Average Type | Smoothing algorithm | EMA for faster response, SMA for stability |
Color Scheme | Visual representation | Red/Green for direction, gradient for intensity |
Volume Threshold | Highlights abnormal levels | 150% of 20-period average volume |
Beyond the standard volume histogram, Pocket Option offers advanced volume-based indicators including On-Balance Volume (OBV), Volume-Weighted Average Price (VWAP), and the Accumulation/Distribution Line. Each provides unique insights into different aspects of market participation.
A powerful configuration combines the standard volume indicator with the Volume Profile tool in Pocket Option. This combination creates a multi-dimensional view of market participation across both time and price levels, revealing critical support and resistance zones based on historical transaction intensity.
This integrated approach identifies "high-volume nodes" – price levels where exceptional transaction activity occurred. These levels often serve as magnets for future price movement, creating predictable reaction zones that can be incorporated into trading strategies with remarkable precision.
Professional trader Daniel M. reports: "Configuring the volume indicator in Pocket Option with a 14-period setting and combining it with Volume Profile analysis improved my win rate from 62% to 78% over a six-month period. The ability to identify high-volume price levels completely transformed my understanding of market structure."
Effective application of the Pocket Option volume indicator requires understanding several fundamental analytical approaches. These frameworks help traders interpret volume data systematically rather than subjectively, creating consistent and repeatable analysis.
Volume analysis operates on several core principles that remain consistent across different markets and timeframes. These foundational concepts form the basis for more advanced interpretive frameworks.
Analysis Method | Core Principle | Practical Application |
---|---|---|
Volume Confirmation | Valid price movements require appropriate volume | Verify breakouts show volume expansion |
Volume Divergence | Price/volume disagreement signals potential reversal | Watch for declining volume during price trends |
Volume Climax | Extremely high volume often marks exhaustion points | Look for reversal after volume spikes |
Volume Absence | Low volume suggests lack of conviction | Consider price moves during low volume as less reliable |
The volume indicator in Pocket Option becomes particularly powerful when applied within these methodological frameworks. The platform's visualization capabilities make pattern identification more intuitive, especially for traders developing their volume analysis skills.
An advanced methodology worth mastering is Volume Spread Analysis (VSA), which examines the relationship between price range, closing position, and corresponding volume. This approach reveals institutional trading patterns often invisible through conventional analysis.
VSA identifies specific bar configurations that signal professional accumulation or distribution. These patterns often precede significant price movements and provide high-probability entry opportunities with clearly defined risk parameters.
- No Demand Bar: Narrow range, upward close, low volume (bearish)
- No Supply Bar: Narrow range, downward close, low volume (bullish)
- Stopping Volume: Wide range, reversal close, high volume (potential trend change)
- Effort vs. Result: Large volume with minimal price movement (institutional absorption)
Trading veteran Sarah K. notes: "Implementing VSA with the Pocket Option volume indicator transformed my trading. I identified a stopping volume pattern on EUR/USD that preceded a 120-pip reversal, allowing precise entry with minimal risk. The volume told the story before price confirmed the move."
To maximize the value of the Pocket Option volume indicator, experienced traders develop integrated frameworks that combine volume analysis with complementary price-based methodologies. These synthesis models create a comprehensive market view impossible through single-indicator approaches.
The most effective trading approaches use volume not as an isolated indicator but as a confirmation tool within a broader analytical framework. This integration substantially increases signal reliability while reducing false positives.
Integration Strategy | Components | Key Benefit |
---|---|---|
Volume-Pattern Confirmation | Chart patterns + volume characteristics | Validates pattern reliability |
Volume-Trend Integration | Trend indicators + volume profile | Identifies sustainable trends |
Volume-Support/Resistance Validation | Key price levels + historical volume | Reveals genuine institutional interest zones |
Volume-Momentum Divergence | Momentum oscillators + volume trends | Provides early trend exhaustion warnings |
The volume indicator in Pocket Option facilitates these integration strategies through its multi-chart interface and indicator overlay capabilities. This technical architecture enables traders to visualize complex relationships between volume and other market factors simultaneously.
A particularly effective integration combines volume analysis with support/resistance levels and candlestick patterns. This three-factor approach creates a powerful analytical framework that substantially increases trade probability.
Factor | Signal Requirement | Analysis Contribution |
---|---|---|
Price Level | Approach to established support/resistance | Provides location context for potential reversal |
Candlestick Pattern | Formation of reversal or continuation pattern | Offers short-term directional bias |
Volume Confirmation | Appropriate volume signature for pattern | Validates pattern through participation analysis |
Professional trader Michael R. explains: "I don't take any trade without volume confirmation. Using the three-factor approach with Pocket Option's volume tools has increased my win rate from 59% to 76%. The volume component eliminates many false signals that would otherwise look compelling based on price alone."
Converting volume analysis into practical trading strategies requires developing specific methodologies with clear entry, exit, and risk management parameters. These actionable approaches transform conceptual understanding into concrete trading results.
This high-probability approach focuses on confirming price breakouts through volume expansion. The strategy filters potential false breakouts by requiring corresponding volume increases that validate the significance of the price movement.
Implementation follows a specific protocol with clearly defined parameters:
- Identify established price pattern (range, triangle, channel)
- Wait for price break beyond pattern boundary
- Confirm breakout with volume at least 150% of 20-period average
- Enter position in breakout direction with stop below/above pre-breakout level
- Target minimum 1:2 risk-reward ratio based on pattern measurements
This methodology addresses one of trading's most common challenges: distinguishing between genuine breakouts and false moves designed to trap inexperienced traders. The volume component provides crucial validation that substantially improves success rates.
Strategy Element | Specific Parameters | Implementation Notes |
---|---|---|
Pattern Identification | Minimum 5 touches of pattern boundaries | Longer patterns provide more reliable breakouts |
Breakout Criteria | Full candle close beyond boundary | Avoid entering on wicks or partial breaks |
Volume Threshold | 150% of 20-period volume average | Higher thresholds indicate stronger conviction |
Entry Timing | After confirmation candle closes | Patience reduces false breakout exposure |
Trader Jason L. reports: "I implemented the Volume Breakout Verification strategy using the Pocket Option volume indicator across 87 trades over six months. The approach produced a 72% win rate with an average reward-to-risk ratio of 2.4:1, significantly outperforming my previous results without volume confirmation."
Volume divergence represents one of the most powerful analytical concepts available to traders. This phenomenon occurs when price and volume move in contradictory directions, often signaling impending reversals before price action confirms the change.
The Volume Divergence Detection Framework provides a systematic approach for identifying and trading these high-probability reversal setups. The methodology focuses specifically on detecting situations where price continues moving in one direction while volume progressively declines – a classic warning sign of trend exhaustion.
Divergence Type | Pattern Characteristics | Trading Implication |
---|---|---|
Bullish Price/Declining Volume | Rising price with progressively lower volume | Potential uptrend exhaustion |
Bearish Price/Declining Volume | Falling price with progressively lower volume | Potential downtrend exhaustion |
New High/Lower Volume | Price makes new high but volume is lower than previous high | Classic reversal warning |
New Low/Lower Volume | Price makes new low but volume is lower than previous low | Potential bottoming process |
The volume indicator in Pocket Option makes divergence identification intuitive through its clear visual representation. The color-coded volume bars highlight directional characteristics, making pattern recognition significantly easier for traders at all experience levels.
Trader Emma T. shares: "Using the volume divergence framework with Pocket Option volume indicator completely changed my approach to reversal trading. I identified a classic divergence setup on USD/JPY that preceded a 95-pip reversal, allowing me to enter near the exact turning point with minimal risk exposure."
The Pocket Option volume indicator provides traders with a window into market psychology that price action alone cannot deliver. By analyzing transaction intensity and distribution, you gain crucial insights into institutional positioning and potential future price movements before they become obvious in the price chart.
Effective volume analysis requires developing both technical understanding and intuitive pattern recognition. The frameworks and strategies outlined in this analysis provide structured approaches for evolving from basic volume concepts to sophisticated trading applications that consistently identify high-probability opportunities.
Perhaps most importantly, volume analysis represents a skill that maintains its effectiveness regardless of market conditions. While many indicators lose reliability during changing environments, volume continues to reveal genuine market dynamics because it measures actual participation rather than derivative calculations.
Begin by mastering the fundamental volume-price relationships, then progressively implement the structured methodologies described here. With dedicated practice and systematic implementation, the volume indicator in Pocket Option will transform from a supplementary tool into a cornerstone of your trading approach – revealing market insights previously hidden from view.
FAQ
How do I access and configure the volume indicator on the Pocket Option platform?
To access the volume indicator in Pocket Option, open your chart and click the "Indicators" button in the bottom toolbar. Select "Volume" from the indicator list. Once added, customize its appearance by right-clicking on the indicator and selecting "Settings." Key configuration options include color scheme (typically green for up-volume and red for down-volume), period settings (14-21 is standard for swing trading), and visualization style (histogram is most common). You can also adjust the position and scale of the indicator to optimize visual analysis.
What's the difference between regular volume and On-Balance Volume (OBV) in Pocket Option?
The standard volume indicator in Pocket Option displays the total transaction amount for each individual time period as a histogram, showing participation intensity regardless of price direction. On-Balance Volume (OBV), however, is a cumulative indicator that adds volume on up days and subtracts volume on down days, creating a running total that reveals buying/selling pressure over time. OBV helps identify underlying momentum not visible in the regular volume display and can signal potential reversals when it diverges from price. Both tools are valuable but serve different analytical purposes.
How can I identify fake breakouts using volume analysis?
Genuine breakouts typically show significantly higher volume (at least 150% of the 20-period average) as price moves beyond resistance or support. To spot fake breakouts using the Pocket Option volume indicator, watch for breakout attempts with below-average or declining volume – these often fail and reverse quickly. The most reliable volume signature shows progressively increasing volume leading up to the breakout point, followed by a substantial volume surge as price breaks through. Wait for a full candle close beyond the level with confirming volume before entering, rather than chasing the initial movement.
What volume patterns signal potential market reversals?
Several volume patterns reliably signal potential reversals: 1) Volume climax – extremely high volume after an extended trend often indicates exhaustion, 2) Volume divergence – when price makes new highs/lows but volume fails to confirm with declining participation, 3) Stopping volume – a wide-range bar with exceptionally high volume that halts the prevailing trend, and 4) Low-volume tests – when price approaches previous extremes but with significantly lower volume than the original move. These patterns work because they reveal changes in institutional positioning and sentiment before price fully reflects the shift.
Can volume analysis be effective for binary options trading on Pocket Option?
Volume analysis is particularly valuable for binary options trading on Pocket Option because it helps identify high-probability entry points with clear directional bias. The most effective application involves using volume to confirm short-term price movements rather than as a standalone indicator. For specific binary option strategies, focus on volume surges at support/resistance levels, volume confirmation of candlestick patterns, and volume divergences near price extremes. These approaches help identify the timing and direction of price movements with the precision required for successful binary options trading within compressed timeframes.