- Moving Averages – Help identify trend direction and potential support/resistance levels
- Relative Strength Index (RSI) – Measures the speed and change of price movements
- MACD (Moving Average Convergence Divergence) – Shows relationship between two moving averages
- Bollinger Bands – Display volatility and potential price boundaries
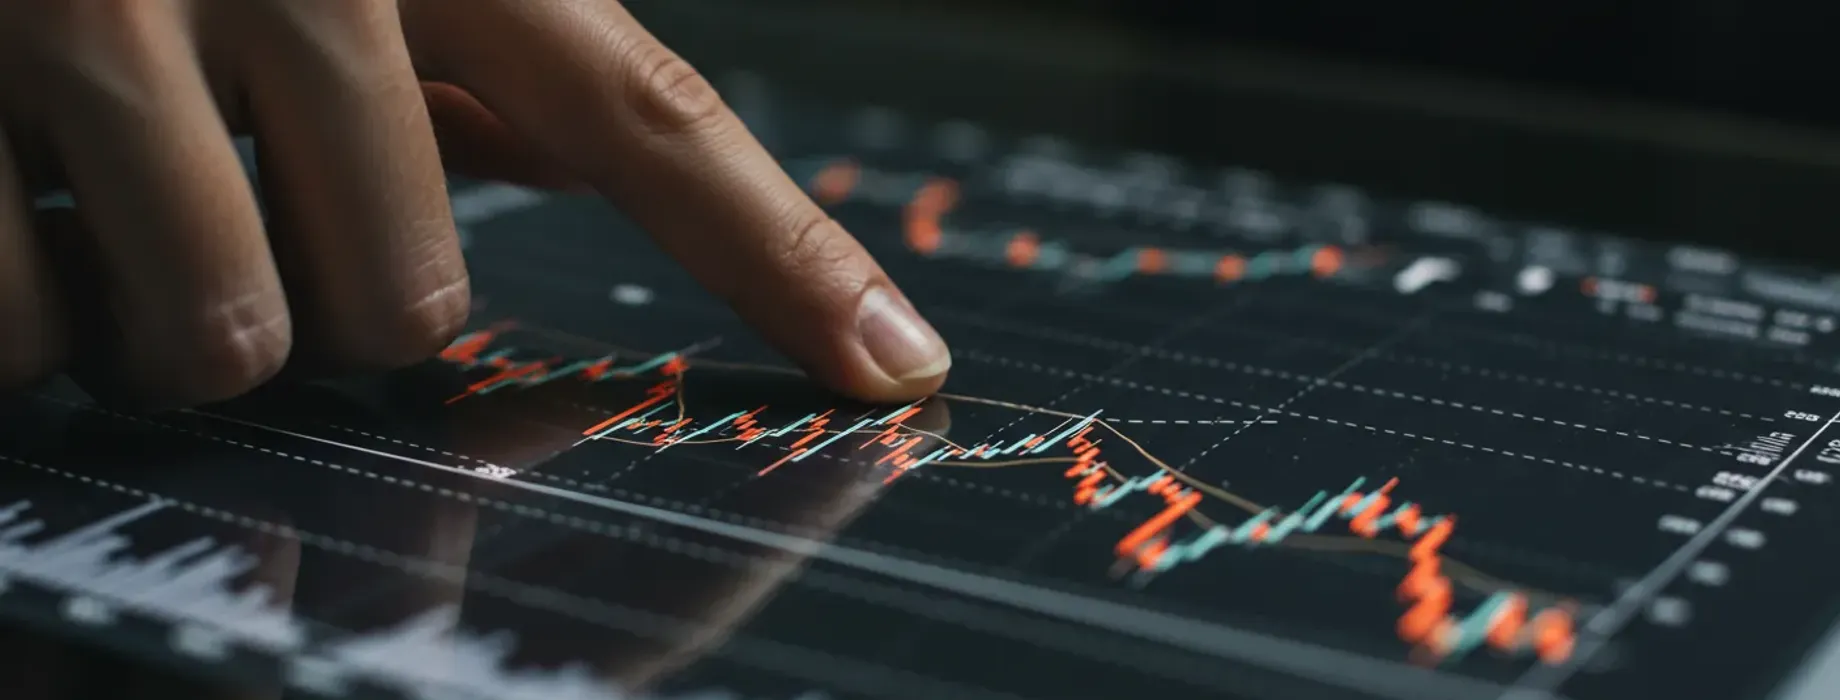
Technical analysis forms the backbone of successful day trading strategies. By studying charts and indicators, traders can identify potential entry and exit points. Day trading technical analysis requires discipline, practice, and knowledge of specific tools that help predict price movements.
What is Technical Analysis in Day Trading?
Technical analysis for day trading involves studying price charts and using statistical indicators to identify trading opportunities. Unlike fundamental analysis, which focuses on company financials and economic factors, technical analysis examines price movements to predict future market behavior.
Day traders who use technical analysis believe that historical price patterns tend to repeat, making it possible to make informed trading decisions. This approach is particularly useful for short-term traders who need to make quick decisions throughout the trading day.
Essential Technical Indicators for Day Traders
Successful technical analysis day trading relies on understanding and using the right indicators. Here are some essential tools that day traders commonly use:
Chart Patterns in Day Trading
Recognizing chart patterns is a key skill in day trading technical analysis. These patterns can signal potential reversals or continuations in price movement.
| Pattern | Signal Type | Trading Implication |
|---|---|---|
| Head and Shoulders | Reversal | Potential end of uptrend |
| Double Bottom | Reversal | Possible upward movement after downtrend |
| Flag Pattern | Continuation | Brief consolidation before continuing trend |
| Triangle Pattern | Continuation or Reversal | Period of consolidation before breakout |
Timeframes for Day Trading Analysis
The choice of timeframe significantly impacts your technical analysis strategy. Day traders typically use shorter timeframes compared to position or swing traders.
| Timeframe | Best for | Considerations |
|---|---|---|
| 1-minute | Scalping | Very fast-paced, high stress |
| 5-minute | Short-term day trading | Balanced between detail and noise |
| 15-minute | Standard day trading | Filters out some market noise |
| 1-hour | Longer day trading positions | Better for trending markets |
Volume Analysis in Day Trading
Volume confirms price movements and is an essential component of day trading technical analysis. High volume during price moves suggests stronger conviction behind the movement.
- Rising prices with increasing volume indicates strength in the upward trend
- Rising prices with decreasing volume may signal a potential reversal
- Falling prices with increasing volume shows strength in the downward trend
- Falling prices with decreasing volume might indicate a weakening downtrend
Support and Resistance Levels
Identifying support and resistance levels is fundamental to technical analysis for day trading. These price levels often act as barriers where market psychology comes into play.
| Level Type | Description | Trading Strategy |
|---|---|---|
| Support | Price level where downtrend pauses | Potential buying opportunity |
| Resistance | Price level where uptrend pauses | Potential selling opportunity |
| Dynamic Support/Resistance | Moving levels (e.g., moving averages) | Adjusts with recent price action |
Risk Management in Technical Analysis
Even the best technical analysis cannot eliminate risk. Successful day traders incorporate solid risk management into their trading plan.
- Set stop-loss orders based on technical levels
- Determine position size based on account risk percentage
- Use profit targets aligned with support/resistance levels
- Consider risk-reward ratios for each trade
Technical Analysis Platforms
Many platforms offer advanced charting capabilities for day trading technical analysis. Pocket Option provides traders with comprehensive technical analysis tools suitable for various trading styles.
| Platform Feature | Importance for Day Traders |
|---|---|
| Real-time data | Critical for timely decisions |
| Multiple indicators | Allows for confirmation across signals |
| Customizable layouts | Improves workflow efficiency |
| Alert systems | Notifies of potential setups |
Common Mistakes in Day Trading Technical Analysis
Many day traders make predictable errors when applying technical analysis. Being aware of these pitfalls can improve trading outcomes.
- Over-reliance on a single indicator
- Ignoring market context and broader trends
- Forcing trades when clear setups aren’t present
- Failing to adapt analysis to changing market conditions
Conclusion
Day trading technical analysis provides traders with structured methods to interpret market movements and make trading decisions. By combining multiple indicators, understanding chart patterns, and practicing proper risk management, traders can develop consistent strategies. Remember that technical analysis is both art and science – it requires practice, patience, and continuous learning to master. The markets are constantly evolving, so successful traders must remain adaptable while maintaining discipline in their approach.
FAQ
How long does it take to become proficient in day trading technical analysis?
Most traders need several months of consistent practice to develop solid technical analysis skills. The learning curve varies based on your background, study habits, and trading frequency. Focus on mastering one indicator or pattern at a time rather than trying to learn everything at once.
Can technical analysis predict market movements with certainty?
No, technical analysis cannot predict market movements with 100% certainty. It provides probability-based insights that can guide decision-making. Successful traders use technical analysis as one component of a comprehensive trading strategy that includes risk management.
What's the difference between technical analysis for day trading versus longer timeframes?
Technical analysis for day trading focuses on shorter timeframes (1-minute to 1-hour charts) and emphasizes immediate price action. Longer-term analysis typically uses daily or weekly charts and may incorporate broader trend analysis. Day traders need to make quicker decisions based on technical signals.
How many technical indicators should I use for day trading?
Most experienced day traders use 2-4 complementary indicators rather than crowding charts with too many tools. Using too many indicators can create confusion and conflicting signals. Focus on understanding a few indicators deeply rather than using many superficially.
Is technical analysis more effective in certain market conditions?
Yes, technical analysis tends to work better in trending markets with good volume. During highly volatile periods or significant news events, technical patterns may break down temporarily. Different technical approaches work better in different market conditions, so adaptability is important.