- 4 typy wykresów: Świecowe, Słupkowe, Liniowe, Heiken-Ashi
- Ponad 30 wskaźników technicznych: W tym RSI, MACD, Wstęgi Bollingera
- 9 narzędzi do rysowania: Linie trendu, poziomy i więcej
Zaawansowane Narzędzia i Metody Rozpoznawania Wzorców Wykresów do Analizy Technicznej

Updated on 06 lip 2025
Analiza techniczna w dużej mierze opiera się na rozpoznawaniu wzorców wykresów w celu identyfikacji potencjalnych ruchów rynkowych. Nowoczesne narzędzia i platformy programowe uczyniły ten proces bardziej dostępnym i dokładnym dla traderów o wszystkich poziomach doświadczenia.
Article navigation
- Czym Jest Rozpoznawanie Wzorców Wykresów?
- Popularne Wzorce Wykresów
- Jak Korzystać z Wzorców na Pocket Option
- Przykład: Zastosowanie Wzorca w Transakcji
- Wskazówki dla Początkujących
- Kluczowe Aspekty Podczas Korzystania z Wzorców
- Pocket Option: Platforma Stworzona do Analizy Wykresów
- Ucz się Strategii w Sekcji Pomocy
- Podsumowanie
Czym Jest Rozpoznawanie Wzorców Wykresów?
Rozpoznawanie wzorców wykresów to metoda stosowana w analizie technicznej, która pomaga zrozumieć, dokąd może zmierzać rynek. Polega na identyfikowaniu powtarzających się kształtów (takich jak trójkąty czy formacja głowy i ramion) na wykresach cenowych. Te kształty wielokrotnie pojawiały się w przeszłości i często sygnalizują potencjalne ruchy cenowe w górę lub w dół.
Te wzorce nie są przypadkowe — odzwierciedlają zachowanie traderów: kupowanie, sprzedawanie, wahanie lub panikę. Dlatego są używane jako sygnały do otwierania lub zamykania transakcji.
✔️ Czy wiesz, jak rozpocząć handel z 5$? Tutaj znajdziesz wszystkie szczegóły
Popularne Wzorce Wykresów
| Wzorzec | Jak Rozpoznać | Prognoza Ruchu Ceny | Przybliżona Dokładność |
|---|---|---|---|
| Trójkąt | Zbieżne linie wsparcia i oporu | Wybicie w górę lub w dół | 65–75% |
| Głowa i Ramiona | Trzy szczyty, środkowy wyższy niż boczne | Odwrócenie w dół | 70–80% |
| Podwójny Szczyt/Dno | Cena osiąga ten sam poziom dwukrotnie | Odwrócenie trendu | 60–70% |
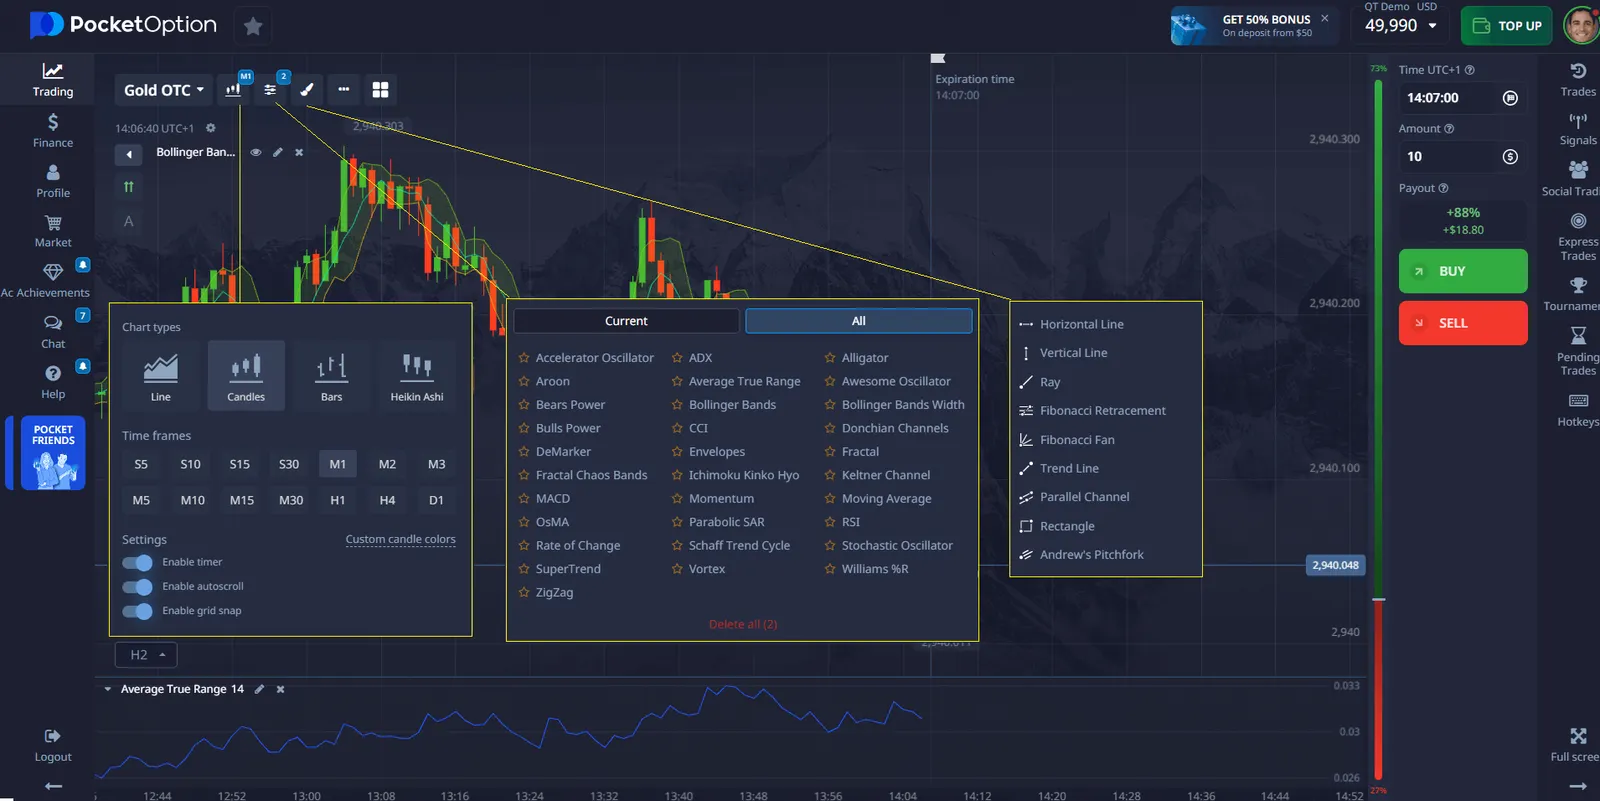
Jak Korzystać z Wzorców na Pocket Option
Chociaż Pocket Option nie oferuje automatycznego rozpoznawania wzorców, nadal możesz budować i analizować wzorce ręcznie, korzystając z dostępnych narzędzi:
Umożliwia to obserwowanie formowania się wzorców w czasie rzeczywistym i podejmowanie decyzji handlowych na ich podstawie.
Przykład: Zastosowanie Wzorca w Transakcji
1. Wybierz typ wykresu. Wykresy świecowe są najlepsze do identyfikacji wzorców.
2. Analizuj. Dodaj linie wsparcia/oporu lub linie trendu. Jeśli widzisz powtarzający się kształt (jak dwa szczyty na tym samym poziomie), może to być podwójny szczyt.
3. Potwierdź. Użyj wskaźnika, takiego jak RSI. Jeśli w tym samym czasie pokazuje warunki wykupienia, wzmacnia to twój sygnał.
4. Zdecyduj. Po wybiciu rozważ wejście w transakcję, jeśli wszystkie warunki są zgodne.
Wskazówki dla Początkujących
- Nie spiesz się — rozpoznawanie wzorców wymaga praktyki.
- Nigdy nie polegaj tylko na jednym kształcie — zawsze szukaj potwierdzenia.
- Zacznij od konta demo, aby ćwiczyć bez ryzyka.
- Prowadź dziennik wzorców — notuj, co zauważyłeś i jak się to rozwinęło.
Kluczowe Aspekty Podczas Korzystania z Wzorców
| Czynnik | Dlaczego Jest Ważny | Co Robić |
|---|---|---|
| Szybkość Analizy | Rynki mogą szybko się zmieniać | Obserwuj wykresy w czasie rzeczywistym |
| Dokładność Wzorca | Błędy mogą prowadzić do strat | Łącz ze wskaźnikami dla potwierdzenia |
| Jakość Danych | Zniekształcenia wpływają na decyzje | Używaj czystych, wiarygodnych źródeł cen |
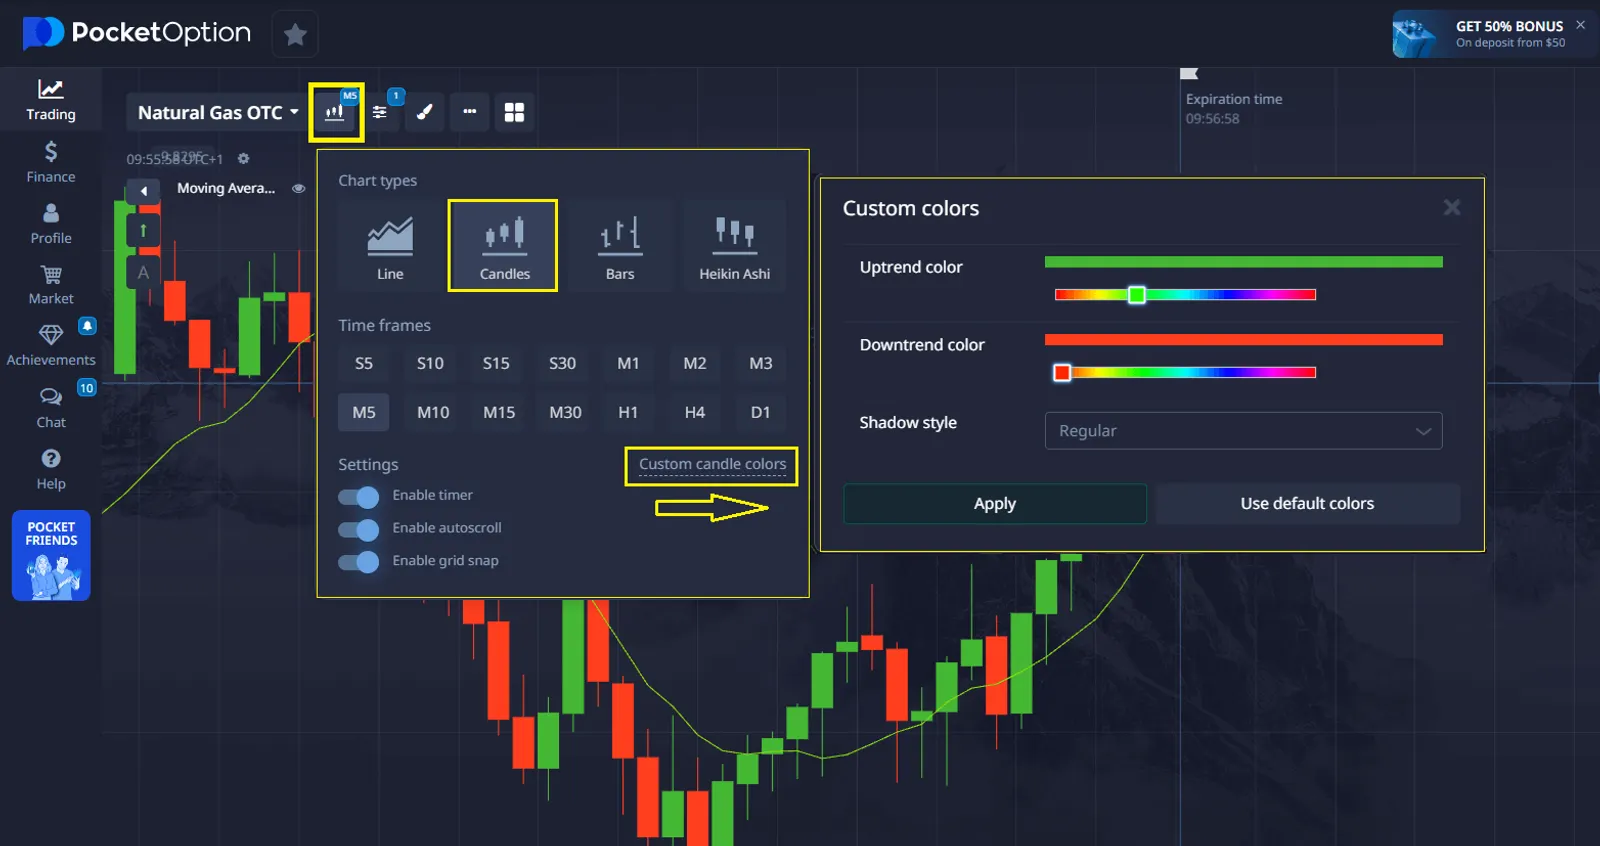
Pocket Option: Platforma Stworzona do Analizy Wykresów
Na Pocket Option możesz w pełni dostosować widok wykresu:
- Zmieniaj ramy czasowe
- Rysuj wzorce ręcznie
- Dodawaj wiele wskaźników
- Zapisuj i używaj ponownie szablonów
Ta konfiguracja ułatwia studiowanie i śledzenie zachowania wzorców na żywo.
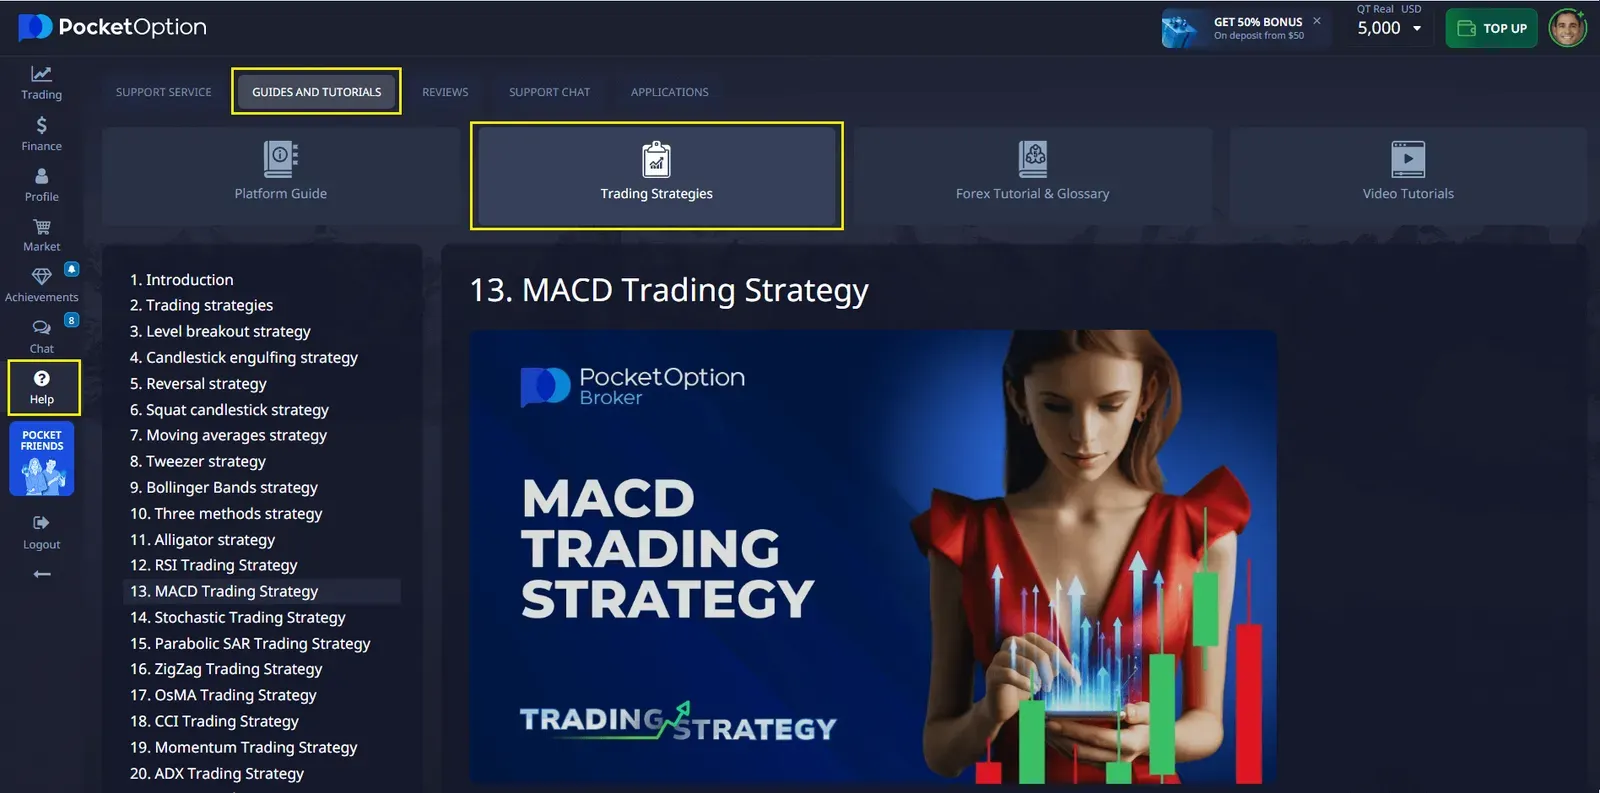
Ucz się Strategii w Sekcji Pomocy
Aby wspierać Twoje uczenie się, Pocket Option oferuje wbudowaną sekcję Pomocy z przewodnikami i tutorialami. Tam znajdziesz instrukcje dotyczące różnych strategii, które mogą Ci pomóc:
- Zrozumieć, jak działają różne wzorce
- Nauczyć się, jak stosować je w handlu
- Poprawić ogólne umiejętności analizy technicznej
To świetne miejsce do rozpoczęcia, jeśli chcesz budować pewność siebie krok po kroku.
Podsumowanie
Rozpoznawanie wzorców wykresów to cenna umiejętność dla traderów. Pomaga zrozumieć zachowanie rynku i podejmować decyzje na podstawie wzorców, które powtarzały się w czasie. Na Pocket Option możesz analizować wzorce ręcznie za pomocą elastycznych wykresów, wskaźników i narzędzi — a zawsze możesz eksplorować sekcję Pomocy, aby rozszerzyć swoje umiejętności i wypróbować sprawdzone strategie.
FAQ
Jaki jest główny cel rozpoznawania wzorców wykresów?
Rozpoznawanie wzorców wykresów pomaga zidentyfikować powtarzające się formacje cenowe, które mogą wskazywać na potencjalne ruchy rynkowe i możliwości handlowe.
Jakie ramy czasowe działają najlepiej dla rozpoznawania wzorców?
Większość wzorców działa skutecznie na wielu ramach czasowych, od wykresów 15-minutowych do dziennych, w zależności od Twojej strategii handlowej.
Czy narzędzia do rozpoznawania wzorców można dostosować?
Tak, większość platform umożliwia dostosowanie parametrów wykrywania wzorców, alertów i ustawień wizualizacji.
Ile czasu zajmuje nauka rozpoznawania wzorców?
Podstawowe rozpoznawanie wzorców można opanować w ciągu kilku tygodni, ale rozwinięcie biegłości wymaga zazwyczaj kilku miesięcy praktyki.
Gdzie mogę dowiedzieć się więcej o strategiach handlowych z wzorcami?
Odwiedź sekcję Pomocy w Pocket Option, aby uzyskać dostęp do samouczków i przewodników dotyczących korzystania z wzorców w rzeczywistych transakcjach. Wypróbuj strategie na demo!
Nauka
Sign up for more like this
Customize your newsfeed with content you're actually interested in — get up-to-date personalized newsletter in your inbox.
Your comment
Comments are pre-moderated to ensure they comply with our blog guidelines.