- Central bank policies and interest rate decisions
- Global economic growth indicators
- Geopolitical tensions and conflicts
- Currency market fluctuations
- Physical demand from jewelry and industry
- ETF flows and institutional positioning
- Mining production levels and costs
Gold price chart 10 years

Updated on 08 Jul 2025
Unlock the dynamics of gold price movements from 2014 to 2024, backed by technical analysis, market correlations, and actionable trading strategies. Learn how to navigate fluctuations influenced by economic events and explore practical tools like leverage options, technical indicators, and seasonal patterns to optimize your trading approach.
Article navigation
- Analysis of Gold price chart 10 years Dynamics
- Technical Analysis of Gold Chart 2014-2024
- Fundamental Price Movement Factors
- Gold Correlation with Other Assets
- Technical Indicators for Gold Trading
- Risk Management in Gold Trading
- Gold Price Seasonality
- Price Movement Forecast 2024-2025
- Gold Trading Features
- Why Choose Pocket Option for Gold Trading?
- Practical Trading Recommendations
Analysis of Gold price chart 10 years Dynamics
The gold market has experienced notable price fluctuations over the past decade, shaped by key global economic events. Reviewing the Gold price chart 10 years reveals significant turning points, such as market bottoms and record highs. Price trends often reflect broader market activity, with peak trading volumes during the active hours of the London and New York sessions.
| Year | Price Level (USD) | Key Event |
|---|---|---|
| 2014 | 1,385 | Federal Reserve ends QE3 |
| 2016 | 1,050 | Market bottom reached |
| 2019 | 1,546 | Trade war escalation |
| 2020 | 2,074 | Covid-19 pandemic peak |
| 2024 | 2,135 | New historical high |
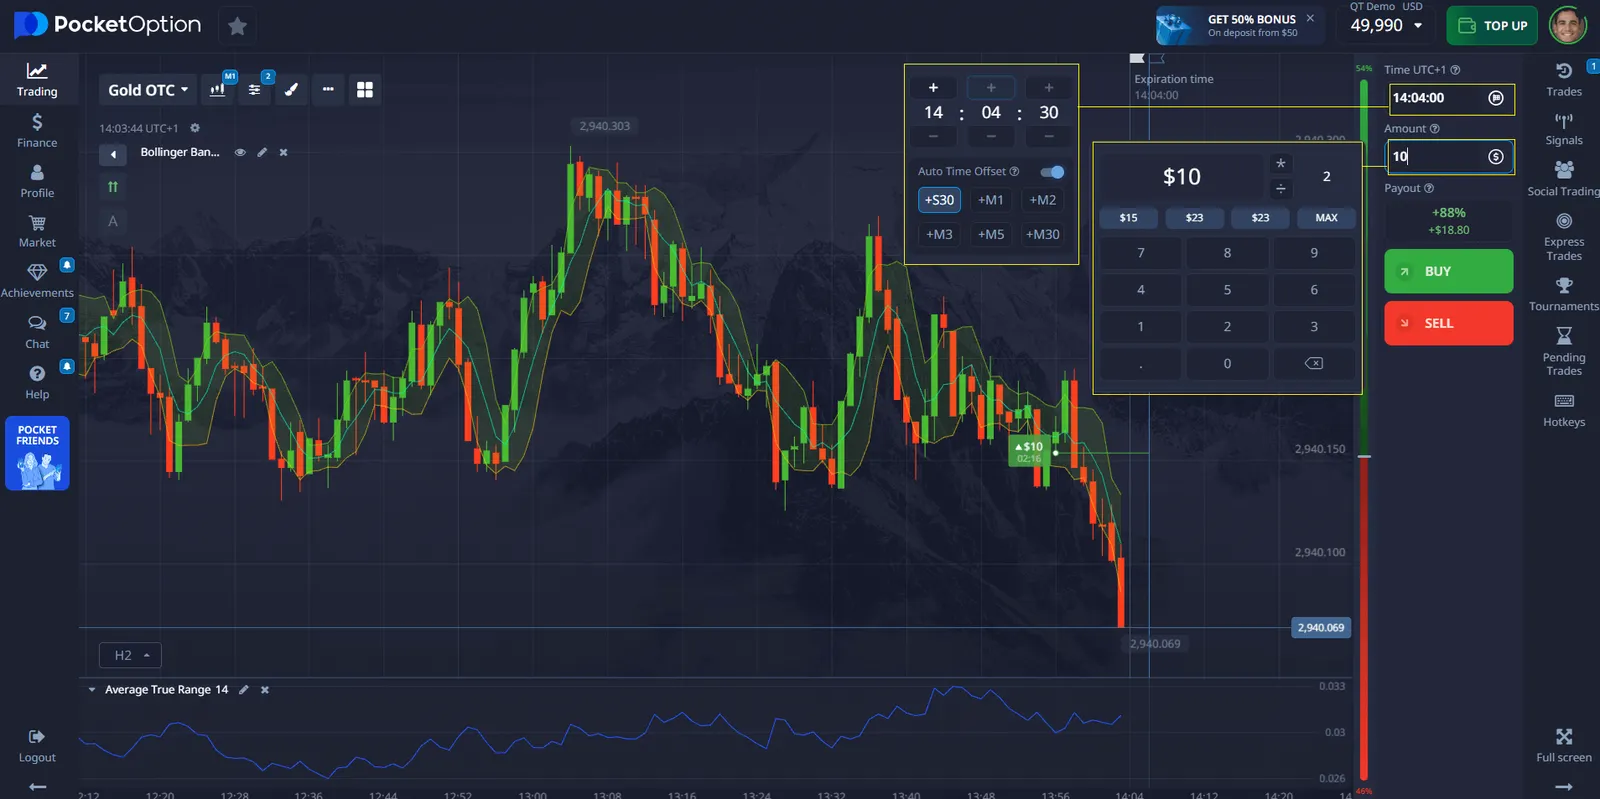
Shorter timeframes for day trading are available online on the Pocket Option platform! Register and trade with profitability up to 92% from 5 seconds!
Technical Analysis of Gold Chart 2014-2024
The Gold price chart 10 years highlights three distinct trading phases. From 2014 to 2016, the market saw a descending trend, finding strong support at $1,050. Between 2016 and 2019, prices shifted into an ascending channel, with resistance near $1,375. The period from 2020 to 2024 featured sharp growth, peaking above $2,000, followed by consolidation above $1,800.
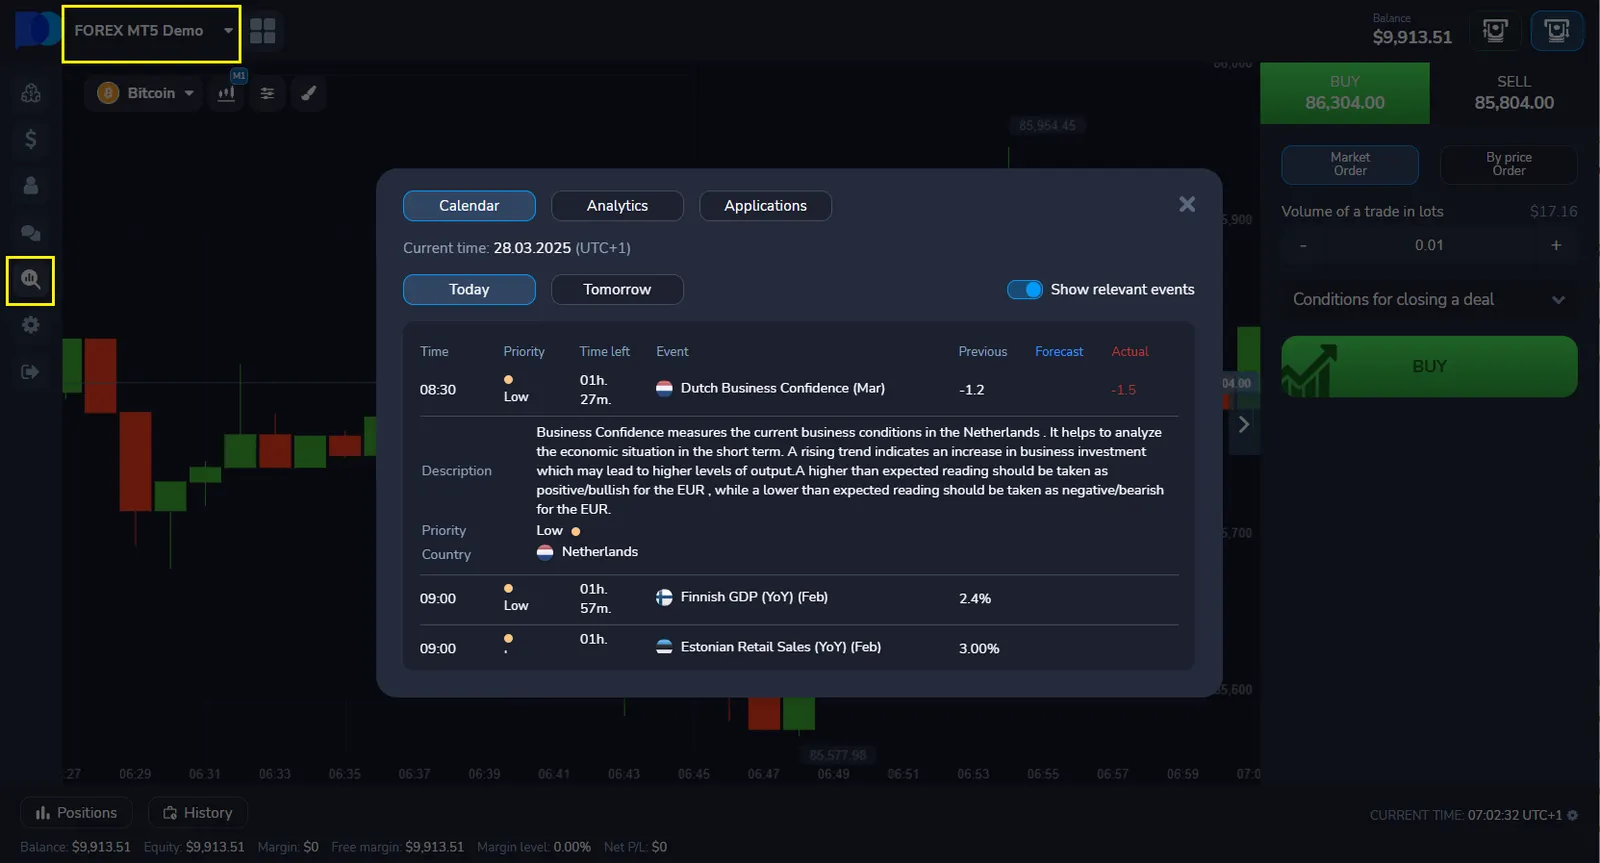
*Use the economic calendar and news on Pocket Option to make more informed trading decisions
Fundamental Price Movement Factors
Market fundamentals driving gold prices include:
Gold Correlation with Other Assets
The Gold price chart 10 years reveals important correlations between gold and other major financial instruments. During risk-off periods, gold often moves inversely to USD/JPY, with a strong negative correlation of -0.82. Similarly, in times of market stress, the S&P 500 shows a -0.65 correlation with gold prices. In contrast, EUR/USD typically aligns with gold, reflecting a positive correlation of +0.71. Commodity-linked currencies like AUD and CAD also show consistent positive correlations, often exceeding +0.60. Bitcoin’s relationship with gold is more variable, ranging between -0.40 and +0.55, depending on broader market conditions.
| Asset | Correlation | Market Condition |
|---|---|---|
| USD Index | -0.85 | Risk-off |
| EUR/USD | +0.71 | Normal |
| S&P 500 | -0.65 | Crisis |
| Oil | +0.45 | Inflation |
| Bitcoin | Variable | Mixed |
Technical Indicators for Gold Trading
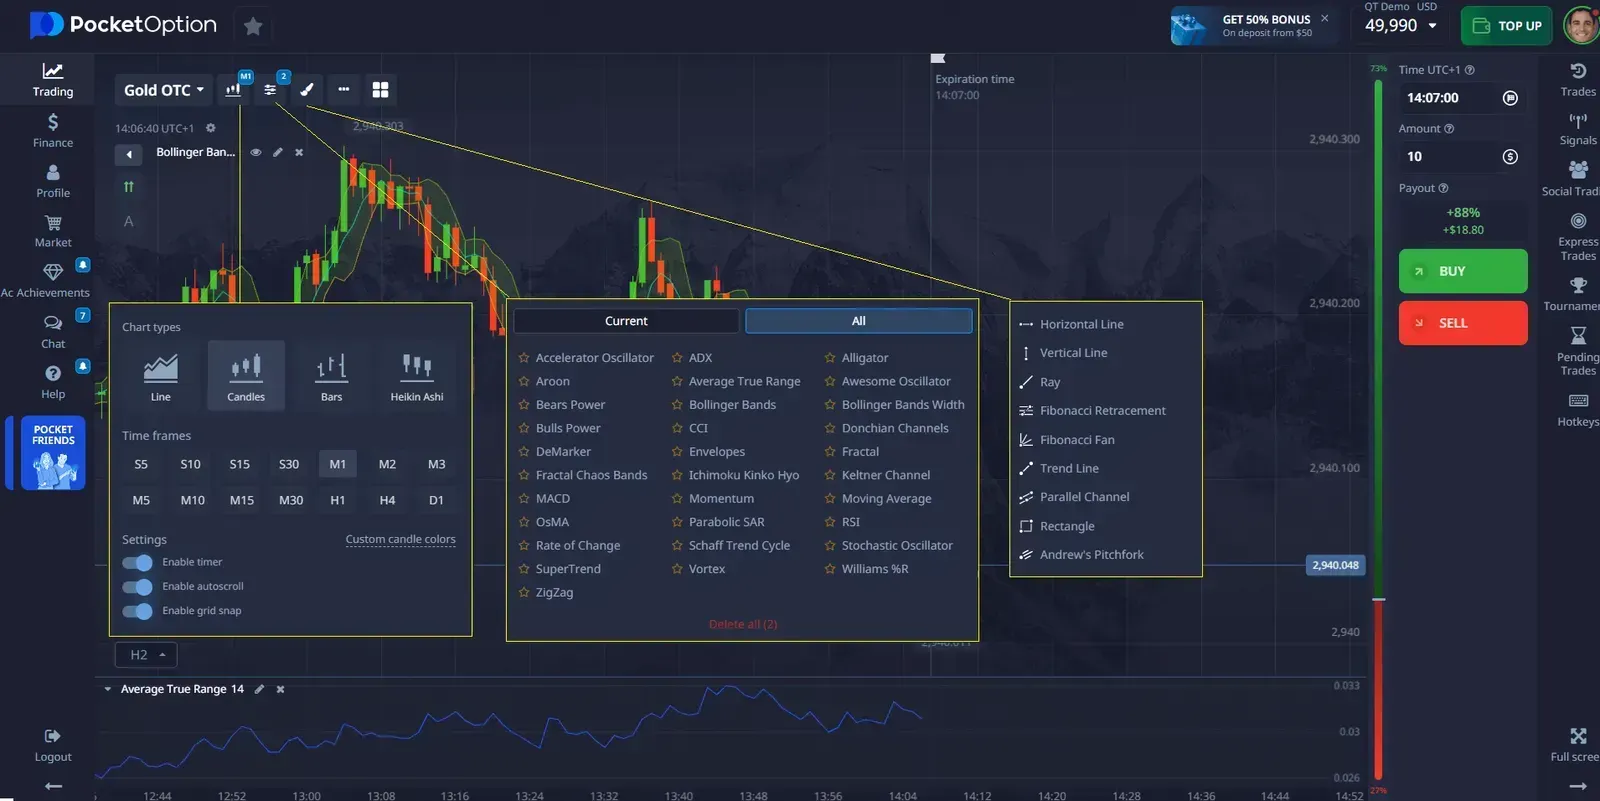
The Gold price chart 10 years highlights the value of technical analysis tools tailored to gold trading. The RSI indicator, with adjustable overbought and oversold levels at 30/70, helps identify potential price reversals. Moving averages of 10, 20, 50, and 200 periods are commonly used to track trends and momentum. MACD settings are fine-tuned for gold’s unique volatility, while Bollinger Bands, based on a 20-period standard deviation, provide insights into price deviations and breakout opportunities.
Short-term Trading Strategies
The Gold price chart 10 years provides valuable insights for short-term trading approaches. Effective strategies include scalping on 1-5 minute charts to capitalize on quick price movements, and momentum trading during high-impact news events. Break-and-retest patterns on 15-minute time frames are particularly useful for confirming entry points.
Try it on Pocket Option! Set up a timeframe chart and open trades from 5 seconds to 4 hours!
Medium-term Trading Approaches
Medium-term trading strategies, informed by the Gold price chart 10 years, benefit from advanced charting and detailed analysis. Traders often rely on weekly trend evaluations confirmed by 4-hour charts to refine their decisions.
Risk Management in Gold Trading
Effective risk management is essential for trading gold, as demonstrated by insights from the Gold price chart 10 years. Position calculators help determine optimal lot sizes based on account equity, ensuring trades are appropriately scaled. To minimize risk, exposure per trade is typically capped at 5%, with automated systems in place to monitor and prevent overleveraging.
| Risk Type | Recommended Level | Maximum Allowed |
|---|---|---|
| Position Size | 2% per trade | 5% per trade |
| Stop Loss | 1.5x ATR | 3x ATR |
| Daily Loss | 6% account | 15% account |
| Leverage | 1:50 | 1:500 |
Gold Price Seasonality
From January to March, prices typically rise by an average of 4.2%. Summer months are marked by lower volatility, with an average movement of 1.8%. The period from September to November historically presents the strongest trending opportunities, while December often sees a 2.5% average price increase. Trading volume analysis supports these trends, showing a 22% activity increase during peak months.
Price Movement Forecast 2024-2025
Based on insights from the Gold price chart 10 years, market analysis outlines potential scenarios for price movements. Key resistance levels are projected at $2,250 and $2,400, while support zones are identified at $1,980 and $1,850.
Trading Conditions Analysis
Insights from the Gold price chart 10 years outline the following key trading parameters for gold:
- Minimum trade size: 0.01 lots.
- Maximum position size: 50 lots.
- Spread: From 0.25 pips.
- Commission: None.
- Leverage options: 1:2 to 1:500.
- Execution speed: Less than 0.01 seconds.
Gold Trading Features
The Gold price chart 10 years showcases the importance of specialized features for effective trading execution. Real-time price feeds ensure accurate data by connecting to major liquidity providers. Traders can utilize various order types, including pending orders and OCO (One-Cancels-Other) options. Mobile trading capabilities provide full functionality comparable to desktop platforms, while an integrated economic calendar highlights key events impacting gold prices.
Why Choose Pocket Option for Gold Trading?
Looking to dive into gold trading? Pocket Option is your perfect partner. Launched in 2017, this international trading platform is designed to give you fast, secure access to global financial markets – no downloads or complicated setups required.
🔥 Forecast whether the price will go up or down, and if you’re right, earn up to 92% in profit! It’s that easy.
With a smooth, intuitive interface and a wide range of financial instruments, including gold (XAUUSD), Pocket Option is good for both new and experienced traders to make their mark.
Key Advantages of Pocket Option:
- Wide Range of Assets: Access over 100 financial instruments, including gold (XAUUSD), perfect for those who want to tap into gold’s market potential.
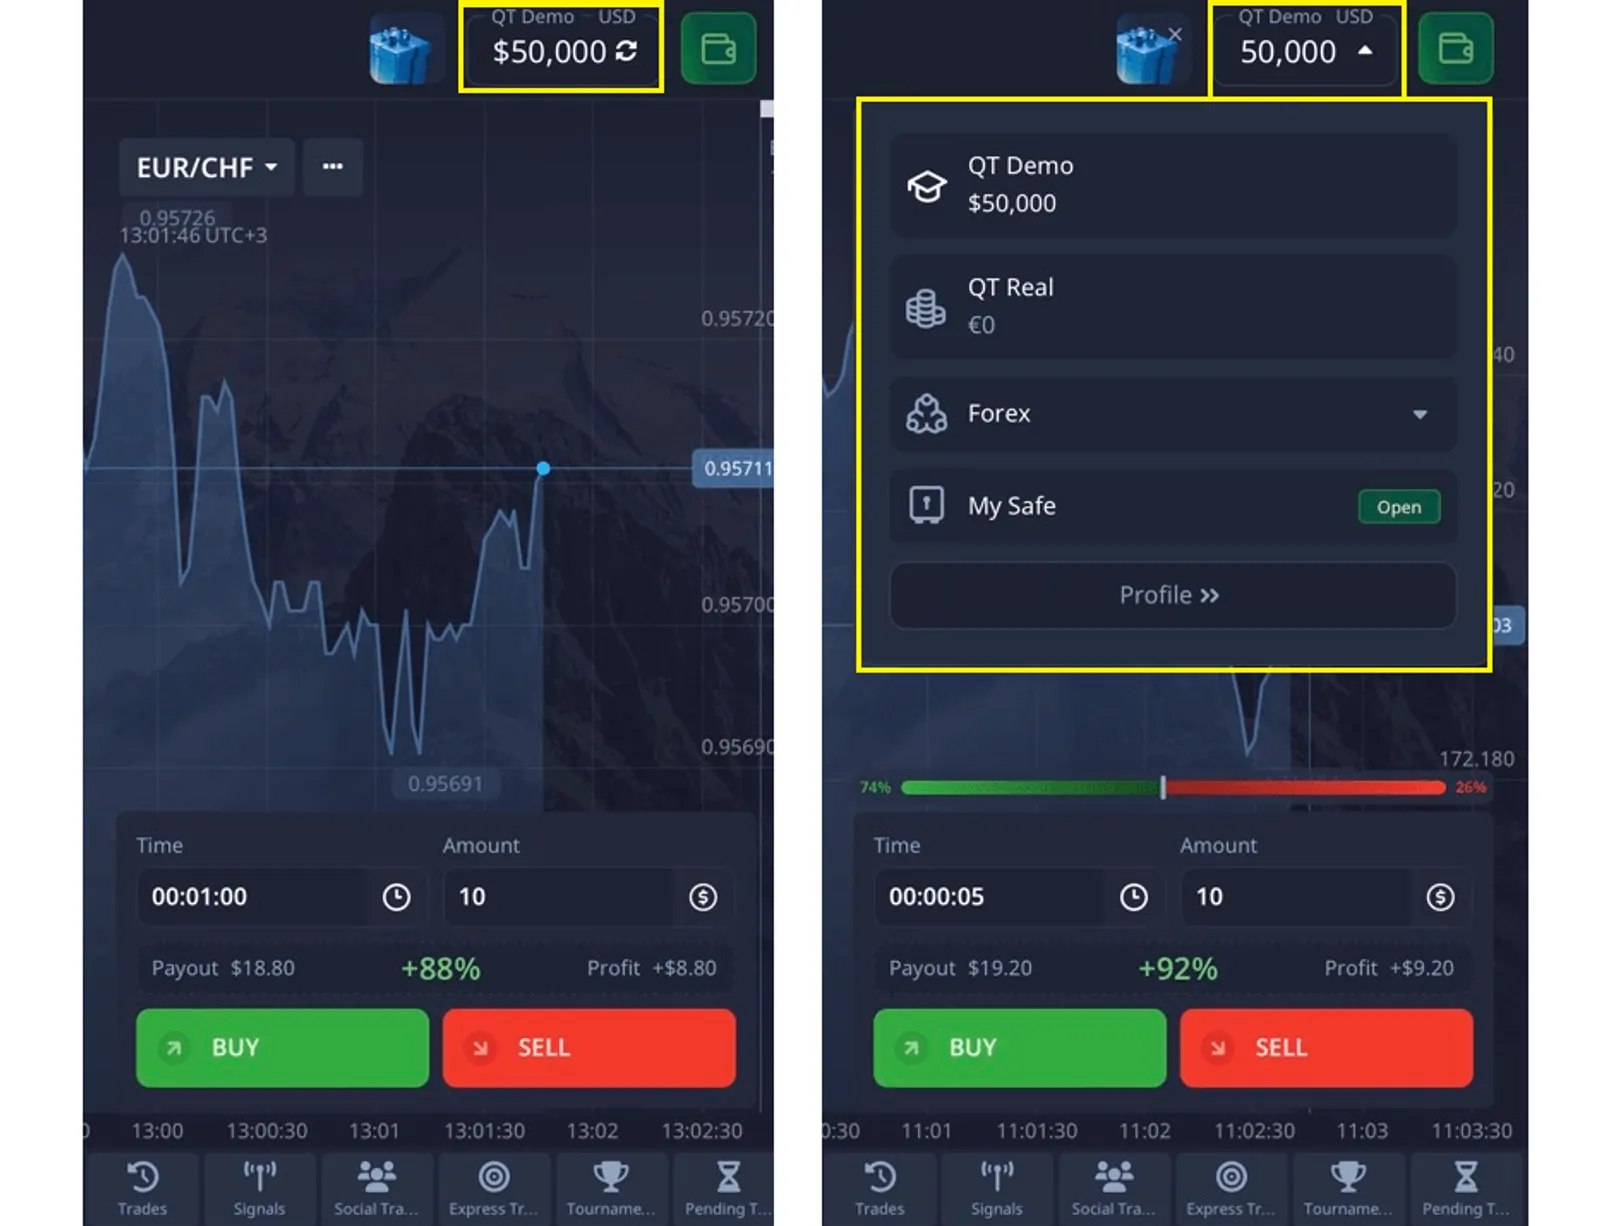
- $50.000 Demo Account: Test your strategies risk-free before diving in with real money.
Powerful Tools at Your Fingertips:
- Advanced Charting for Gold: Build custom charts with different timeframes to analyze trends and make more informed predictions. Whether you’re looking at short-term fluctuations or long-term patterns, you’ll have the tools you need to succeed.
- AI Trading and Bots: Automate your trades with smart algorithms, enhancing your trading efficiency and results.
- Social Trading: Want to learn fast? Copy successful traders and boost your profits while you grow your skills.
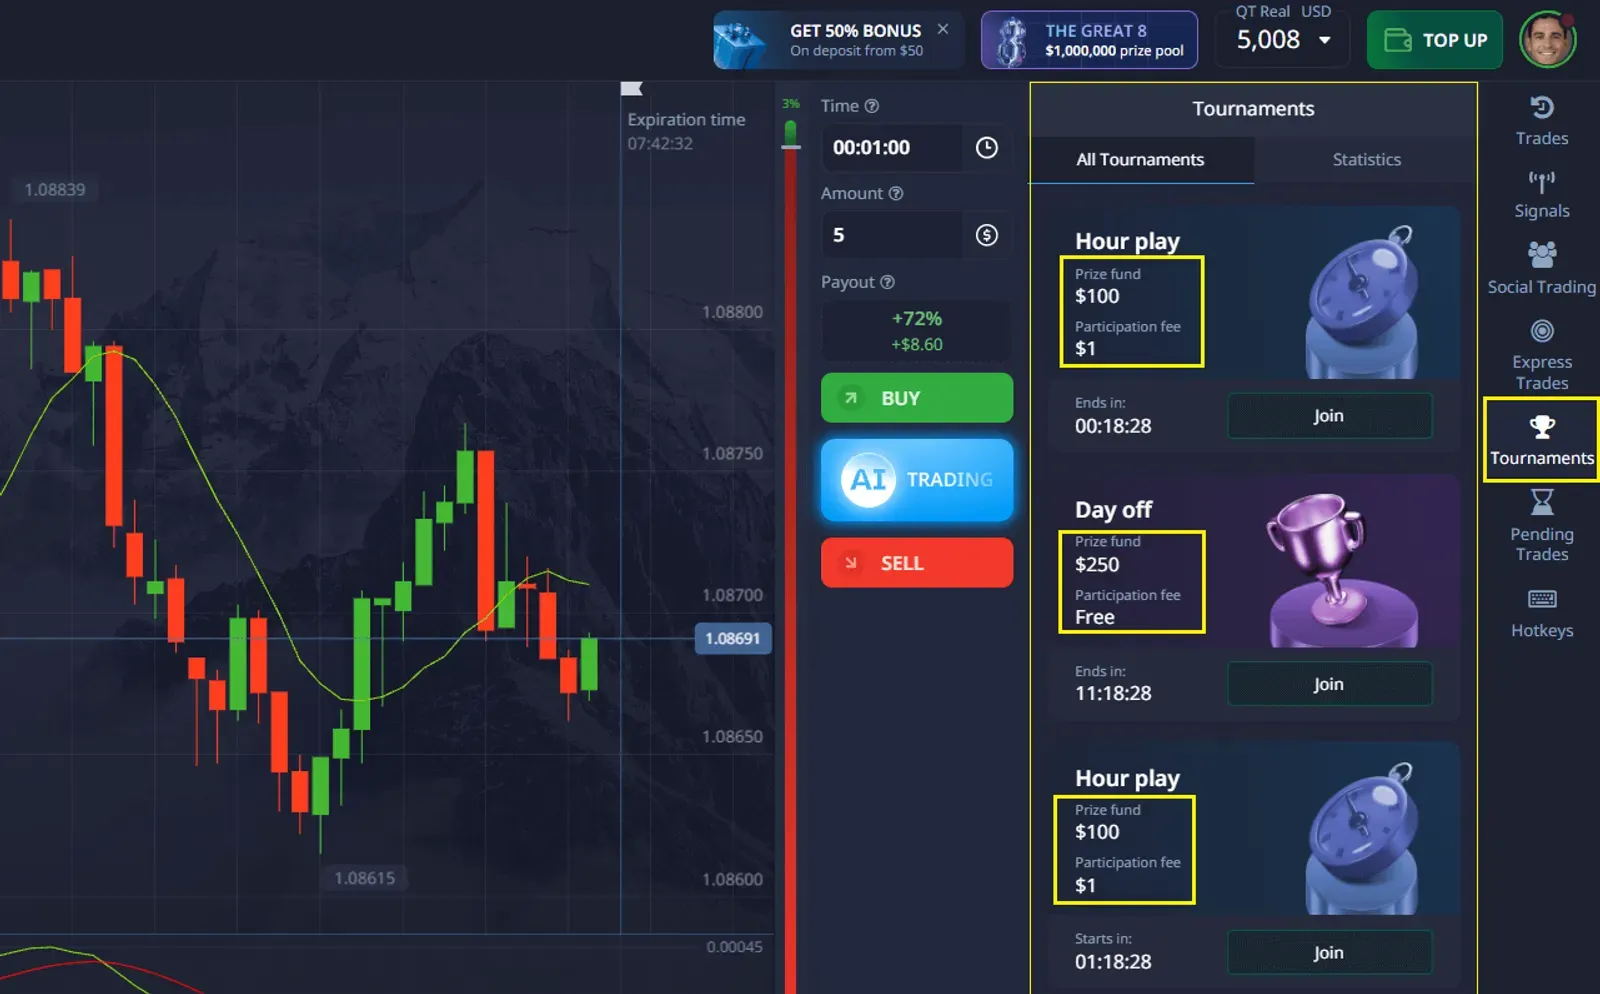
- Tournaments: Join in on trading competitions, show off your skills, and win exciting prizes!
Maximize Your Financial Potential:
- Bonuses and Promo Codes: Take advantage of special bonuses to supercharge your trading power.
- Flexible Payments: Over 50 deposit and withdrawal methods to suit users worldwide.
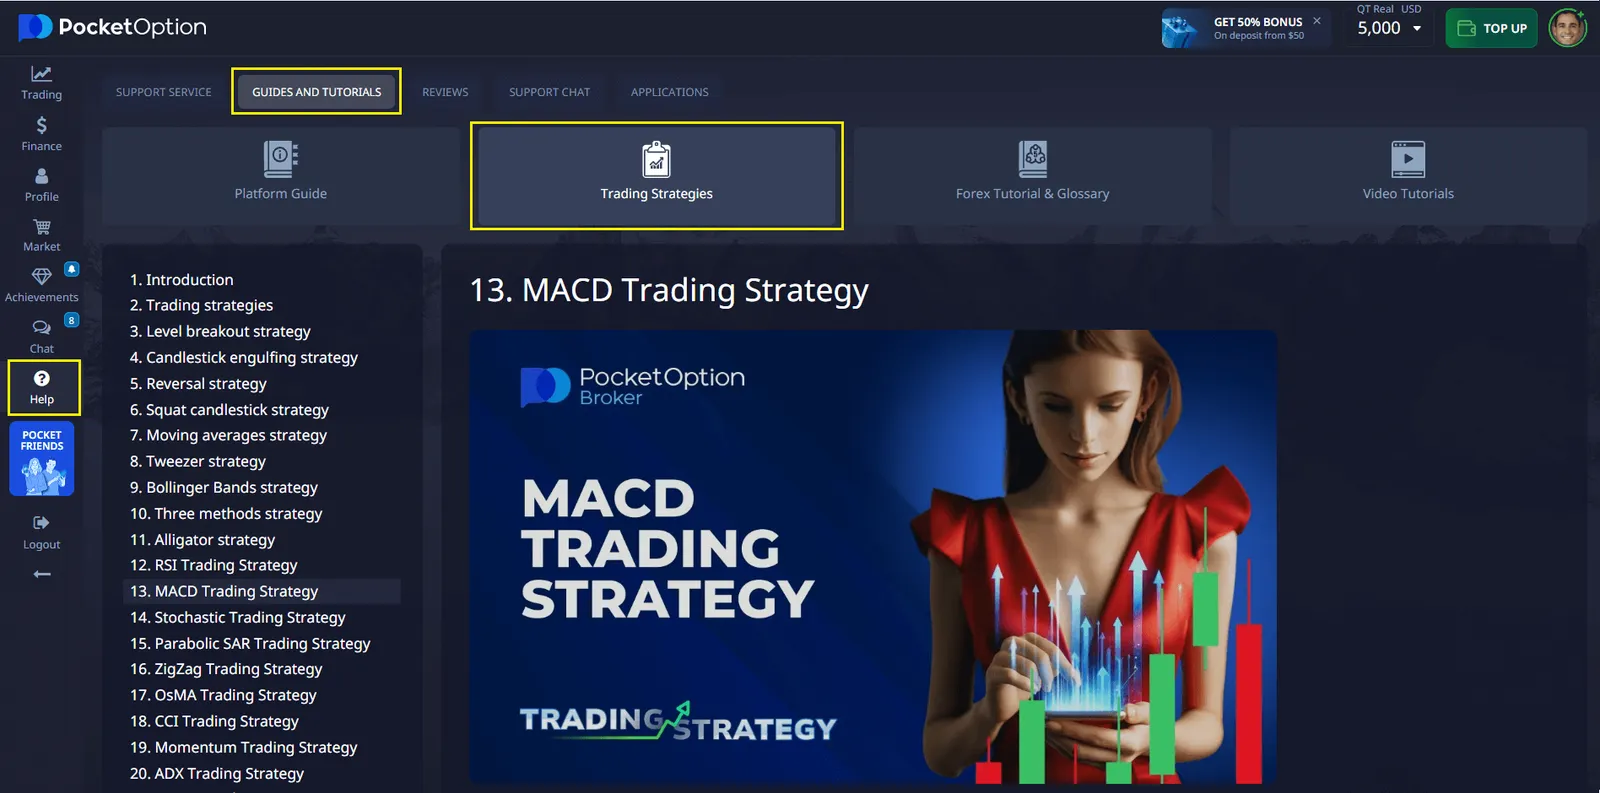
- Learning Materials: Gain access to tutorials, strategies, and market analysis to improve your trading knowledge.
✔️Mobile Trading for Busy Lifestyles:
Trade on the go with the Pocket Option mobile app. Whether you’re commuting, waiting in line, or enjoying a coffee break, you can make forecasts and earn profits whenever you have a minute to spare. The convenience of mobile trading means you never miss out on an opportunity.
Practical Trading Recommendations
Current market conditions suggest specific approaches for gold trading. Implement tight stop-losses during high-impact news events. Utilize multiple timeframe analysis for trade confirmation. Monitor correlation with USD index for additional signals. Trade size should not exceed 2% of account equity per position. Consider weekend gaps in risk calculations.
FAQ
What minimum deposit is required for gold trading?
The minimum deposit requirement is $5 for standard accounts.
What are the trading hours for gold?
Trading hours run 24/5, Monday 00:00 to Friday 23:59 GMT.
Can I use automated trading systems for gold?
Yes, supports both manual and automated trading strategies.
Markets
Sign up for more like this
Customize your newsfeed with content you're actually interested in — get up-to-date personalized newsletter in your inbox.
Your comment
Comments are pre-moderated to ensure they comply with our blog guidelines.